Article
The Complex Subtype-Dependent Role of Connexin
43 (GJA1) in Breast Cancer
Mélanie Busby1, Michael T. Hallett2and Isabelle Plante1,*
1 INRS-Institut Armand-Frappier, Laval, QC H7V 1B7, Canada; [email protected]
2 Centre for Structural and Functional Genomics, Department of Biology, Concordia University,
Montreal, QC H4B 1R6, Canada; [email protected]
* Correspondence: [email protected]
Received: 31 January 2018; Accepted: 26 February 2018; Published: 28 February 2018
Abstract:Gap junction transmembrane channels allow the transfer of small molecules between the
cytoplasm of adjacent cells. They are formed by proteins named connexins (Cxs) that have long been considered as a tumor suppressor. This widespread view has been challenged by recent studies suggesting that the role of Connexin 43 (Cx43) in cancer is tissue- and stage-specific and can even promote tumor progression. High throughput profiling of invasive breast cancer has allowed for the construction of subtyping schemes that partition patients into at least four distinct intrinsic subtypes. This study characterizes Cx43 expression during cancer progression with each of the tumor subtypes using a compendium of publicly available gene expression data. In particular, we show that Cx43 expression depends greatly on intrinsic subtype. Tumor grade also co-varies with patient subtype, resulting in Cx43 co-expression with grade in a subtype-dependent manner. Better survival was associated with a high expression of Cx43 in unstratified and luminal tumors but with a low expression in Her2e subtype. A better understanding of Cx43 regulation in a subtype-dependent manner is needed to clarify the context in which Cx43 is associated with tumor suppression or cancer progression.
Keywords:gap junctions; Connexin 43 (Cx43); breast cancer; survival analysis; intrinsic subtype
1. Introduction
Connexin 43 (Cx43), a protein encoded by the Gap Junction protein alpha 1 gene (GJA1), forms gap junction transmembrane channels facilitating communication between the cytoplasm of two adjacent cells. Small molecules, including metabolites, second messengers and electrical signals pass through these channels in a process called Gap Junction Intercellular Communication (GJIC). Cx43 transcription
is thought to be regulated both by transcription factors and by epigenetic mechanisms [1], but is also
regulated at the protein level by post-transcriptional modifications, trafficking to and from the plasma
membrane and gating of the channels [2].
The breast epithelium is composed of two layers of cells: an inner layer of luminal cells surrounded by an outer layer of basal cells, composed mainly of myoepithelial cells but also comprising stem and
progenitor cell populations [3]. It is well established that Cx43 is expressed mainly in the basal layer;
however, a few studies showed Cx43 expression in luminal cells [4–6]. A study using transmission
electron microscopy reported gap junctions to be present between the basal and the luminal layers in
normal breast tissues, although the exact connexin involved was not determined [7]. A few studies
have also demonstrated the expression of Cx43 in fibroblasts surrounding the breast epithelium and in endothelial cells [8–10].
The role of Cx43 in breast cancer is controversial. On the one hand, Cx43 has long been considered
a tumor suppressor [11] with studies demonstrating it was under-expressed at the mRNA and the
protein level in cancer cell lines [12,13] or aberrant localization and phosphorylation in tumors [12–16].
Cx43 has also been linked to the control of processes associated with breast cancer progression and
metastasis such as proliferation, invasion, migration and apoptosis [17]. Moreover, it was shown in
vivo and in vitro that metastatic capacity was increased in tumors cells showing a weak GJIC capacity
and a lower number of gap junction plaques [18,19]. Re-expression of Cx43 in tumor cells led to
reduced growth of tumors in nude mice and fewer metastases to the lungs [20,21]. Mice expressing a
mutant form of Cx43 (G60S) also showed increased breast tumor metastasis to the lung [3].
On the other hand, much evidence suggested that Cx43 is involved in later stages of breast cancer progression. For instance, it has been suggested that Cx43 mediates the interaction between tumor and
endothelial cells to facilitate adhesion and extravasation at secondary sites [22–24]. Cx43 has also been
found to be expressed at higher levels in lymph node metastasis than in the corresponding primary
tumor [25]. The context of expression that allows Cx43 to act as a tumor suppressor or promoter has
not been elucidated and therefore precludes its targeting in breast cancer therapies [11].
Breast cancer is highly heterogeneous, with both intra- and inter-tumoral molecular variability. During the last decade, high throughput techniques have generated a body of new data in many diseases including breast cancer. Genome-wide gene expression profiling has produced classification schemes including the intrinsic subtypes consisting of luminal A (LumA), luminal B (LumB), basal-like and HER2-enriched (Her2e) tumors. Luminal tumors are generally characterized by the expression of the estrogen receptor alpha (ERα) and the progesterone receptors (PR). Most Her2e tumors harbor a genomic amplification of chromosome 17q12 that contains the erb-b2 receptor tyrosine kinase 2 gene (ERBB2/HER2). Approximately half of Her2e tumors express ERα. Basal-like tumors are often negative
for ERα or PR receptors as well as for HER2 and also express basal cytokeratins [26,27].
This study aims to investigate Cx43’s ambiguous role during cancer progression with each of the breast tumor intrinsic subtypes using a compendium of publicly available gene expression data with large samples. Here, we report that Cx43 expression depends greatly on intrinsic subtype. Tumor grade also co-varies with patient subtype, resulting in Cx43 co-expression with grade in a subtype-dependent manner. Better survival was associated with a high expression of Cx43 in unstratified and luminal tumors but with a low expression in the Her2e subtype.
2. Results
2.1. GJA1 Expression and Localization in the Breast
We first investigated the tissue localization and level of expression of Cx43 protein in human samples of both morphologically normal breast tissue and tumors using the Human Protein Atlas. This is a public database containing a large collection of normal and cancer tissue slides which have
been probed with various antibodies followed by a hematoxylin counterstain [28]. Cx43 is a membrane
channel and is usually considered to be expressed in the myoepithelial cell. A typical punctate staining of junctional plaques formed by Cx43 channels was observed for normal tissues. The staining could be
observed in the myoepithelial layer, as expected, but also in some luminal cells (Figure1a). Although
an under-expression of Cx43 protein is observed in some of the 21 cancer samples available (Figure1a),
others show a clear over-expression, mostly in well differentiated luminal-like neoplastic cells, which
did not appeared to be associated with a basal layer (Figure1c). In other samples, Cx43 could also
be seen in a layer of cells separating neoplastic tissue from stroma, although this layer sometimes
adhered poorly to both adjacent compartments (Figure1d,e). Cx43 was also observed in samples with
poorly differentiated cell and tissue morphology (Figure1f,g). Interestingly, Cx43 protein could also
be found in spindle-shaped cells in the stroma (Figure1h). Overall, some normal punctate patterns
could be observed in some tumors (Figure1d) while the majority of the samples showed either a
Breast Cancer −2 0 2 4 6 8 n = 550, wilcoxson =0.0089 ** n = 550 GJA1
mNRA (log2 ratio)
Normal
breast Breast cancer
−2 0 2 4 6 −3 −2 −1 0 1 2 GJA1 mRNA Cx43 protein
Pearson's rho : 0.657 p.value: 2.724e−13 , n = 97
Cx43 protein (lo2 ratio)
GJA1 mNRA (log2 ratio) r = 0.657 n = 97
i
j
Breast LumA LumB Basal Her2ed
c
b
a
h
g
f
e
Figure 1. (a–h) The Human Protein Atlas normal and breast cancer tissue staining by immunohistochemistry
for Connexin 43 (Cx43) (CAB010753 antibody). (a) Normal breast. Insert: Arrow head: myoepithelial cell’s staining; arrow: luminal cell’s staining. (b–h) Breast cancer tissue, (h) arrow: staining of spindle shaped stromal cells. Scale bar = 100 µm. (i) GJA1 mRNA expression in breast tumor vs. adjacent normal breast tissue in the The Cancer Genome Atlas (TCGA) dataset. p value: * <0.05; ** <0.01; *** <0.001. (j) Scatter plot showing Cx43 protein and GJA1 mRNA level in tumors. In the legend, “Breast” indicates adjacent normal breast tissue. Pearson’s correlation coefficient is given (r).
We next compared transcript levels of GJA1 in breast tumor samples and in the non-cancerous adjacent tissues using microarray-based data of The Cancer Genome Atlas project (TCGA) breast invasive carcinoma cohort (BRCA) of clinical samples. We observed a far greater variance in mRNA expression in tumor samples compared to tumor adjacent morphologically normal breast tissue
(Figure1i, the Fligner–Killeen test of homogeneity of variances, p value < 10−12). We also used whole
sample Cx43 protein levels obtained for 105 TCGA samples by mass spectrometry. GJA1 mRNA and
protein level are significantly correlated (Figure1j, (Pearson correlation rho = 0.6515, p value < e−13).
Our results confirm that, in breast cancer, GJA1 is concurrently dysregulated at both the protein and the mRNA level.
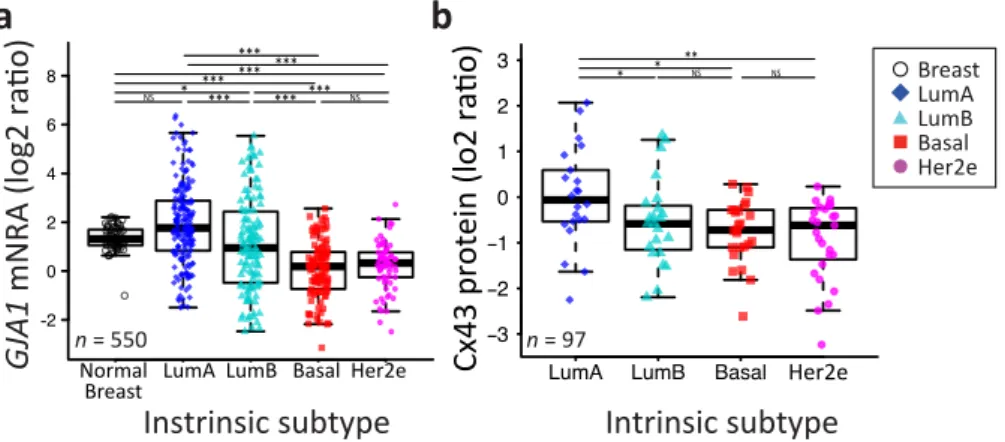
2.2. GJA1 Expression Varies with Breast Cancer Subtype
We then speculated that GJA1 variability could be linked to the molecular heterogeneity of breast cancer. When we compared GJA1 mRNA expression after stratifying patient samples by their intrinsic
subtype (Pam50 by genefu [29]) (Figure2a), the increase in variance in gene expression of tumor
samples relative to normal tissue was observed in every subtype. The LumA had a mean expression level statistically indistinguishable from morphologically normal samples, but a small significant
LumA LumB Basal Her2 −3 −2 −1 0 1 2 3
GJA1 protein vs Subtype
Subtype GJ A1 protein n = 97 , Kruskal = 0.0161 n = 97 * * **NS NS Her2e
Breast LumA LumB Basal Her2
−2 0 2 4 6 8
GJA1 mRNA vs Subtype in tcga
Subtype GJ A1 mRNA n = 488 , Kruskal = 0 n = 550
Instrinsic subtype
NS * *** ****** ****** NS *** ***GJA1
mNRA (log2 ratio)
Intrinsic subtype
Normal LumA LumB Basal Her2e Breast
a
b
Cx43 protein (lo2 ratio)
Breast LumA LumB Basal Her2e
Figure 2.The GJA1 expression level is more variable in breast tumor than in normal tissue and varies
with subtype. (a) The GJA1 mRNA level in normal breast tissue and in each tumor intrinsic subtype. (b) The Cx43 protein level in each intrinsic subtype. In the legend, “Breast” indicates adjacent normal breast tissue. All data are from the TCGA dataset. p value: * <0.05; ** <0.01; *** <0.001; NS Not statistically significant.
A similar pattern was observed in the four other datasets, although normal breast tissues were
only used in TCGA and Curtis datasets (FigureA1). A similar pattern was also observed at the protein
level in the TCGA dataset (Figure2b). Together, these results suggest that the expression of GJA1
is strongly associated with tumor subtype and is more variable in each subtype in comparison to morphologically normal tissue.
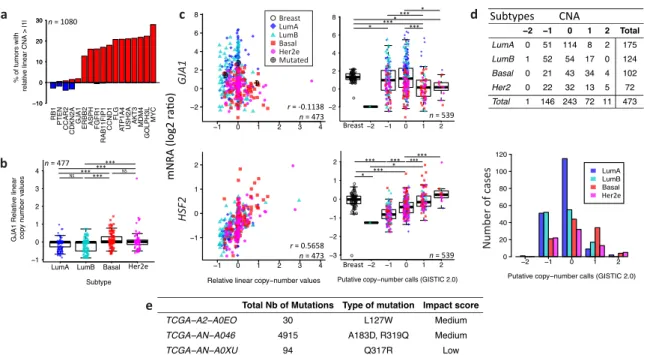
2.3. Somatic DNA-Level Events of GJA1 Do Not Drive Expression Changes of GJA1 in Breast Cancer We next asked if underlying DNA-level somatic copy number changes in the genomic loci harboring GJA1 influence gene expression levels. For the TCGA dataset, a few tumors had amplification
or deletion of GJA1, compared to genes known to be amplified in breast cancer (Figure3a).
Moreover, tumors with GJA1 amplification did not show an increase in expression while only
deep deletions reduced expression (−2 in called copy number, as shown in Figure3c). Most luminal
tumors with the highest expression of GJA1 were found to have either a normal copy number or
single deletion (Figure3b–d). Moreover, in tumors with a GJA1 gain or amplification, a slight but
significant decrease in expression, rather than an increase, could be observed compared to normal
tissues (Figure3c). GJA1 mRNA also weakly negatively correlated with DNA copy number (Figure3c),
suggesting that Cx43 over-expression in breast cancer is not driven by DNA amplification. To validate our procedure, we used the HSF2 gene, a close neighbor of GJA1 on chr6q22 which shares similar copy number in 99% of TCGA’s breast cancer cases. In contrast to what was observed for GJA1, HSF2
mRNA was positively correlated with the copy number of its own gene (Figure3c). Moreover, somatic
point mutation data showed that, in the TCGA cohort, only three breast cancer patients out of 977
harbored at least one GJA1 mutation, accounting for 0.31% of the tumors (Figure3e). Only one tumor
with an extremely high number of total mutations (TCGA-AN-A046) was found to have both a GJA1
mutation and a slightly higher expression of the gene (2.76) compared to normal range (−1.01 to 2.20)
(Figure3c,e). Together, these results argue that loss or amplification of the GJA1 gene likely does not
Total Nb of Mutations 30 TCGA−A2−A0EO Type of mutation 4915 TCGA−AN−A046 Impact score 94 TCGA−AN−A0XU L127W A183D, R319Q Q317R Medium Medium Low e −2 −1 0 1 2 LumA LumB Basal Her2
Distribution of breast cancer subtypes by CNA in TCGA
Putative copy−number calls (GISTIC 2.0)
Number of cases 0 20 40 60 80 100 120 Her2e Number of cases −2 0 LumA −1 1 LumB 0 0 Basal 1 0 Her2 2 1 Total Total 51 52 21 22 146 114 54 43 32 243 8 17 34 13 72 2 0 4 5 11 175 124 102 72 473 CNA Subtypes d RB1 PTEN CCAR2 CDKN2A GJ A1 ERBB2 ASPH FGFR1 RAB11FIP1
CCND1 FLG ATP1A4 USH2A AKT3 MDM4
GOLPH3L
MYC
Copy number per gene
% of tumors with relativ e linear CNA > |1| −10 0 10 20 30 −10 0 10 20 30 n = 1080 a n = 1080
LumA LumB Basal Her2 −1 0 1 2 3 4 Subtype GJ A1 Relativ e linear cop y n umber v alues n = 477 NS ********* NS *** n = 477 Her2e b Br. −2 −1 0 1 2 −2 0 2 4 6 8
Putative copy−number calls (GISTIC 2.0)
GJ A1 e xpression (microarr ay) n = 539 −1 0 1 2 3 4 −2 0 2 4 6 8
Relative linear copy−number values
GJ A1 e xpression (microarr ay) n = 477 * *** *** *** * * n = 539 r = -0.1138 n = 473 Breast Br. −2 −1 0 1 2 −3 −2 −1 0 1 2
Putative copy−number calls (GISTIC 2.0)
HSF2 e xpression (microarr ay) n = 539 −1 0 1 2 3 4 −1 0 1 2
Relative linear copy−number values
HSF2 e xpression (microarr ay) n = 477 n = 539 * *** * *** *** ****** r = 0.5658 n = 473 Breast c
mNRA (log2 ratio)
GJA1 HSF2 Breast LumA LumB Basal Her2e Mutated
Figure 3. Somatic DNA-level events of GJA1 do not drive expression changes of GJA1 in breast
cancer. (a) Percentage of tumors with a relative linear copy number >1 (amplification, in red) and <−1
(hemi- or homozygous deletion, in blue) for GJA1 compared to other genes known to be altered in breast cancer. (b) Relative linear copy number value for each breast cancer subtype. (c) Somatic copy number alteration and putative copy number calls against mRNA expression for GJA1 and HSF2. Copy
number calls were computed by TCGA using GISTIC 2.0 (−2, Homozygous deletion;−1, Hemizygous
deletion; 0, Neutral/no change; 1, Gain; 2, High level amplification). Pearson’s correlation coefficient between relative linear copy number value and mRNA expression is given GJA1 and HSF2. In the legend, “Breast” indicates adjacent normal breast tissue. (d) Contingency table and barplot showing the distribution of copy number alteration (CNA) by subtype. Due to the small number of samples
in−2 and 2 CNA, Fisher’s exact test was applied on−1, 0 and 1 CNA. (e) Total number and GJA1
mutations observed in the 3 cases out of 988 patients. All data from the TCGA dataset. p value: * <0.05; ** <0.01; *** <0.001; NS Not statistically significant.
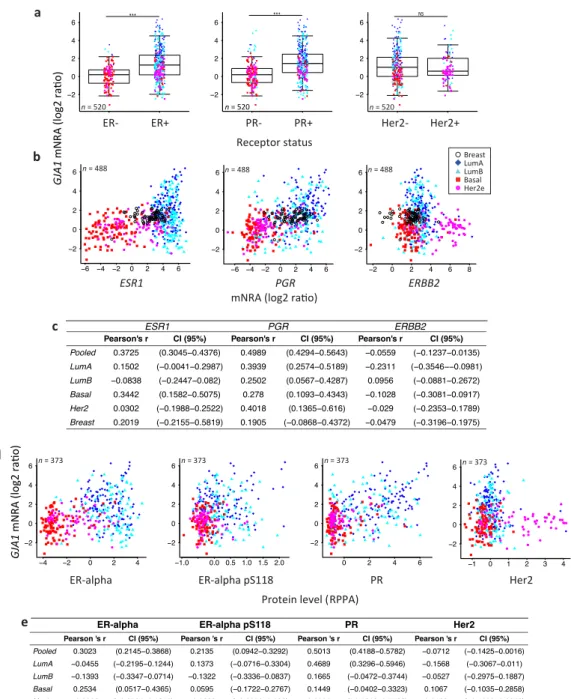
2.4. GJA1 Level Is Dependent on Hormonal Receptor Status
Because Cx43 level varies through the mammary gland development and the reproductive cycle, it has been suggested that it could be regulated by hormones, similar to what has been observed in
other tissues [4,30–32]. We thus next investigated whether the GJA1 mRNA level was directly linked
with hormonal receptors status.
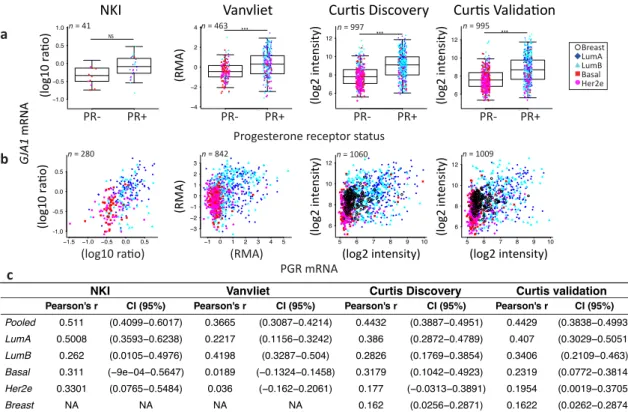
Consistent with the subtype-specific expression of Cx43, ERα- or PR-positive breast tumors had a significantly higher expression of GJA1 mRNA compared to ERα- or PR-negative tumors
(Figures4a andA1–A3). Results were similar for all five datasets, except for PR in the NKI dataset
where the low number of samples did not allow statistical significance to be reached (Figures4a,
A2a andA3a). However, there were no strong correlations between GJA1 expression and ESR1
mRNA, with total protein level (ERα), or with the activated form of ERα phosphorylated on serine
118 (ERα_pS118) (Figures4b–e and A1b,c). While only weak correlations were observed in most
individual subtypes, a stronger correlation between GJA1 and ESR1 mRNA and protein was observed
when the tumors were pooled (Figure4b–d). As expected, ESR1 mRNA was better correlated with
total ERα (Pearson’s rho = 0.9011, Spearman’s rho = 0.8969) than with ERα_pS118 proteins (Pearson’s rho = 0.5459, Spearman’s rho = 0.6407).
e Pearson 's r 0.3023 Pooled CI (95%) −0.0455 LumA Pearson 's r −0.1393 LumB CI (95%) 0.2534 Basal Pearson 's r −0.0936 Her2 CI (95%) (0.2145−0.3868) Pearson 's r (−0.2195−0.1244) CI (95%) (−0.3347−0.0714) (0.0517−0.4365) (−0.3534−0.1611) 0.2135 0.1373 −0.1322 0.0595 −0.0663 (0.0942−0.3292) (−0.0716−0.3304) (−0.3336−0.0837) (−0.1722−0.2767) (−0.3258−0.189) 0.5013 0.4689 0.1665 0.1449 0.2304 (0.4188−0.5782) (0.3296−0.5946) (−0.0472−0.3744) (−0.0402−0.3323) (−0.1616−0.5566) −0.0712 −0.1568 −0.0527 0.1067 0.0122 (−0.1425−0.0016) (−0.3067−0.011) (−0.2975−0.1887) (−0.1035−0.2858) (−0.1983−0.2276)
ER-alpha ER-alpha pS118 PR Her2
−1 0 1 2 3 4 −2 0 2 4 6 HER2 RPPA.tcga.compatible GJ A1 (A_24_P55287)
X: HER2 RPPA.tcga.compatible in tcga (probe A_23_P101057) Y: GJA1 exprs in tcga (probe A_24_P55287)
● ● ● ● ● ● ● ● ● ● ● ● ● ● ● ● ● ● ● ● ● ● ● ● ● ● ● ● ● ● ● ● ● ● ● ● ● ● ● ● ● ● ● ● ● ● ● ● ● ● ● ● ● ● ● ● ● ● ●
(Subtype Pooled patient for which pam50.genefu contain Pooled , n = 373 ) n = 373 0 2 4 6 −2 0 2 4 6 PR RPPA.tcga.compatible GJ A1 (A_24_P55287)
X: PR RPPA.tcga.compatible in tcga (probe A_23_P101672) Y: GJA1 exprs in tcga (probe A_24_P55287)
● ● ● ● ● ● ●● ● ● ●● ● ●● ● ● ● ● ● ● ● ● ● ● ● ● ● ● ● ● ● ● ● ● ● ● ● ● ● ● ● ● ● ● ●● ● ● ● ● ● ● ● ● ● ● ● ●
(Subtype Pooled patient for which pam50.genefu contain Pooled , n = 373 ) n = 373 PR protein (RPPA) −1.0 0.0 0.5 1.0 1.5 2.0 −2 0 2 4 6 ER−alpha_pS118 RPPA.tcga.compatible GJ A1 (A_24_P55287)
X: ER−alpha_pS118 RPPA.tcga.compatible in tcga (probe A_23_P100800) Y: GJA1 exprs in tcga (probe A_24_P55287)
● ● ● ● ● ● ● ● ● ● ● ● ● ● ● ● ● ● ● ● ● ● ● ● ● ● ● ● ● ● ● ● ● ● ● ● ●● ● ● ● ● ● ● ● ● ● ● ● ● ● ● ● ● ● ● ● ● ●
(Subtype Pooled patient for which pam50.genefu contain Pooled , n = 373 )
ERα_pS118 protein (RPPA)
n = 373 −4 −2 0 2 4 −2 0 2 4 6 ER−alpha RPPA.tcga.compatible GJ A1 (A_24_P55287)
X: ER−alpha RPPA.tcga.compatible in tcga (probe A_23_P100791) Y: GJA1 exprs in tcga (probe A_24_P55287)
● ● ● ● ● ● ● ● ● ● ● ● ● ● ● ● ● ● ● ● ● ● ● ● ● ● ● ● ● ● ● ● ● ● ● ● ●● ● ● ● ● ● ● ● ● ● ● ● ● ● ● ● ● ● ● ● ● ●
(Subtype Pooled patient for which pam50.genefu contain Pooled , n = 373 ) n = 373
ERα protein (RPPA)
d
GJA1
mNRA (log2 ratio)
Protein level (RPPA)
ER-alpha ER-alpha pS118 PR Her2
Pearson's r 0.3725 Pooled CI (95%) 0.1502 LumA Pearson's r −0.0838 LumB CI (95%) 0.3442 Basal Pearson's r 0.0302 Her2 CI (95%) 0.2019 Breast (0.3045−0.4376) (−0.0041−0.2987) (−0.2447−0.082) (0.1582−0.5075) (−0.1988−0.2522) (−0.2155−0.5819) 0.4989 0.3939 0.2502 0.278 0.4018 0.1905 (0.4294−0.5643) (0.2574−0.5189) (0.0567−0.4287) (0.1093−0.4343) (0.1365−0.616) (−0.0868−0.4372) −0.0559 −0.2311 0.0956 −0.1028 −0.029 −0.0479 (−0.1237−0.0135) (−0.3546−−0.0981) (−0.0881−0.2672) (−0.3081−0.0917) (−0.2353−0.1789) (−0.3196−0.1975) ESR1 PGR ERBB2 −6 −4 −2 0 2 4 6 −2 0 2 4 6 ESR1 (NM_000125_1_6275) GJ A1 (A_24_P55287)
X: ESR1 exprs in tcga (probe NM_000125_1_6275) Y: GJA1 exprs in tcga (probe A_24_P55287)
● ● ● ● ● ● ● ● ● ● ● ● ● ● ● ● ● ● ● ● ● ● ● ● ● ● ● ● ● ● ● ● ● ● ● ● ● ● ● ● ● ● ● ● ● ● ● ●● ● ● ● ● ● ● ● ● ● ● ● ● ● ● ● ● ● ● ● ● ● ● ● ●
(Subtype Pooled patient for which pam50.genefu contain Pooled , n = 550 ) n = 488 −6 −4 −2 0 2 4 6 −2 0 2 4 6 PGR (A_32_P49197) GJ A1 (A_24_P55287)
X: PGR exprs in tcga (probe A_32_P49197) Y: GJA1 exprs in tcga (probe A_24_P55287)
● ● ● ● ● ● ● ● ● ● ● ● ● ● ● ● ● ● ● ● ● ● ● ● ● ● ● ● ● ● ● ● ● ● ● ● ● ● ● ● ● ● ● ● ● ● ● ● ● ● ● ● ● ● ● ● ● ● ● ● ● ● ● ● ● ● ● ● ● ● ● ● ●
(Subtype Pooled patient for which pam50.genefu contain Pooled , n = 550 ) n = 488 −2 0 2 4 6 8 −2 0 2 4 6 ERBB2 (A_23_P89250) GJ A1 (A_24_P55287)
X: ERBB2 exprs in tcga (probe A_23_P89250) Y: GJA1 exprs in tcga (probe A_24_P55287)
● ● ● ● ● ● ● ● ● ● ● ● ● ● ● ● ●● ● ● ● ● ● ● ● ● ● ● ● ● ● ● ● ● ● ● ● ● ● ● ● ● ● ● ● ● ● ● ● ● ● ● ● ● ● ● ● ● ● ● ● ● ● ● ● ● ● ● ● ● ● ● ●
(Subtype Pooled patient for which pam50.genefu contain Pooled , n = 550 ) n = 488 ESR1 PGR ERBB2 Negative Positive −2 0 2 4 6
GJA1 mRNA expression level in hucOrig tcga
er_status_by_ihc GJ A1 mRNA e xpression ● ● ● ● ● ● ● ● ● ● ● ● ● ● ● ● ● ● ● ● ● ● ● ● ● ● ● ● ● ● ● ●● ● ● ● ● ● ● ● ●● ● ● ● ● ● ● ● ● ● ● ● ● ● ● ● ● ● ● ● ● ● ● ● ● ● ● ● ● ● er_status_by_ihc, n = 520) ER- ER+ *** n = 520 Negative Positive −2 0 2 4 6
GJA1 mRNA expression level in hucOrig tcga
pr_status_by_ihc GJ A1 mRNA e xpression ● ● ●● ● ● ●● ● ● ● ● ●● ● ● ● ● ● ● ● ● ● ● ● ● ●● ●● ● ● ●● ● ● ● ● ● ● ● ● ● ● ● ● ● ● ● ● ●●● ● ● ● ● ● ● ● ● ● ● ● ●● ●● ● ● ● ● ● pr_status_by_ihc, n = 520) *** PR- PR+ n = 520 Negative Positive −2 0 2 4 6
GJA1 mRNA expression level in hucOrig tcga
her2_status_by_ihc GJ A1 mRNA e xpression ● ● ● ● ● ● ● ● ● ● ● ● ● ● ● ● ● ● ●●● ● ● ● ● ●● ● ● ● ●● ● ● ● ● ● ● ● ● ● ● ● ● ● ● ● ● ● ●● ● ● ● ● ● ● ● ● ● ● her2_status_by_ihc, n = 520) Her2- Her2+ n = 520 NS Receptor status Breast LumA LumB Basal Her2e c b a GJA1
mNRA (log2 ratio)
mNRA (log2 ratio)
Figure 4.Depending on the receptor status, GJA1 is associated with different mRNA levels in clinical
samples. (a) Expression of GJA1 mRNA stratified by estrogen receptor alpha (ERα), progesterone receptor (PR) and erb-b2 receptor tyrosine kinase 2 (ERBB2/Her2) status in the TCGA dataset. p value: * <0.05; ** <0.01; *** <0.001; NS Not statistically significant. (b) Plot of GJA1 vs. ESR1, PGR and ERBB2 mRNA (microarray) level in each subtype and in normal breast tissue. In the legend, “Breast” indicates adjacent normal breast tissue. (c) Bootstrapped correlations between ESR1, PGR or ERBB2 and GJA1 mRNA level either in pooled breast cancer tumors or in individual breast cancer intrinsic subtypes and in normal breast tissue. (d) Plot of GJA1 mRNA vs. ER-alpha, ER-alpha pS118, PR or HER2 protein level assessed by reverse phase protein assay (RPPA). (e) Bootstrapped correlations between GJA1 mRNA and ER-alpha, ER-alpha pS118, PR or HER2 protein level (RPPA). All data are from TCGA’s BRCA dataset.
Stronger correlations between PGR mRNA and protein levels and GJA1 mRNA levels were observed, not only in unstratified (pooled) analysis, but also in individual subtypes within most
datasets (Figures4b–e andA1b,c). This association was stronger in cancer samples than in normal breast tissues in all datasets for which normal tissues were available. Similar to ERα, total PR protein was well correlated with PGR mRNA (Pearson’ rho = 0.8593 and Spearman’s rho = 0.8723).
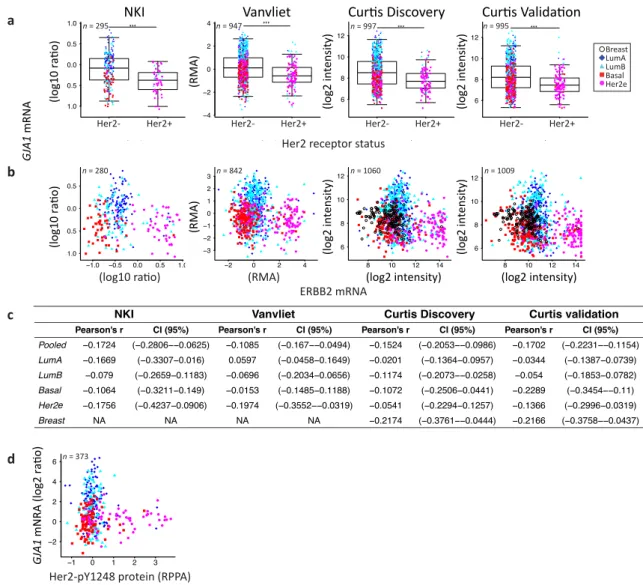
Tumors positive for the HER2 receptor by histochemistry (TCGA dataset) did not express significantly different levels of Cx43 mRNA. However, when HER2 status was given by HER2 amplicon probes or HER2 mRNA expression (Vanvliet, NKI and Curtis datasets), HER2+ tumors had a significantly lower level of GJA1. No direct correlation was observed between GJA1 and the HER2
(ERBB2) mRNA (Figures4a–e andA4a–d). A good correlation was observed between HER2 mRNA
and total HER2 protein level (Pearson’s rho = 0.8344, Spearman’s rho 0.68634). The correlation between HER2 protein (HER2 and HER2_pY1248 activated form) and GJA1 mRNA was not stronger than that
observed for HER2 mRNA (Figures4b–e andA3d).
Together, the significant differences observed in GJA1 mRNA level in individual subtypes and with receptor status suggest that GJA1 level is dependent on the molecular context provided by such subtypes. In addition, GJA1 does not vary directly with ESR1 and HER2 mRNA and protein levels but shows a stronger correlation with PGR mRNA and PR protein in tumor samples.
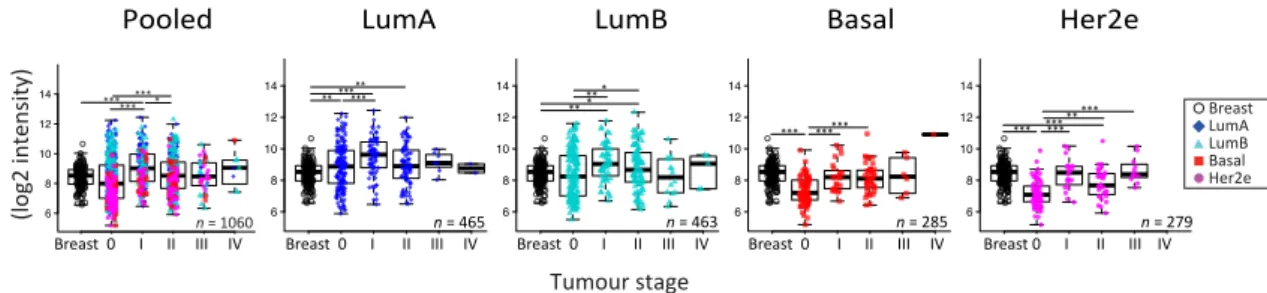
2.5. GJA1 mRNA Is Dysregulated at the Early Stages of Breast Cancer and Is Reduced with Grade When Tumors Are Pooled
To reconcile evidence supporting both tumor-suppressive and -promoting roles, it has been
suggested that Cx43 function could depend on tissue type or evolve with tumor stage [11]. We therefore
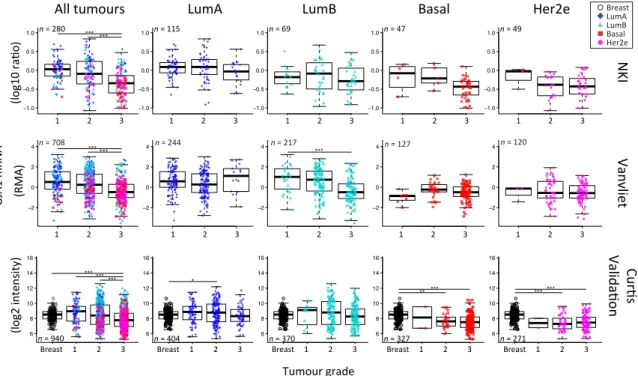
investigated whether GJA1 expression in primary breast tumor changed with stage and grade at the mRNA level in breast cancer. Since grade/stage are strongly associated with subtype, we first stratified our cohorts by intrinsic subtype. We used the Curtis dataset, as GJA1 expression was available for invasive tumors (stages 0 to IV) and “normal” adjacent tissue for numerous samples. A significant dysregulation of GJA1 expression occurred at the early stages in all breast cancer subtypes, although
both over-expression and downregulation could be observed (Figures5andA5). Most of the GJA1
over-expressing luminal tumors were found to be of low stage (0–II). However, a reduction was
observed in early stage basal-like and Her2e tumors (Figures5andA5). A significant increase in GJA1
was also observed in the invasive stage I compared with stage 0 in all subtypes (Figure5).
Normal 0 1 2 3 4 6 8 10 12 14
curtis.discovery, Pooled, GJA1, ILMN_1727087, n=, 1060
Stage *** *** **** n = 1060 Normal 0 1 2 3 4 6 8 10 12 14
curtis.discovery, LumA, GJA1, ILMN_1727087, n=, 465
Stage n = 465 ********** Normal 0 1 2 3 4 6 8 10 12 14
curtis.discovery, LumB, GJA1, ILMN_1727087, n=, 463
Stage ** *** * n = 463 Normal 0 1 2 3 4 6 8 10 12 14
curtis.discovery, Basal, GJA1, ILMN_1727087, n=, 285
Stage *** ****** n = 285 Normal 0 1 2 3 4 6 8 10 12 14
curtis.discovery, Her2, GJA1, ILMN_1727087, n=, 279
Stage *** *** ***** *** n = 279 GJA1 mRNA (log2 intensity) Tumour stage LumA
Pooled LumB Basal Her2e
Breast 0 I II III IV Breast 0 I II III IV Breast 0 I II III IV Breast 0 I II III IV Breast 0 I II III IV
Breast LumA LumB Basal Her2e
Figure 5. GJA1mRNA level is dysregulated in clinical samples at the early stages of breast cancer.
GJA1 mRNA level for each tumor stage and for normal breast in the Curtis Discovery dataset, either in pooled breast tumors or stratified by intrinsic subtype. In the legend, “Breast” indicates adjacent normal breast tissue. p value: * <0.05; ** <0.01; *** <0.001.
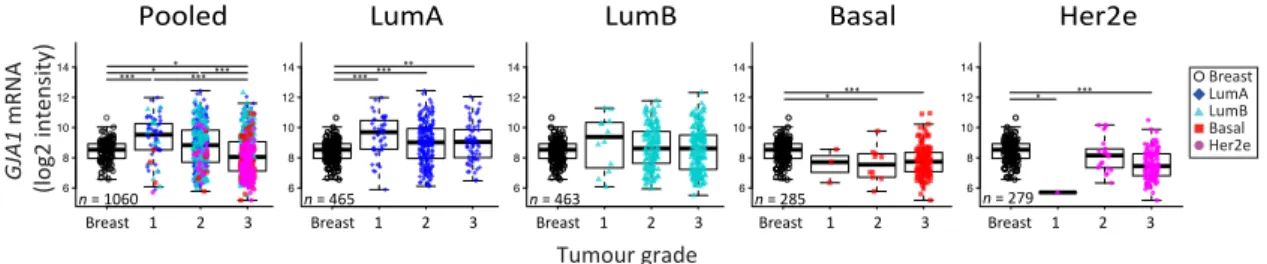
We then investigated whether or not the expression of GJA1 could be linked to tumors’ grade. Our analysis revealed that GJA1 mRNA expression was significantly decreased with grade when
all tumors were pooled, but not when they were stratified by intrinsic subtype (Figures6andA6).
A significant decrease in GJA1 with grades in LumB tumors could be observed only in the Vanvliet’s
Normal 1 2 3 6 8 10 12 14
curtis.discovery, Pooled, GJA1, ILMN_1727087, n=, 1060
Grade *** * ******* n = 1060 Normal 1 2 3 6 8 10 12 14
curtis.discovery, LumA, GJA1, ILMN_1727087, n=, 465
Grade n = 465 *** *** ** Normal 1 2 3 6 8 10 12 14
curtis.discovery, LumB, GJA1, ILMN_1727087, n=, 463
Grade n = 463 Normal 1 2 3 6 8 10 12 14
curtis.discovery, Basal, GJA1, ILMN_1727087, n=, 285
Grade n = 285 * *** Normal 1 2 3 6 8 10 12 14
curtis.discovery, Her2, GJA1, ILMN_1727087, n=, 279
Grade n = 279 * *** Tumour grade GJA1 mRNA (log2 intensity) Breast LumA LumB Basal Her2e LumA
Pooled LumB Basal Her2e
Breast 1 2 3 Breast 1 2 3 Breast 1 2 3 Breast 1 2 3 Breast 1 2 3
Figure 6. GJA1mRNA level is downregulated with grade in clinical samples only in pooled tumors
but not in individual subtypes. GJA1 mRNA level for each tumor grade in the Curtis Discovery dataset, either in pooled breast tumors or stratified by intrinsic subtype. In the legend, “Breast” indicates adjacent normal breast tissue. p value: * <0.05; ** <0.01; *** <0.001.
Interestingly, basal and Her2e tumors, which express a low level of GJA1 (Figure2), account for
an important proportion of grade 3 tumors, thus reducing the mean GJA1 expression for this grade
(Figure6). Moreover, grade 1 tumors are mostly luminal A and B, with a subset of GJA1 over-expressing
tumors, introducing an upward bias in this grade. Grade 2 tumors consist of a more balanced mix of
all the subtypes (Figures2and6). These results suggest that an observed reduction in GJA1 with grade
in pooled tumors is likely a bias induced by the pooling of the tumors’ subtypes. 2.6. In Her2e Breast Tumors, a Low Expression of GJA1 Is Associated with a Better Prognosis
To gain further insight into the role of Cx43 in breast cancer, we analyzed how the level of GJA1 mRNA expression in each subtype was associated with outcome. Observations that Cx43
expression was associated with a worse prognostic in ER-negative [33] and Her2e [34] tumors have
been previously reported using the web-based platform KMPlotter [35] while ER-positive tumors had
a better prognosis [33]. Investigating further the results of BreastMark and KMPlotter Web platforms,
survival analysis showed that pooled and luminal tumors with high levels of GJA1 mRNA were associated with a better prognostic (hazard ratio < 1), although results were not always statistically
significant (Figures7andA7a,b). Conversely, basal-like and Her2e tumors followed an opposite trend
(hazard ratio > 1), with high expression of GJA1 strongly associated with a worse prognosis in the
Her2e subtype (Figures7andA7a,b).
0 50 100 150 200 250 300 0.0 0.2 0.4 0.6 0.8 1.0
Kaplan−Meier estimate with 95% confidence bounds Subtype: Her2 tcga_nki_vanvliet_curtis.discovery_curtis.validation (n = 499)
(nEvents = 196), Threshold =18 Time (months) ?? Sur viv al High GJA1 Low GJA1 Threshold: 18 p value: 8.925e−04 HR: 2.0735 n 415 High events 84 Low 17224 0 50 100 150 200 250 300 0.0 0.2 0.4 0.6 0.8 1.0
Kaplan−Meier estimate with 95% confidence bounds Subtype: Basal tcga_nki_vanvliet_curtis.discovery_curtis.validation (n = 622)
(nEvents = 183), Threshold =13 Time (months) ?? Sur viv al High GJA1 Low GJA1 Threshold: 13 p value: 1.36e−01 HR: 1.4958 n 549 High events 74 Low 16617 0 50 100 150 200 250 300 0.0 0.2 0.4 0.6 0.8 1.0
Kaplan−Meier estimate with 95% confidence bounds Subtype: LumB tcga_nki_vanvliet_curtis.discovery_curtis.validation (n = 965)
(nEvents = 292), Threshold =68 Time (months) ?? Sur viv al High GJA1 Low GJA1 Threshold: 68 p value: 2.069e−04 HR: 0.6394 n 315 High events 650 Low 21973 0 50 100 150 200 250 300 0.0 0.2 0.4 0.6 0.8 1.0
Kaplan−Meier estimate with 95% confidence bounds Subtype: LumA tcga_nki_vanvliet_curtis.discovery_curtis.validation (n = 1138)
(nEvents = 161), Threshold =35 Time (months) ?? Sur viv al High GJA1 Low GJA1 Threshold: 35 p value: 9.469e−06 HR: 0.5154 n 748 High events 390 Low 8378 0 50 100 150 200 250 300 0.0 0.2 0.4 0.6 0.8 1.0
Kaplan−Meier estimate with 95% confidence bounds Subtype: Pooled tcga_nki_vanvliet_curtis.discovery_curtis.validation (n = 3224)
(nEvents = 832), Threshold =53 Time (months) ?? Sur viv al High GJA1 Low GJA1 Threshold: 53 p value: 1.645e−13 HR: 0.6075 n 1522 High events 1703 Low 305 527 Time (months)
LumA LumB Basal Her2e
Pooled
Survival
Figure 7. GJA1 is associated with a diverging outcome depending on breast cancer subtype.
The Kaplan–Meyer plots show survival curves for patients with breast tumors expressing either high (blue) or low (red) levels of GJA1 mRNA in pooled tumors or in individual intrinsic subtypes. TCGA, NKI, Vanvliet and both Curtis datasets were aggregated for the analysis. The best cutoff was
determined as the percentile lending the lowest log rank test p value (FigureA12) and was 53 in Pooled
tumors, 35 in luminal A (LumA) tumors, 68 in luminal B (LumB), 13 in Basal and 18 in Her2e tumors.
Since the aggregation of several datasets in BreastMark and KMPlotter platforms could lead to artifacts in survival analysis, we went further by performing our own survival analysis for each subtypes
of the best cutoff either by the receiver operating characteristic (ROC) curve (FigureA8a–c) or by the
smallest p value of the log rank test for different thresholds (10–90) (FigureA10).
ROC curves have shown that the highest area Under the curve (AUC) for GJA1 was obtained when
tumors were pooled (FigureA8a) and GJA1 was then ranked, at worst, in the eleven first percentiles
when compared to all the probes present in the five datasets (FigureA8c). The log rank test was highly
significant for all the analyses (Figures7,A9andA12) and for a vast range of cutoffs (FigureA10c),
suggesting that GJA1 has the greatest discriminating power when cohorts are unstratified. This is in line with a differential expression of GJA1 in luminal vs. basal and Her2e tumors that also have
diverging prognostics (Figure2a).
When analyzing individual subtypes, a high expression was also significantly associated with a better
prognosis in all analyses for LumA and for most analyses for LumB tumors (Figures7,A9andA12).
However, survival curves in most analyses as well as the hazard ratio for a wide range of cutoffs
(FigureA11) showed that this tendency is reversed in Basal and Her2e tumors where GJA1 is mostly
associated with a worse prognosis. This result was most significant in Her2e tumors, especially with smaller cutoffs while significance was rarely reached for Basal tumors.
However, GJA1 ROC curves showed that GJA1 did not consistently identify bad prognosis tumors
with a high specificity and sensitivity (FigureA8a). These results suggest that although stratifying
tumors revealed that the role of GJA1 possibly differs in different breast cancer subtypes, GJA1 should not be used as a clinical marker. These results also highlight once again how analyses using pooled tumor subtypes might induce biases and hide diverging results that are subtype-specific.
3. Discussion
Traditionally, Cx43 was considered as a tumor suppressor in the breast, with many studies reporting decreased Cx43 expression in tumor compared to normal breast tissue via both in vivo and in vitro studies [3,12,13,18–21]. However, other studies contradict these findings [8,22–25]. This recent evidence has cast doubt on Cxs tumor’s suppressive role, suggesting that the Cxs function in cancer
was tissue- and tumor stage-dependent [11,17]. At least four different subtypes of breast cancer
have been identified, each having unique molecular profiles, responses to treatment and prognostics. Our evidence suggests that the role of Cx43 is dependent on subtype.
3.1. Cx43 Expression Is Dysregulated in Breast Cancer
Early studies first showed a dramatic downregulation of GJA1 at the mRNA and the protein level
in breast cancer cell lines as well as in rat and human breast tumors [12,13]. Conversely, other studies
showed an increase in a subset of tumors [15]. Most of these studies analyzed a limited number of
samples and were conducted either prior to the intrinsic subtype classification of breast cancer or did not use such classification. Our results, with several large cohorts of breast cancer clinical samples, reconcile these contradictory data by demonstrating that the observed dysregulation can involve both he increased and decreased expression of the Cx43 protein and mRNA. These observations are
consistent with more recent reports at the protein level [15,16,25,36].
3.2. Dysregulation of Cx43 Is Linked to Hormonal Receptor Status and Tumor Subtype
Our results showed that the expression of Cx43 in breast tumors was lower in basal and Her2e than in normal tissues and that Cx43 levels vary greatly within luminal subtypes. This subtype-dependent expression was also shown by more recent studies, the result of which also support a higher expression
of Cx43 mRNA and protein in luminal tumors than in basal-like and Her2e subtypes [36,37]. Because
the intrinsic subtypes are characterized by, among others, hormonal receptor status, we wanted to evaluate whether a functional link could be captured in whole-tumor expression profiles between Cx43 and ERα, PR or HER2. Whole-tumor expression has been used by others, both to assess the content
of specific cell types in samples and to decipher functional links between genes [38,39]. Using this
luminal subtypes, which are largely ERα- and PR-positive. These results were not surprising as much
evidence supports a link between Cx43 and hormones in breast tissue [32] and in other tissues [40–43].
GJA1 is also expressed at lower levels when HER2 status is positive and within the Her2e breast cancer subtype, except in the TCGA dataset. In an early study, it was reported that Cx43 gap junctions were dramatically reduced in breast tumors, and that this reduction was considered to occur regardless
of ERα, PR or HER2 status [12]. More recent studies have reported that Cx43 protein expression
correlated positively with PR and ERα status [44,45] and negatively with HER2 protein expression [45].
However, Conklin et al. reported that no correlation was observed between Cx43 and HER2 protein in
tissue microarrays [44].
Our results suggest a direct relationship between GJA1 and PR expression in breast cancer samples. Our analysis shows that GJA1 level correlates with PR mRNA and protein in several subtypes. These results suggest that either PR or GJA1 levels are dependent on the relative amount of some cell types co-expressing both genes, or that a functional link exists in the regulation of these genes in the same cell type or via paracrine signaling. Accumulating evidence has shown that ERα and PR are expressed in cell populations that do not totally overlap. GJA1 is usually associated with basal cells
while PR is thought to be expressed mainly in hormone-responsive luminal cell [1]. However, PR has
been detected in some human breast basal cells, especially within immature lobules [1], suggesting
an expression in primitive basal progenitor cells. PR has been suggested to coordinate basal cell
proliferation, either via paracrine or autocrine stimulation [1]. It was also reported that the unliganded
progesterone receptor isoform A (PRA) could activate Cx43 transcription by interacting with AP-1
heterodimers composed of FRA2 and JUND [42]. More studies are needed to better understand Cx43
localization and regulation, as well as its potential link with hormones. This knowledge is essential to further understand mammary gland morphogenesis and how Cx43 and hormones are involved in breast cancer.
Several other questions remain unanswered regarding the link between GJA1 and ERα, PR and HER2. While the receptor’s protein and mRNA levels were well correlated in our study, their functional status in the samples is unknown. Protein expression data for some phosphorylated forms of ER (ERα_pS118) and HER2 (HER2_pY1248) receptor were available. Beyond single phosphorylation, the activation of these receptors is mostly dependent on complex post-transcriptional processing which affects receptors’ specific functions and gene transcription. As a result, prognostic significance of ERα
has been shown to be phosphorylation site-specific [46]. Therefore, it cannot be excluded that GJA1
mRNA expression can be regulated by ERα or HER2 and that these links could not be captured by expression profiles from breast cancer samples. Regardless of the precise nature of the link between GJA1 and hormone receptors, our results suggest that GJA1 level is dependent on the overall molecular context provided by each breast cancer subtype and that this might relate to PGR level, at least in some subtypes.
3.3. Upregulation of Cx43 mRNA Is Not Driven by DNA Amplification in Breast Cancer
Somatic DNA-level chromosomal aberrations are a defining characteristic of cancer and are common in breast carcinoma. Genomic loss and amplification cause decreases and increases in the transcription of genes in the region and often with concomitant effects of protein expression. We found that GJA1 is rarely the target of such somatic events, and when it occurred it was often in Her2e and basal subtypes, consistent with the observation that these two subtypes generally have an increased amount of genomic instability in comparison to the luminal subtypes. Our results are also in accordance with previous studies that have shown that the region of human chromosome 6
where GJA1 is located (6q22.31) has a relatively low level of amplification and deletions [47]. Cx43 was
rarely mutated in breast cancer samples. Together, these results suggest that GJA1 dysregulation at the mRNA and protein levels involves a dysregulation of other factors impacting the transcription (epigenetics, transcription factors) or mRNA stability.
3.4. Cx43 mRNA Level Is Dysregulated at the Early Stages of Breast Cancer
It was previously reported that, in primary tumors, Cx43 protein expression correlated with
clinical stages [45]. Our analysis of microarray data from large cohorts of primary tumors suggested
that Cx43 is decreased in a subset of tumors during early carcinogenesis (stage 0) and is re-expressed at higher levels in stage I tumors. While stage 0 of the luminal subtypes showed an increased variance of expression, those of basal-like and Her2e tumors had a significantly reduced expression compared to normal tissues. However, we could not observe a robust mRNA reduction, or increase, in later stages compared either to early tumor stages or to normal tissues.
A previous study investigated immunohistochemistry for Cx43 protein expression in ductal carcinoma in situ (DCIS), DCIS with microinvasion, DCIS with invasive ductal carcinoma (IDC) and IDC alone. In pooled tumors as well as in most subtypes, the lowest expression of Cx43 protein occurred neither in DCIS nor IDC alone but precisely in DCIS with microinvasion where only three out
of thirty-seven cases (8%) were positive [36]. On the other side, out of 193 invasive lesions, sixty-three
(33%) expressed Cx43. When looking specifically at the Her2e subtype, Cx43 was not expressed in a lower number of DCIS with microinvasion as in other subtypes since Cx43 was rarely expressed. Cx43 was present in only one of twenty IDC samples while the remaining twenty-six samples of other groups (DCIS, DCIS with microinvasion and DCIS with IDC) were all negatives. Whether or not the stromal compartment was included in the analysis was not specified. These results are consistent with our observation that, in all subtypes, DCIS (typically stage 0) had a lower expression than invasive stage I tumors. Together, these result point to Cx43 dysregulation as an early event in tumorigenesis,
similar to what has been observed in the early stages of cervix, endometrial and thyroid cancers [48].
Moreover, it should be noted that while breast cancer stages are based on the size and the spreading of the disease in the tissue or to distant sites, the mRNA expression profiles we used only account for gene expression in whole primary tumors. Important morphologic information is therefore lost. During cancer progression, localized neoplastic cells acquire the capacity to invade surrounding tissues, and eventually reach the blood or lymphatic vasculature, allowing them to spread
to other organs [49]. Depending on the stage and their location within the tumor or the tissue, these
tumor cell populations face different challenges depending on the processes accomplished and on
the microenvironment surrounding them [49]. Microarray data do not make it possible to either
finely assess the expression of specific cells according to their specific localization in the tumor or to distinguish tumor gene expression from the stroma. A comprehensive study of events occurring early in carcinogenesis and accounting for the geographical localization within the tumors at primary or distant sites, and for the different cell populations in a subtype-dependent manner, is therefore the next logical step in further understanding Cx43’s role in tumor progression.
3.5. The Apparent Grade-Dependent Decrease in Cx43 Is Linked to Its Low Expression in More Aggressive Subtypes
Tumor grade is a measure of the degree of abnormality of tumor cells and of dedifferentiation of cancer tissues compared to normal breast tissue. Our results showed that, when all tumors are pooled, the GJA1 mRNA level seems to increase in grade 1 tumors compared to normal tissues and gradually decrease with increasing grade. However, stratifying the tumors by subtype showed that within an intrinsic subtype, the distribution of the tumors within each grade varies considerably. Indeed, luminal A and B tumors are more frequently of grade 1 or 2 and some of them over-express GJA1
(Figure2), while most basal and Her2e tumors, that express a low level of Cx43, are mostly of grade 3.
As a result, GJA1 mRNA is not lost with grade in individual subtypes. These results suggest that the observed correlation in pooled tumors is, in fact, a bias attributable to the pooling of the tumors, and reflects the high grade of basal and Her2e tumors. These results also highlight how pooling the different intrinsic subtypes, expressing varying degrees of GJA1, can introduce important biases in cohort analysis and will likely yield different results depending on the composition, in terms of the subtypes, of the cohorts studied.
3.6. High Expression of Cx43 Is Associated with a Good Prognostic in Luminal Subtypes, but with a Worse Prognostic in Her2e Tumors
Our results showed that, consistent with its ascribed role as a tumor suppressor in breast cancer, Cx43 was expressed at lower levels in more aggressive basal and Her2e subtypes than in luminal subtypes. Survival analysis of pooled tumors therefore showed a better survival of tumors highly expressing Cx43. However, as with grade, pooling breast cancer subtypes to analyze the effect of GJA1 on the outcome introduces biases. Tumors expressing low levels of GJA1 are overrepresented in aggressive basal and Her2e tumors, likely dragging down the survival of the group expressing a low level of GJA1. Therefore, performing survival analysis on pooled tumors, a good prognosis patient is automatically segregated into the curve of tumors highly expressing GJA1, and vice versa.
Paradoxically, the prognostic associated with Cx43 expression diverged depending on the intrinsic subtype, with a good prognosis in luminal tumors and an opposite trend in Her2e tumors. A previous study using immunohistochemistry found no correlation between Cx43 protein level
and patient outcome [44]. However, similar to our results, more recent studies using expression
array-based survival curves found that a high GJA1 expression was associated with a better prognosis in
ERα-positive breast cancer tumors, while an opposite trend was observed in ERα-negative tumors [33]
and Her2e tumors [34]. The worse prognosis associated with GJA1 in Her2e tumors suggests that GJA1
function in breast cancer might not just be tissue- and stage-dependent, as suggested by others [11,17],
but might also be subtype-dependent.
Cx43 has been reported to be expressed both in epithelial and stromal cells types. The molecular landscape provided by different cell types and/or by different breast cancer subtypes might provide different context, possibly allowing Cx43 to assume different functions and leading to different outcomes. It could be hypothesized that such context may provide different sets of interacting partners for GJA1, and its expression might even be driven by a different set of transcriptional or epigenetic regulators. In addition, an important determinant of the capacity of Cx43 to assume its channel function is unarguably its proper membrane localization. From array based mRNA expression data, it is until now impossible to assess neither the cellular localization nor the functional status of Cx43. It is very likely that these important and relevant information would contribute to a more complete understanding of the functions of Cx43 in breast cancer. For instance, a recent study demonstrated that over-expressing Cx43 in two different HER2-positive breast cancer cell lines lead to a diverging ability to proliferate, migrate, form mammospheres and form tumors in mice. Tumorigenic characteristics of the cancer cells were enhanced when functional gap junction channels could not be formed upon Cx43 over-expression, but were reduced when membrane gap junctions plaques allowed cells to
communicate [34]. These aspects of Cx43 biology might explain its different roles according to
subtypes but also possibly within subtypes and should therefore be addressed. Additional researches are required to better understand the context that allows Cx43 to suppress or promote carcinogenesis in different intrinsic subtypes.
4. Materials and Methods 4.1. Gene Expression
We used 4K samples over different expression platforms. Vanvliet used Affymetrix Human Genome
U133A (data processed with Robust Multi-Array Average (RMA)) [50]. Curtis discovery and Curtis
validation used the Illumina HT-12 v3 platform (expression given as a Log2 intensity level) [47]. The
Cancer Genome Atlas (TCGA) used a custom Agilent G4502A 244K array (expression given as Log2
Lowess normalized ratio) [51]. NKI used a Hu25K Agilent platform (samples were hybridized against
a pool of equal amount of RNA from each patient and gene expression is given as a log10 of intensity
ratio) [52]. Normalized signal per probe or probe set mRNA expression was downloaded for tumor
molecular subtyping algorithm using the R genefu package [29]. Survival for each case was determined as in [27].
ERα, PR and HER2 status provided in the original publication of the dataset was used. For TCGA, ER, PR and HER2 status was obtained by immunohistochemistry (IHC). For NKI, ER and PR status was determined by IHC and the sample was considered positive if at least 10% of the cells were positive. For Vanvliet, ER and PR status was determined with the Bioconductor package ROCR based on the expression of the probe 205225_at and validated with IHC when available. NKI and Vanvliet HER2 status was determined using the probes of the HER2 amplicon genes. For Curtis datasets, ER, PR and HER2 status was based on mRNA expression. In the TCGA dataset, the level of some proteins has been investigated with reverse phase protein assay (RPPA). Data were available for total ERα, PR and HER2 as well as for the phosphorylated forms of ERα (pS118) and HER2 (pY1248) that are at least
partially indicative of the activation status [46,53]. GJA1 protein level obtained by mass spectrometry
for 105 TCGA samples was retrieved from the protein report found at the Clinical Proteomic Tumor
Analysis Consortium (CPTAC) data portal [54]. Levels are given as the log2 of the ratio of each sample
with respect to a pooled reporter sample. 4.2. DNA Alteration
Copy number alterations (CNAs) were measured in the TCGA dataset with Affymetrix 6.0 single nucleotide polymorphism (SNP) arrays and segmented using Circular Binary Segmentation
(labeled here as Relative linear copy number values) [51]. Data were further processed by TCGA
using GISTIC 2.0 to assign the Putative copy number calls per gene (−2: Homozygous deletion,
−1: Hemizygous deletion, 0: Neutral/no change, 1: Gain, 2: High level amplification) [51]. Mutations
were detected using whole-exome sequencing after controlling for germline and normal adjacent tissue
mutations [51]. Linear and called CNA data as well as mutation data for the TCGA dataset were
retrieved using R via cBioportal [55,56]. A total of 977 patients had data for mutations [51].
4.3. Survival Analysis
Survival data was available for all five datasets. The log-rank test was used to estimate significance
and hazard ratios (95% CI) were computed via Cox regression using survival package [57]. ROC curves
were computed using the pROC package [58]. Kaplan–Meier plots were used to visualize the data.
The best cutoff to determine tumors expressing high or low levels of Cx43 was selected using either the ROC curves or based on the smallest p value of the log rank test computed for each threshold between 10 and 90. For aggregated datasets analysis, each cohort was first split into groups based on the selected threshold and datasets were pooled only after splitting.
In addition, survival analyses were computed using the BreastMark and KMPlotter web platforms
that use several well-known dataset [35,59]. BreastMark allows thresholds of 25, 50 and 75 percentile to
be selected to split the different cohorts used before aggregating them. For each analysis, we selected the threshold giving the best results. Since less samples were available in KMPlotter for statistical computation, we only included analyses for which there were at least 100 samples to draw both high and low expression curves for each subtype.
4.4. Statistical Analysis
All statistical analyses were carried out with R version 3.4.3 [60]. For two class comparisons,
(cancer vs. normal tissues; positive vs. negative hormonal status) the Wilcoxon-Mann-Witney test was used. When more than two classes were compared, the Kruskall-Wallis test was used followed by the Dunn post-hoc test to assess the statistical significance for each pair of samples (to compare
subtypes). For stages and grades, differential gene expression was assessed using Limma package [61].
A Benjamini-Hochberg correction was applied to adjust the p values for multiple testing. Because each subtype had a different number of patients, when correlation tests were performed between the
expression of GJA1 and the expression of other genes, a non-parametric bootstrap procedure was used for each subtype to derive the mean correlation coefficient and a percent confidence interval.
5. Conclusions
Our study has clarified the expression pattern of GJA1 mRNA in breast cancer and showed that GJA1 expression, as well as its prognostic significance, is dependent on breast cancer subtype. We also highlighted important biases that are introduced in analyzing pooled tumors. These biases need to be taken into consideration when studying GJA1, but also numerous other genes that are known to be linked, for instance, to ERα expression. Breast cancers are heterogeneous and genetically diverse and the lack of recognition of this molecular heterogeneity might explain the conflicting results from the literature, not only for GJA1, but potentially for other tumor suppressors or oncogenes. Overall, these results clearly showed that the molecular context where Cx43 is expressed in general, and the tumor subtypes of breast cancer in particular, should be taken into account when investigating Cx43’s role in carcinogenesis.
Acknowledgments: We gratefully acknowledge financial support: MB was supported by Alexander Graham
Bell Canada Graduate Scholarships-Doctoral and Master’s Programs from the Natural Sciences and Engineering Research Council of Canada (NSERC), by the Fonds de Recherche du Québec—Nature et Technologies (FRQNT) and by the Fonds de Recherche du Québec-Santé (FRQS). IP is funded by the Quebec Breast Cancer Foundation, by the FRQS and the NSERC. MTH is funded by NSERC and the Canadian Institutes of Health Research (CIHR).
Author Contributions: Mélanie Busby, Isabelle Plante and Michael T. Hallett conceived and designed the
experiments. Michael T. Hallett provided the access to breast cancer datasets. Mélanie Busby performed the experiments, analyzed the data and wrote the paper. Isabelle Plante and Michael T. Hallett helped draft the manuscript. All authors read and approved the final manuscript.
Conflicts of Interest:The authors declare no conflict of interest.
Abbreviations
CNA Copy number alterations
Cx43 Connexin 43
DCIS Ductal carcinoma in situ
ERα Estrogen receptor alpha
ERBB2 erb-b2 receptor tyrosine kinase 2
GJIC Gap Junction Intercellular Communication
GJA1 Gap Junction protein alpha 1, the gene encoding Connexin 43
Her2e HER2-enriched
IDC Invasive ductal carcinoma
LumA Luminal A
LumB Luminal B
PR Progesterone Receptor
RPPA Reverse phase protein assay
Appendix A
Supplementary Fig. S1.
GJA1 mRNA level in breast cancer clinical samples is dependent on breast cancer subtype in four datasets.
GJA1 mRNA level in tumors stratified by subtype in Vanvliet, NKI, Curtis Discovery and Curtis Validation datasets. p value : * < 0.05; ** < 0.01; *** < 0.001.
LumA LumB Basal Her2 −2
0 2 4
GJA1 mRNA vs Subtype in vanvliet
Subtype GJ A1 mRNA n = 842 , Kruskal = 0 n = 842 * *** ****** *** (RMA)
LumA LumB Basal Her2 −1.0
−0.5 0.0 0.5 1.0
GJA1 mRNA vs Subtype in nki
Subtype GJ A1 mRNA n = 280 , Kruskal = 0 n = 280 ****** ***** *** (log10 ratio)
Breast LumA LumB Basal Her2 6
8 10 12 14
GJA1 mRNA vs Subtype in curtis.discovery
Subtype GJ A1 mRNA n = 1060 , Kruskal = 0 n = 1060 *** *** *** *** *** *** *** *** (log2 intensity)
Breast LumA LumB Basal Her2 6
8 10 12 14
GJA1 mRNA vs Subtype in curtis.validation
Subtype GJ A1 mRNA n = 1009 , Kruskal = 0 n = 1009 *** *** *** *** *** *** (log2 intensity)
NKI Vanvliet Curtis Discovery Curtis Validation
Intrinsic subtype
Normal LumA LumB Basal Her2e Breast
LumA LumB Basal Her2e
LumA LumB Basal Her2e Normal LumA LumB Basal Her2e
Breast GJA1 mRNA Breast LumA LumB Basal Her2e
Figure A1. GJA1mRNA level in breast cancer clinical samples is dependent on breast cancer subtype
in four datasets. GJA1 mRNA level in tumors stratified by subtype in Vanvliet, NKI, Curtis Discovery and Curtis Validation datasets. In the legend, “Breast” indicates adjacent normal breast tissue. p value: * <0.05; ** <0.01; *** <0.001.
Supplementary Fig. S2.
GJA1 mRNA level in breast cancer clinical samples is higher in ER positive tumors in four datasets.
A, GJA1 mRNA level in breast tumors stratified by estrogen receptor status determined as described in Material and Methods. p value: * < 0.05; ** < 0.01; *** < 0.001; B, Expression of
GJA1 vs estrogen receptor alpha (ESR1) mRNA in each subtype and in normal breast tissue; C, Bootsrtapped correlations between ESR1 and GJA1 mRNA level either in pooled BC tumors or in individual BC molecular subtypes and in normal breast tissue; Data from Vanvliet, NKI, Curtis Discovery and Curtis Validation dataset.
Pearson's r 0.2544 Pooled CI (95%) −0.0729 LumA −0.1146 LumB 0.1289 Basal −0.0957 Her2 (0.1983−0.309) (−0.1761−0.0289) (−0.2439−0.0152) (−0.0149−0.2713) (−0.2536−0.0673) Pearson's r 0.2773 Pooled CI (95%) −0.0285 LumA 0.0521 LumB 0.1994 Basal −0.1447 Her2 (0.2226−0.3312) (−0.1436−0.0869) (−0.0539−0.157) (−6e−04−0.3839) (−0.3035−0.0167) Pearson's r 0.4617 Pooled CI (95%) 0.3413 LumA 0.1898 LumB 0.1051 Basal 0.2305 Her2 (0.3683−0.549) (0.1547−0.5081) (−0.0694−0.4234) (−0.2873−0.4635) (−0.0523−0.491) Pearson's r 0.1855 Pooled CI (95%) 0.0805 LumA 0.0013 LumB −0.0604 Basal −0.088 Her2 (0.1209−0.2491) (−0.0358−0.1945) (−0.1217−0.1246) (−0.1841−0.0625) (−0.2503−0.0807) Pearson's r 0.4619 Pooled CI (95%) 0.3413 LumA Pearson's r 0.1902 LumB CI (95%) 0.1058 Basal Pearson's r 0.2317 Her2 CI (95%) NA Breast Pearson's r (0.368−0.5492) CI (95%) (0.1561−0.5087) (−0.0686−0.4229) (−0.2855−0.4641) (−0.0513−0.4907) NA 0.1856 0.0801 0.001 −0.0606 −0.0882 NA (0.1204−0.2497) (−0.0362−0.1937) (−0.1207−0.1238) (−0.184−0.0601) (−0.25−0.0799) NA 0.2772 −0.0286 0.052 0.1986 −0.1445 0.0416 (0.2228−0.3311) (−0.1435−0.0862) (−0.0541−0.1565) (−0.001−0.3843) (−0.304−0.0172) (−0.1312−0.2091) 0.2543 −0.0728 −0.1149 0.1286 −0.0957 0.041 (0.1988−0.3089) (−0.1771−0.028) (−0.2431−0.0148) (−0.0156−0.271) (−0.2535−0.0668) (−0.132−0.2084)
NKI Vanvliet Curtis Discovery Curtis validation
c −1 0 1 2 3 −3 −2 −1 0 1 2 3 ESR1 (215552_s_at) GJ A1 (201667_at)
X: ESR1 exprs in vanvliet (probe 215552_s_at) Y: GJA1 exprs in vanvliet (probe 201667_at)
● ● ● ● ● ● ● ● ● ● ● ● ● ● ●● ● ● ● ● ● ● ● ● ● ● ● ● ● ● ● ● ● ● ● ● ● ● ● ● ● ● ● ●● ● ● ● ● ● ● ● ● ● ● ● ● ● ● ● ● ● ● ● ● ● ● ● ● ● ● ●● ● ● ● ● ● ● ● ● ● ● ● ● ● ● ●●● ● ● ● ● ● ● ● ● ● ● ● ● ● ● ● ● ● ● ● ● ● ● ● ● ● ● ● ● ● ● ● ● ● ● ● ● ● ● ● ● ● ● ● ●
(Subtype Pooled patient for which pam50.genefu contain Pooled , n = 842 ) n = 842 −1.5 −1.0 −0.5 0.0 0.5 −1.0 −0.5 0.0 0.5 ESR1 (NM_000125) GJ A1 (NM_000165)
X: ESR1 exprs in nki (probe NM_000125) Y: GJA1 exprs in nki (probe NM_000165)
● ● ● ● ● ● ● ● ● ● ● ● ● ● ● ● ● ● ● ● ● ● ● ● ● ● ● ● ● ● ● ● ● ● ● ● ● ● ● ● ● ● ● ● ● ● ● ● ●
(Subtype Pooled patient for which pam50.genefu contain Pooled , n = 280 ) n = 280 6 8 10 12 6 8 10 12 ESR1 (ILMN_1678535) GJ A1 (ILMN_1727087)
X: ESR1 exprs in curtis.discovery (probe ILMN_1678535) Y: GJA1 exprs in curtis.discovery (probe ILMN_1727087)
● ● ● ● ● ● ● ● ● ● ● ● ● ● ● ● ● ● ● ● ● ● ● ● ● ● ● ● ● ● ● ● ● ● ● ● ● ● ● ● ● ● ● ● ● ● ● ● ● ● ● ● ● ● ● ● ● ● ● ● ● ● ● ● ● ● ● ● ● ● ● ● ● ● ● ● ● ● ● ● ● ● ● ● ● ● ● ● ● ● ● ● ● ●● ● ● ● ● ● ● ● ● ● ● ● ● ● ● ● ● ● ● ● ● ● ● ● ● ● ● ● ● ● ● ● ● ● ● ● ● ● ● ● ●
(Subtype Pooled patient for which pam50.genefu contain Pooled , n = 1060 ) n = 1060 6 8 10 12 6 8 10 12 ESR1 (ILMN_1678535) GJ A1 (ILMN_1727087)
X: ESR1 exprs in curtis.validation (probe ILMN_1678535) Y: GJA1 exprs in curtis.validation (probe ILMN_1727087)
● ● ● ● ● ● ● ● ● ● ● ● ● ● ● ● ● ● ● ● ● ● ● ● ● ● ● ● ● ● ● ● ● ● ● ● ● ● ● ● ● ● ● ● ● ● ● ● ● ● ● ● ● ● ● ● ● ● ● ● ● ● ● ● ● ● ● ● ● ● ● ● ● ● ● ● ● ● ● ● ● ● ● ● ● ● ● ● ● ● ● ● ● ● ● ● ● ● ● ● ● ● ● ● ● ● ● ● ● ● ● ● ● ● ● ● ● ● ● ● ● ● ● ● ● ● ● ● ● ● ● ● ● ● ● ●
(Subtype Pooled patient for which pam50.genefu contain Pooled , n = 1009 ) n =1009 b Negative Positive −4 −2 0 2 4
GJA1 mRNA expression level in hucOrig vanvliet
ER GJ A1 mRNA e xpression ● ● ● ● ● ● ● ● ● ● ● ● ● ● ● ● ● ● ● ● ● ● ● ● ● ●● ● ● ● ● ● ● ● ● ● ●● ● ● ● ● ● ● ● ● ● ● ● ● ● ● ● ● ● ● ● ● ● ● ● ● ● ● ● ● ● ● ● ● ● ● ● ● ● ● ● ● ● ● ● ● ● ● ● ● ● ● ● ● ● ● ● ● ● ● ● ● ● ● ● ● ● ● ● ● ● ●● ● ●● ● ● ER, n = 781) *** ER- ER+ n = 781 1 2 −1.0 −0.5 0.0 0.5 1.0
GJA1 mRNA expression level in hucOrig nki
ERp GJ A1 mRNA e xpression ● ● ● ● ● ● ERp, n = 41) * ER- ER+ n = 41 Negative Positive 6 8 10 12
GJA1 mRNA expression level in hucOrig curtis.discovery
ER.Expr GJ A1 mRNA e xpression ● ● ● ● ●● ● ● ● ● ● ● ●●●● ● ● ●● ● ● ● ● ● ● ● ● ● ● ● ● ● ● ● ● ● ● ● ● ● ● ● ● ● ● ● ● ● ● ● ● ● ● ● ● ● ● ● ● ● ● ● ● ● ● ● ● ● ● ●● ● ● ● ● ● ● ● ● ● ● ● ● ● ● ● ● ● ● ● ● ● ● ● ● ● ● ●● ● ● ● ● ● ● ●● ● ● ● ● ● ● ● ● ● ●● ● ● ● ● ● ● ● ● ● ● ● ● ● ● ● ● ER.Expr, n = 997) *** ER- ER+ n = 997 Negative Positive 6 8 10 12
GJA1 mRNA expression level in hucOrig curtis.validation
ER.Expr GJ A1 mRNA e xpression ● ● ● ● ● ● ● ● ● ● ● ● ● ● ● ● ● ● ● ● ● ● ● ● ● ● ● ● ● ● ● ● ● ● ● ● ● ● ● ● ●● ● ● ● ●●● ● ● ● ●● ● ● ● ● ● ● ● ● ● ● ● ● ● ● ● ● ● ● ● ● ● ● ● ● ● ● ● ●● ● ● ● ● ● ● ● ● ● ● ● ● ● ● ● ● ● ● ● ● ● ● ● ● ● ● ● ● ● ● ● ● ● ● ● ● ● ● ● ●● ● ● ● ● ● ● ● ● ● ● ● ● ● ER.Expr, n = 995) *** ER- ER+ n = 995 a GJA1 mRNA
NKI Vanvliet Curtis Discovery Curtis Validation
ESR1 mRNA Estrogen receptor status
(log2 intensity) (log2 intensity) (log2 intensity) (log2 intensity) (RMA) (RMA) (log10 ratio) (log10 ratio)
(log10 ratio) (RMA) (log2 intensity) (log2 intensity)
Breast LumA LumB Basal Her2e e
Figure A2. GJA1mRNA level in breast cancer clinical samples is higher in ER-positive tumors in four
datasets. (a) GJA1 mRNA level in breast tumors stratified by estrogen receptor status determined as described in Material and Methods. p value: * <0.05; ** <0.01; *** <0.001. (b) Expression of GJA1 vs. estrogen receptor alpha (ESR1) mRNA in each subtype and in normal breast tissue. (c) Bootstrapped correlations between ESR1 and GJA1 mRNA level either in pooled breast cancer tumors or in individual intrinsic subtypes and in normal breast tissue. Data from Vanvliet, NKI, Curtis Discovery and Curtis Validation datasets.