1
Supplementary Figure
1
The symbiotic complex of Dendroctonus simplex: implications in the beetle attack and its life cycle
2Audrey-Anne Durand, Philippe Constant, Eric Déziel and Claude Guertin
3 4 5 6 7 8 9 10 11 12 13 14 15 16
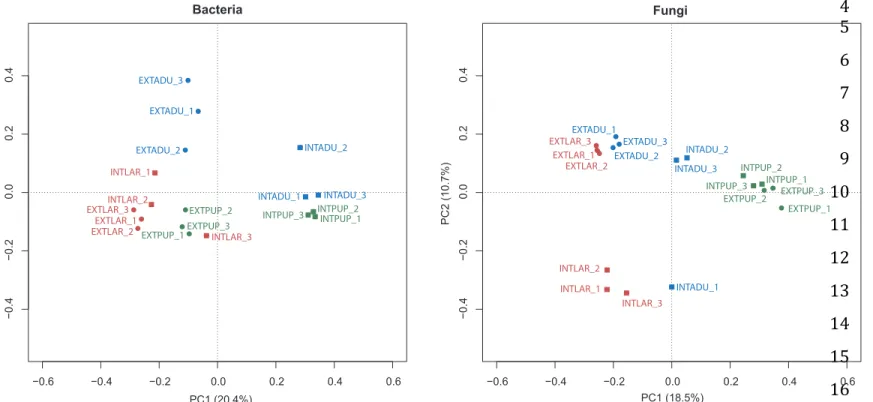
Figure S1. Principal component analysis of the different developmental stages and microenvironments of D. simplex for bacterial and fungal
17
microbiota. All generated OTU and equalized dataset has been used to generate the PCA. Numbers in parenthesis represent the percentage
18
explained by each axes. ECTO = ectomicrobiota, ENDO = endomicrobiota, ADU = adults, LAR = Larvae, PUP = Pupae. 19 −0.6 −0.4 −0.2 0.0 0.2 0.4 0.6 −0.4 −0.2 0.0 0.2 0.4 Bacteria PC1 (20.4%) PC2 (7.8%) −0.6 −0.4 −0.2 0.0 0.2 0.4 0.6 −0.4 −0.2 0.0 0.2 0.4 Fungi PC1 (18.5%) PC2 (10.7%) EXTADU_3 EXTADU_1 EXTADU_2 INTLAR_1 INTLAR_2 EXTLAR_3 EXTLAR_1 EXTLAR_2 EXTPUP_2 EXTPUP_3 EXTPUP_1 INTLAR_3 INTADU_2 INTADU_3 INTADU_1
INTPUP_3 INTPUP_2INTPUP_1
EXTADU_1 EXTADU_3 EXTADU_2 EXTLAR_3 EXTLAR_1 EXTLAR_2 INTLAR_1 INTLAR_2 INTLAR_3 INTADU_2 INTADU_3 INTADU_1 INTPUP_2 INTPUP_1 INTPUP_3 EXTPUP_3 EXTPUP_2 EXTPUP_1