HAL Id: hal-02120589
https://hal.inria.fr/hal-02120589v2
Submitted on 29 May 2019
HAL is a multi-disciplinary open access
archive for the deposit and dissemination of
sci-entific research documents, whether they are
pub-lished or not. The documents may come from
teaching and research institutions in France or
abroad, or from public or private research centers.
L’archive ouverte pluridisciplinaire HAL, est
destinée au dépôt et à la diffusion de documents
scientifiques de niveau recherche, publiés ou non,
émanant des établissements d’enseignement et de
recherche français ou étrangers, des laboratoires
publics ou privés.
An Empirical Study of Power Characterization
Approaches for Servers
Yewan Wang, David Nörtershäuser, Stéphane Le Masson, Jean-Marc Menaud
To cite this version:
Yewan Wang, David Nörtershäuser, Stéphane Le Masson, Jean-Marc Menaud. An Empirical Study of
Power Characterization Approaches for Servers. ENERGY 2019 - The Ninth International Conference
on Smart Grids, Green Communications and IT Energy-aware Technologies, Jun 2019, Athens, Greece.
pp.1-6. �hal-02120589v2�
An Empirical Study of Power Characterization Approaches for Servers
Yewan Wang
∗†, David N¨ortersh¨auser
∗, St´ephane Le Masson
∗and Jean-Marc Menaud
†∗Orange Labs R&D, Lannion, France Email : firstname.lastname@orange.com †IMT Atlantique, INRIA, LS2N, France Email : firstname.lastname@imt-atlantique.fr
Abstract—Data centers are energy-hungry facilities. Emerging studies have proposed energy-aware solutions for reducing the power consumption of data centers. Power consumption charac-terization of servers is an essential part to realize power-aware adaption strategies. Traditional methods adopt accuracy and secure direct measurements by using physical instruments such as wattmeters. Recently, watt-meter free solutions are adopted widely as an economical replacement. These solutions provide power consumption information by making use of self-resources without additional instruments. There are two commonly adopted solutions: 1) standard specifications that provide interface with integrated sensors, such as Intelligent Platform Management Interface (IPMI) and Redfish; 2) Power models based on system activity related indicators. The energy-aware scheduling decisions are made based on the power values obtained, but few works give information about the correctness of the power values while discussing the results or drawing conclusions. In this study, we try to fill up this missing part by evaluating some commonly used, economical ways in obtaining power values. We compare and discuss the reliability, advantages and limitations for the CPU-utilization based power models. The findings highlight the challenges in realizing accurate and reliable power models. We also evaluate the reliability of IPMI and RedFish, in order to give references in choosing appropriate power characterization solutions.
Keywords–Server power model; Inlet temperature; IPMI; Red-Fish.
I. INTRODUCTION
Cloud data centers are computer facilities formed by hun-dreds or even thousands of servers. With the increasing demand of cloud services, energy efficiency of servers in data center has become a significant issue. Reliable power characterization approaches are essential for supporting energy-aware solutions. High accuracy power analyses are capable of providing accu-rate power consumption data. However, limitations like high cost, weak support of integration with Unix systems (which are widely adopted among server platforms) make it unreal-istic by using power analyzers in a data center environment. Therefore, some alternative economical solutions that make use of available resources without extra investment are widely adopted. The reliability of these solutions need to be evaluated thoughtfully before applying to different real situations. In this paper, we investigate experimentally two kinds of alternative solutions: 1) Power models based on system activity indicators, such as usage of physical components and Performance Mon-itoring Counters (PMC); 2) Industrial standard specifications based on integrated sensors, such as: IPMI, Redfish.
The paper is organized as follows: In Section II, we present some previous studies about building power models for PC or server systems. In Section III, we evaluate empirically the power models based on CPU utilization. The server is stressed
with an industrial test tool. Principal components like CPU, memory and storage are stressed at different load levels. Then, in Section IV we evaluate the precision of Redfish and IPMI applied in a new series of IBM servers. The measures of power consumption recorded by Redfish and IPMI are compared with a high-accuracy power analyzer. Conclusions and perspectives are given in Section V.
The major contributions of this paper are:
• We evaluate power models based on CPU-utilization. Thermal influence of inlet temperature is especially discussed.
• We give some suggestions in building accuracy power models according to experiments.
• We discuss the reliability of power data provided by IPMI and Redfish based APIs.
II. POWERMODELS: BACKGROUND AND RELATED WORK Modeling power consumption of servers is an active area of research. Power models takes advantages of indirect mea-surements to predict the power consumption of the elements in an IT system, from single components like processors, to the entire machine. Comparing to physical power analyzers, power models have several advantages. In general, it provides an economical way via making use of self-resources. In deeper insight, power models are capable of linking the energy usage data with system activities. That makes it possible to isolate the energy consumed by single process or Virtual Machine (VM). In this case, performance bottlenecks, inefficiency of algorithm are possible to be identified and optimized in a more dedicated way. In practical, power models are easy to integrated with server system, they can be used to help with some power management strategies, such as VM Migration, shut down technologies, etc. Therefore, it is not surprising that there has been a considerable amount of work in the area of power modeling.
A. CPU-Utilization based method
In early stage, power models adopt the utilization of CPU as the only input. One of the most notable study is conducted by Fan et al. [1], whose study has shown that the power consumption of servers can be accurately represented by CPU utilization by using simple linear relationship. The error is validated less than 5% for dynamic system activities. Economou et al. [2] introduced a method called Mantis to model full-system power consumption. The model is built with linear regression based on component utilization metrics: CPU Utilization, off-chip memory accesses, disk and network I/O rates. The model achieves an overall error range from 0% to
15% for two different server systems. Especially, the blade model has errors less than 5% for all cases. After that, with the evolution of manufacturing, server architecture becomes more complex, the accuracy of models based on CPU utilization has been questioned in many ways. Orgerie et al. [3] argued that the relationship between the CPU consumption and its load is not linear. The results of their experiments showed that even applying the same CPU load, they observed three different power consumption values. Hence, they concluded that it is indeed not possible to get a linear function between CPU utilization and power consumption. Zhang et al. [4] validated the linear model for 392 published results, which composed of different kind of servers. They use R-squared values to evaluate their model. R-squared is also known as coefficient of determination. The value of R-squared ranges from 0 to 1, describes the goodness of prediction, the higher the better. The authors show that, among 395 published results, 6.5% (25 kinds of servers) have the R-squared values less than 0.95, which means the CPU utilization is not always correlated significantly with server power usage.
B. PMC based method
Furthermore, researchers try to build power estimation models with performance monitoring counters. PMCs record and store the counts of system-related activities. The principal of models based on PMCs is the selection of several PMCs, which have good correlation with power. The models can be then illustrated by linear, non-linear regression formula, or even by neural network. PMCs based power models usually have better accuracy in comparing with single indicators based model.
Da Costa et al [5] evaluate the power consumption of a PC by using performance counters, then extend the concep-tion to predict the power consumpconcep-tion of single applicaconcep-tions. Training data is collected by running several applications and synthetic benchmarks. A small number of optimal variables combinations within 165 different counters are selected for each synthetic benchmark, which has the best regression result with the real power consumption measurements. Then, a global model for the entire PC is derived by including and analyzing the possible candidate variables. The global model has R-squared values greater than 0.94 for all the cases when applied respectively to each benchmark. Even though they did not evaluate the global model with some real applications, their results confirm the feasibility by using PMC to predict the power consumption of the IT systems.
Bircher et al. [6] propose a method to create power models for six subsystems (CPU, memory, chipset, I/O, disk and GPU) by using performance counters within processors. They chose several performance events which are highly correlated to power consumption in subsystem including memory, chipset, IO, disk and processor. Resistors are connected in series with power source to capture the power consumption for each subsystem. Their models are validated by a wide range of workloads and achieved an average error less than 9% for each subsystem. However, they did not mention the model accuracy for the entire system.
Witkowski et al. [7] present a practical approach to estima-tion power consumpestima-tion of applicaestima-tions in High Performance Computing (HPC) environment. Their models are represented as regression functions by using only a few variables related
to CPU, motherboard and memory. Variables will be included in the model once the coefficient of determination increases. Some of the original variables are transformed to increase model accuracy. When validated with the same synthetic work-loads during training phase, their model reports an average error between 1% and 4% comparing to real measurements. However, the average error is increased to a range of 3% -7% when tested with a real HPC application.
Some state-of-the-art power models provide platform-specific solutions [8] [9], which makes the model more ac-curate and adaptive in current situation. However, the method used to build the model is also less general and portable, limited to specific conditions. Some other researchers suggest advanced machine learning techniques to improve accuracy of PMC-based models for general use. Some of them point that, the accuracy of model can be greatly increased by removing some irregular outliers of measurements [7] [5].
Cupertino et al. [10] propose to use Artificial Neural Network (ANN), one of the computational intelligence tech-nologies to improve the model accuracy. They compare the Mean Absolut Percentage Error (MAPE) between an ANN model and a traditional capacitive model, and show that the ANN can decrease the MAPE from 5.45% to 1.86%.
Wang et al. [11] point out that for a given processor, the usage of PMCs is limited by the available event counters and the maximum number of PMCs that can be read simul-taneously. Even more, power models with less PMC can be more flexible and applicable. Based on this fact, the authors have then proposed a power model with only Instruction Per Cycle (IPC) and frequency as inputs. In order to improve the accuracy, running benchmarks will be divided into different categories based on IPC values, then they build the models separately for each category. The authors also develop a tool SPAN to realize run-time power profiling and correlate power dissipation to source code functions. Their power model is validated by using two benchmarks from SPEC2008Cjvm, and achieve absolute error rate of 5.17% and 4.46% respectively. Tool ”SPAN” achieve accuracy as high as 97% on average by running FT benchmark from NAS Parallel benchmark suite and synthetic workloads.
Mair et al. [12] present their power estimation model called W-Classifier. The model classifies different workloads into 5 categories by using some power-dominant PMCs: INT, FPU, FPU/cache mixed, INT/cache mixed and memory/idle. They validate W-Classifier with OpenMP multi-threaded bench-marks from NAS Parallel Benchmark suite on all 16 cores. They find that W-Classifier has an average MAE of 6.95% for all benchmarks, while traditional multi-variable model achieves an average MAPE of 40.74%. However, authors admit that W-classifier has difficulty to estimate the power consump-tion of benchmarks with large range of power variaconsump-tion. They have then proposed to improve the model by adding more kinds of classification categories as further work.
C. Challenges
Obtaining accurate results of consumption behavior at the whole system level or individual component level is not straightforward. The difficulties include but are not limited to the following raisons: 1) Diversity. Physical architecture of server differs very much between manufactures and becomes more complicated from generation to generation, with the
emerging of new features. The availability of PMCs differs among different machines [7]. The problem of the diversity makes the power models less portable between heterogeneous servers in Data centers. 2) Evolution. Evolution of system is somehow rapid and random. Some indicators used to build the original model would be no longer exist with the evolution of computing system. For example, four years after the introduce of Mantis [2] (mentioned in 2.1), John C et al [13] have noticed that, some of the original indicators used by Mantis on longer exist in current systems. 3) Hidden system behaviors. Some component incorporates make optimization without exposing to any of the existing counters, which makes some device be-haviors invisible to OS [13]. High precision will be difficult to achieve without being aware of these changes that affect power draw. 4) Variability. Previous studies have given quantitative evidences about the significant variability between identical designed CPU and servers [14]–[17]. Parameter variation, also known as Process, Voltage and Temperature (PVT) variation [18], is responsible for most of the variations. Among them, process and voltage variations are caused by imperfections from fabrication process. Temperature variation comes from fluctuating environments. These variations are inevitable and influential to power consumption. One of our previous study has demonstrated the power consumption variation between identical servers leads from thermal effects [19]. These obser-vations bound the potential accuracy achievable concerning all kinds of power modeling approaches.
All the evidences listed here highlights the challenges in building reliable power models for servers, especially for the modern ones.
III. POWER MODELS BASED ONCPU-UTILIZATION In this section, we evaluate experimentally the effectiveness of using CPU-utilization as the indicator for building power models. Influence of inlet temperature variation has also been demonstrated by using a test use case.
A. CPU-Utilization based models
The model is built for a Gigabyte mw50-sv0 server, equipped with one Xeon E5-2609v3 processor. Several work-loads from Server Efficiency Rating Tool (SERT) [20] are cho-sen as the test suite. SERT is an industrial standard rating tool for evaluating energy-efficiency for server systems, developed by SPEC committee. It contains a number of micro-workloads, called worklets that exercise different components of the Server Under Test (SUT) at different target load levels. (see Table I for details). In this experiment, ten worklets composed of both CPU and memory intensive types are chosen to stress the server. The test suit includes six CPU-intensive tests (Compress, CryptoAES, LU, SOR, Sort and SHA256), one CPU and memory hybrid test (SSJ), and two memory-intensive tests (Flood3 and Capacity3). Consumption at idle state is also measured. Details about the worklets used can be found in Table I [21].
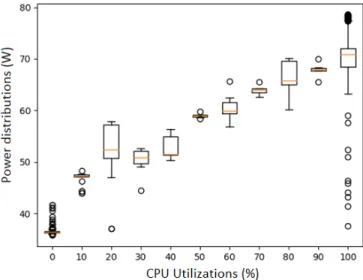
The power consumption data is collected by Yokogawa WT330, a high-accuracy power analyzer, with maximum mea-surement error less than 1%. CPU utilization is collected by redirecting the information from directory /proc/cpuinfo. Data collection frequency is set at 1Hz. At the end of test, box plot from matplotlib [22] is used to interpreted the dispersion of power for a given CPU utilization. Box plot is widely
used for displaying statistic distribution, a simplified manner in comparison to a histogram or density plot. For a normal distribution, 50% of the data is within the box. Two short lines beyond the box represent for the minimum and maximum values within 99.3% of the data. Outliers represent for the remaining 0.7% data. The test result is shown in Figure 1. We can see from the figure that the models built from CPU-utilization are not reliable enough. For a fixed CPU-CPU-utilization, the server power spreads out between a considerable range, especially for the utilization at 100%. Outliers are caused by the quick changes of system loads. The power ranges are relatively lower at 10%, 50%, 70% and 90%, because of a lack of experimental data at these load levels.
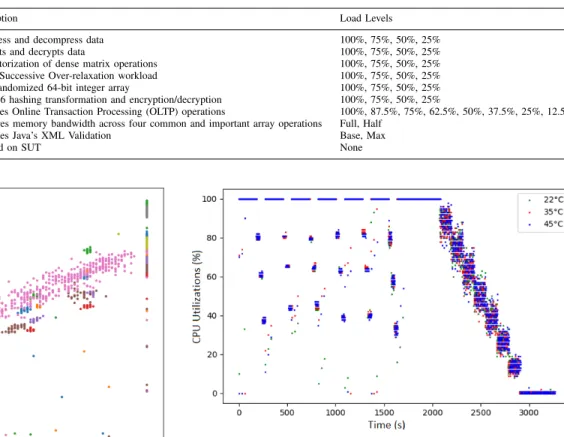
We illustrate then the relationship between CPU-utilization and server power for each worklet by marking with different colors. The result in Figure 2 shows that, for each worklet, server power has a narrow distribution for a specific CPU utilization, which means power consumption can be precisely modeled by CPU utilization during a single workload ex-ecution. Moreover, for the worklets from the same ”CPU intensive” category, power is proportional to CPU utilization with different parameters. For instance, worklet LU has an obvious different way in increasing power comparing with the other CPU intensive worklets. As further work, we will try to improve the accuracy for CPU utilization based power models by classifying the workloads into different groups with PMCs.
Figure 1. Distribution of power under different CPU-utilization.
B. Influence of ambient temperature: a test use case
Furthermore, we evaluate the influence of inlet temperature to the power consumption of server. The server is placed in a climatic cabin, where we can control the ambient temperature precisely. Inlet temperature is measured by a thermocouple of type K. Test suite SERT is executed three times to the server at 22◦C, 35◦C and 45◦C inlet temperatures respectively. The results of the power consumption of server under different ambient temperatures can be seen in Figure 3. Server power increases with the rise of inlet temperatures. The increment of power is contributed mainly by fans and leakage current of CPU [19]. Unlike power consumption, CPU utilization
TABLE I. TEST SUITE INFORMATION
Worklet Components Description Load Levels
Compress CPU Compress and decompress data 100%, 75%, 50%, 25% CryptoAES CPU Encrypts and decrypts data 100%, 75%, 50%, 25% LU CPU LU factorization of dense matrix operations 100%, 75%, 50%, 25% SOR CPU Jacobi Successive Over-relaxation workload 100%, 75%, 50%, 25% Sort CPU Sorts randomized 64-bit integer array 100%, 75%, 50%, 25% SHA256 CPU SHA256 hashing transformation and encryption/decryption 100%, 75%, 50%, 25%
SSJ CPU/Cache/Memory simulates Online Transaction Processing (OLTP) operations 100%, 87.5%, 75%, 62.5%, 50%, 37.5%, 25%, 12.5% Flood Memory Measures memory bandwidth across four common and important array operations Full, Half
Capacity Memory Exercises Java’s XML Validation Base, Max
Idle System No load on SUT None
Figure 2. Relationships between CPU-utilization and server power of different worklets.
remains the same under different inlet temperatures as shown by Figure 4. Therefore, as demonstrated by the experiments, there is a risk of losing accuracy without considering variation of ambient temperature in the models.
Figure 3. Server power under three different ambient temperatures.
Taking the data sets of worklet SSL as a use case. Function (1) describes a baseline model proposed by [1]. Data set is
Figure 4. CPU utilization under different inlet temperatures.
collected at 22◦C inlet temperature. Estimated power is simply represented by a linear function by using the power values at idle and full load. Beyond the baseline model, Delta(T ) is derived by analyzing the relationship between inlet temperature and power increment for the whole data sets. Delta(T ) can be interpreted by a quadratic equation as shown in function (2). Finally new power model is built by adding Delta(T ) to the baseline model, as shown by (3).
Pestimated= Pidle+ Ucpu%(P100%− Pidle) (1)
Delta(T ) = a0+ a1T + a2T2 (2)
Pestimated= Pidle+ Ucpu%(P100%− Pidle) + Delta(T ) (3)
Within the formulas, Ucpu% represents CPU utilization
in percentage and T is inlet temperature. Pidle and P100%
are the average powers (Watt) when server running at idle (Ucpu% = 0) and full load (Ucpu% = 100). The models are
trained and validated with the same data set by using cross validation from function cross_val_score from scikit-learn [23], cross validation (cv) generator is set to 4 to realize a 4-fold cross validation. The average MAPEs after CV for model (1) and (3) shown in Table II demonstrate the effectiveness of the updated model (3). The MAPE of baseline model (1) increases dramatically with the inlet temperature rises from 22◦C to 45◦C.
TABLE II. MAPE OF MODELS AT DIFFERENT INLET TEMPERATURE.
TInlet(◦C) 22 30 45
Model without Delta (T◦) 5.6 % 9.2 % 16.8 % Model with Delta (T◦) 4.6 % 4 % 3.2 %
IV. INDUSTRIAL STANDARD SPECIFICATIONS EVALUATIONS: IPMI & REDFISH
IPMI and Redfish are usually available in modern high performance servers. They can be used to monitor system state information such as power consumption, inlet and exhaust temperatures through specific interfaces. IPMI represents for Intelligent Platform Management Interface, created by Intel, Dell, HP and NEC in 1998. It is a standardized hardware management interface and has been widely implemented on more 200 server vendors nowadays [24]. IPMI is designed to realize system-management independently without passing through OS. Administrators are allowed using IPMI to manage the machine locally or remotely regardless of its state (on or off). Monitoring system status is one of the functionality of IPMI. IPMI can communicate with Baseboard Manage-ment Controller (BMC) to retrieve data of certain hardware components (temperature probe, Fans, power supplies, etc.). BMC is a specialized micro controller embedded on the motherboard by the vendors. There are several open source tools supporting IPMI protocol, such as ipmitool, freeipmi, OpenIPMI, etc. Then, with the massive growth in size and complex of Data centers, traditional IPMI is not sufficient to manage the modern scalable data centers anymore. Hence, In 2010, Distributed Management Task Force (DMTF) proposed Redfish to overcome the limitations of IPMI in terms of scalability, performance, simplicity and interoperability [25]. In comparison with IPMI, Redfish is a standard API adopts HTTPS protocol, which is considered more secure than UDP protocol (adopted by IPMI). In addition, Redfish use human readable technologies like JSON and OData, which makes the operations such as request and response more user friendly. However, the work for Redfish hasn’t finished and is still a Work in Progress on the website of DMTF [26].
A. IPMI or Redfish: Which is more accurate?
The difference between IPMI and Redfish makes us curious about their actual capabilities of power characterizations. Before implementing specific tool into energy-aware projects, it is better to well aware of the accuracy and limitations of the tool. Therefore, we design and conduct an experiment to evaluate accuracy of power consumption readings from IPMI and Redfish. Their readings are recorded and compared in real time with a high accuracy power analyzer. The experiment is conducted in a prototype modular server from Lenovo Skylake series. Both IPMI and RedFish interfaces are supported. The server equipped with two Xeon Gold 6142@2.6GHz processors, 390GB RAM and 500G SSD. Server is stressed with the same test suite SERT as mentioned in previous experiments, with a total execution time of about 2 hours. The power usage data from IPMI are retrieved by an open source API tool freeipmi [27]. And readings of Redfish are provided by Redfish REST API, through the integrated XClarity Controller introduced by Lenovo. High accuracy power analyzer Yokogawa WT330 is place between server
power supply unit and wall plug to measure and record power consumption data as reference (with maximum measurement error less than 1%). A docker container is developed to redirect and synchronize the readings from three channels to local database by using Network Time Protocol (NTP). Sampling frequency is set to 2 Hz.
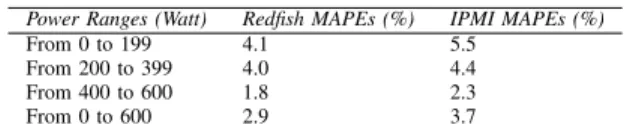
We calculate MAPEs for both IPMI and Redfish within three power ranges. The results shown in Table III show that, sensors integrated in servers seem to have different precisions across different power ranges. Otherwise, power readings re-trieved from Redfish have better results comparing to IPMI for each ranges. Power consumption has denser variations during lower ranges. After several experiments, we find that, the data collected from Redfish and IPMI is not refreshed instantly. A latency of about 200 ms is observed, which means the power value recorded may come from 200ms ago. The accuracy can be questioned when power varies quickly.
The work presented in this paper give references in choosing power consumption characterization solutions. We suggest that, before applying available economical solutions in an energy-aware scheduling or distribution task, check the precision of the solution and make sure that accuracy is enough for supporting the decision making.
TABLE III. MAPE OF REDFISH & IPMI BETWEEN DIFFERENT POWER RANGES.
Power Ranges (Watt) Redfish MAPEs (%) IPMI MAPEs (%) From 0 to 199 4.1 5.5
From 200 to 399 4.0 4.4 From 400 to 600 1.8 2.3 From 0 to 600 2.9 3.7
V. CONCLUSION
In this paper, we present a deep evaluation about the power models based on CPU utilization. The influence of inlet temperature on models has been especially discussed. According to the analysis, one regression formula by using CPU utilization as the only indicator is not adequate for building reliable power models. First of all, Workloads have different behaviors by using CPU and other hardware resources in server platforms. Therefore, power is observed to have high dispersion for a fixed CPU utilization, especially at full work-load (CPU utilization = 100%). At the same time, we also find that, power is well proportional to CPU utilization within the execution of one single workload. Hence, applying workload classifications could be an effective way to improve model accuracy. Moreover, inlet temperature can cause surprising influence on model accuracy. The model reliability can be questioned without including inlet temperature data. In a use case, after including inlet temperature data, we have greatly improved the precision of model outputs while stressing server under three different ambient temperatures.
Using industrial specifications, such as IPMI and Redfish is another popular way to get power consumption data for some modern HPC servers. The experiment results show that, the precision of both IPMI and Redfish differs from different power ranges, the higher the better. We blame the loss of precision to the latency during request. Comparing to IPMI, Redfish is observed to have less latency in our experiments.
REFERENCES
[1] X. Fan, W.-D. Weber, and L. A. Barroso, “Power provisioning for a warehouse-sized computer,” in Proceedings of the 34th Annual International Symposium on Computer Architecture, ser. ISCA ’07. New York, NY, USA: ACM, 2007, pp. 13–23. [Online]. Available: http://doi.acm.org/10.1145/1250662.1250665
[2] D. Economou, S. Rivoire, C. Kozyrakis, and P. Ranganathan, “Full-system power analysis and modeling for server environments.” In Workshop on Modeling Benchmarking and Simulation (MOBS), 2006. [3] A. Orgerie, L. Lefvre, and J. Gelas, “Demystifying energy consumption in grids and clouds,” in International Conference on Green Computing, Aug 2010, pp. 335–342.
[4] X. Zhang, J. Lu, X. Qin, and X. Zhao, “A high-level energy consumption model for heterogeneous data centers,” Simulation Modelling Practice and Theory, vol. 39, 2013, pp. 41–55, s.I.Energy efficiency in grids and clouds.
[5] G. Da Costa and H. Hlavacs, “Methodology of measurement for energy consumption of applications,” in 2010 11th IEEE/ACM International Conference on Grid Computing, Oct 2010, pp. 290–297.
[6] W. L. Bircher and L. K. John, “Complete system power estimation using processor performance events,” IEEE Transactions on Computers, vol. 61, no. 4, April 2012, pp. 563–577.
[7] M. Witkowski, A. Oleksiak, T. Piontek, and J. Wglarz, “Practical power consumption estimation for real life hpc applications,” Future Generation Computer Systems, vol. 29, no. 1, 2013, pp. 208–217, including Special section: AIRCC-NetCoM 2009 and Special section: Clouds and Service-Oriented Architectures. [Online]. Available: http://www.sciencedirect.com/science/article/pii/S0167739X12001392 [8] A. Lewis, S. Ghosh, and N.-F. Tzeng, “Run-time energy consumption
estimation based on workload in server systems,” in Proceedings of the 2008 Conference on Power Aware Computing and Systems, ser. HotPower’08. Berkeley, CA, USA: USENIX Association, 2008, p. 4. [Online]. Available: http://dl.acm.org/citation.cfm?id=1855610.1855614 [9] R. Basmadjian and H. de Meer, “Evaluating and modeling power consumption of multi-core processors,” in Proceedings of the 3rd International Conference on Future Energy Systems: Where Energy, Computing and Communication Meet, ser. e-Energy ’12. New York, NY, USA: ACM, 2012, pp. 1–10. [Online]. Available: http://doi.acm.org/10.1145/2208828.2208840
[10] L. F. Cupertino, G. Da Costa, and J.-M. Pierson, “Towards a generic power estimator,” Computer Science-Research and Develop-ment, vol. 30, no. 2, 2015, pp. 145–153.
[11] S. Wang, H. Chen, and W. Shi, “Span: A software power analyzer for multicore computer systems,” Sustainable Computing: Informatics and Systems, vol. 1, no. 1, 2011, pp. 23–34. [Online]. Available: http://www.sciencedirect.com/science/article/pii/S221053791000003X [12] J. Mair, Z. Huang, D. Eyers, and H. Zhang, “Pmc-based power
modelling with workload classification on multicore systems,” in 2014 43rd International Conference on Parallel Processing Workshops, Sep. 2014, pp. 129–138.
[13] J. C. McCullough et al., “Evaluating the effectiveness of model-based power characterization,” in Proceedings of the 2011 USENIX Confer-ence on USENIX Annual Technical ConferConfer-ence, ser. USENIXATC’11. Berkeley, CA, USA: USENIX Association, 2011, p. 12. [Online]. Available: http://dl.acm.org/citation.cfm?id=2002181.2002193 [14] J. von Kistowski et al., “Variations in cpu power consumption,” in
Proceedings of the 7th ACM/SPEC on International Conference on Performance Engineering, ser. ICPE ’16. New York, NY, USA: ACM, 2016, pp. 147–158. [Online]. Available: http://doi.acm.org/10. 1145/2851553.2851567
[15] A. Marathe et al., “An empirical survey of performance and energy efficiency variation on intel processors,” in Proceedings of the 5th International Workshop on Energy Efficient Supercomputing, ser. E2SC’17. New York, NY, USA: ACM, 2017, pp. 1–8. [Online]. Available: http://doi.acm.org/10.1145/3149412.3149421
[16] B. Acun, P. Miller, and L. V. Kale, “Variation among processors under turbo boost in hpc systems,” in Proceedings of the 2016 International Conference on Supercomputing, ser. ICS ’16. New York, NY, USA: ACM, 2016, pp. 1–12. [Online]. Available: http://doi.acm.org/10.1145/2925426.2926289
[17] D. Mohammed El Mehdi, G. Olivier, L. Laurant, and M. Jean Christophe, “Your cluster is not power homogeneous: Take care when designing green schedulers!” in 2013 International Green Computing Conference Proceedings, June 2013, pp. 1–10. [18] E. Humenay, D. Tarjan, and K. Skadron, “Impact of parameter variations
on multi-core chips,” Virginia Univ Charlottesville Dept of Computer Science, Tech. Rep., 2006.
[19] Y. Wang, D. N¨ortersh¨auser, S. Le Masson, and J.-M. Menaud, “Potential effects on server power metering and modeling,” Wireless Networks, 2018, pp. 1–8.
[20] K.-D. Lange and M. G. Tricker, “The design and development of the server efficiency rating tool (sert),” in Proceedings of the 2Nd ACM/SPEC International Conference on Performance Engineering, ser. ICPE ’11. New York, NY, USA: ACM, 2011, pp. 145–150. [Online]. Available: http://doi.acm.org/10.1145/1958746.1958769 [21] S. P. Committee. Server efficiency rating tool public design document
(latest version). Retrieved: May 2, 2016. [Online]. Available: https://en.wikichip.org/wiki/technology node (2013)
[22] J. D. Hunter, “Matplotlib: A 2d graphics environment,” Computing In Science & Engineering, vol. 9, no. 3, 2007, pp. 90–95.
[23] F. Pedregosa, G. Varoquaux, A. Gramfort, V. Michel, B. Thirion, O. Grisel, M. Blondel, P. Prettenhofer, R. Weiss, V. Dubourg, J. Vander-plas, A. Passos, D. Cournapeau, M. Brucher, M. Perrot, and E. Duch-esnay, “Scikit-learn: Machine learning in python,” Journal of Machine Learning Research, vol. 12, 2011, pp. 2825–2830.
[24] Intel. Intelligent platform management interface: Ipmi adopters list. Retrieved: Jan 22, 2019. [Online]. Available: https://www.intel.com/ content/www/us/en/servers/ipmi/ipmi-adopters-list.html
[25] “Validation of redfish: The scalable platform management standard,” in Companion Proceedings of the10th International Conference on Utility and Cloud Computing, ser. UCC ’17 Companion. New York, NY, USA: ACM, 2017, pp. 113–117. [Online]. Available: http://doi.acm.org/10.1145/3147234.3148136
[26] DMTF. Redfish api. Retrieved: Jan 22, 2019. [Online]. Available: https://www.dmtf.org/standards/redfish
[27] F. C. Team. Freeipmi - home. Retrieved: Jan 22, 2019. [Online]. Available: https://www.gnu.org/software/freeipmi/