Modified Proposed 2012-2013 Program Budget
The modified proposal is based on the following:
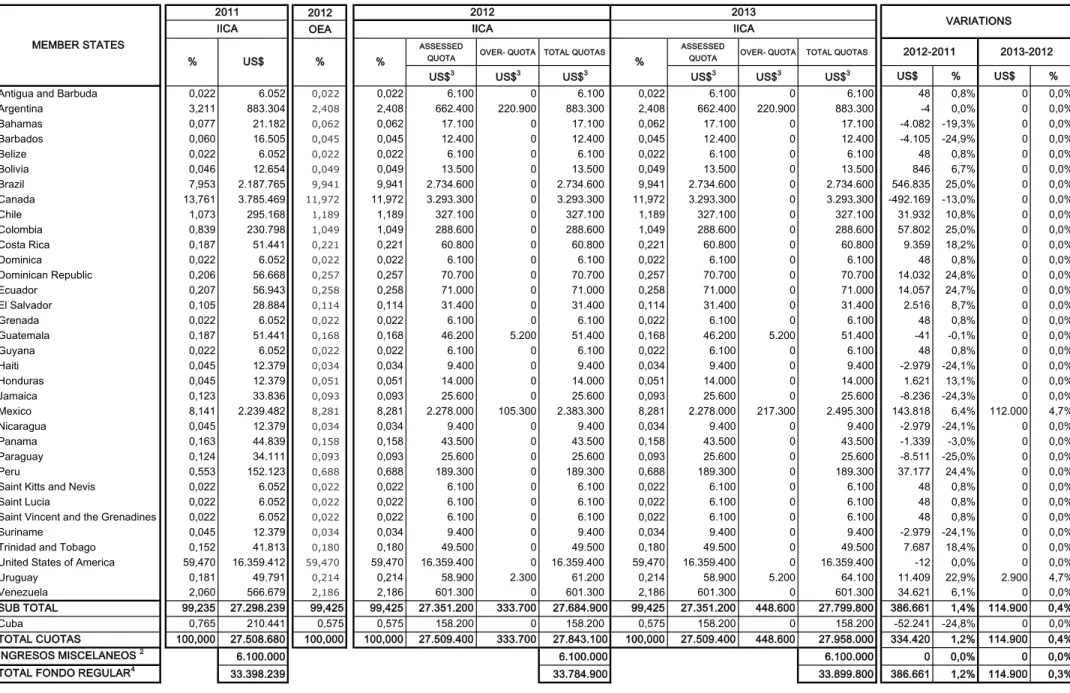
The total amount of assessed quotas is unchanged from the 2011 Program Budget.
The new quota scale for 2012, approved by the OAS General Assembly on June 7, 2011, in Resolution AG/RES.2696 (XLI-0/11), has
been applied.
Over-quota contributions for Argentina, Guatemala, Mexico and Uruguay for each year of the biennium, as well as the positive
pronouncement on the part of Belize, have been taken into consideration.
Miscellaneous income is kept at US$6.1 million per year, financed with the US$3.5 million estimated to be generated and US$2.6 million
from the Miscellaneous Income Fund.
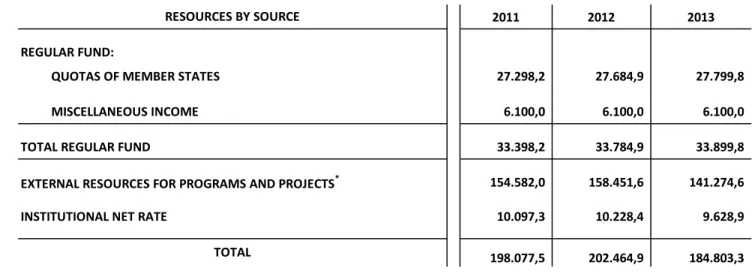
The total amount of the Regular Fund will be US$33,784,900 for 2012 and US$33,899,800 for 2013. (See Table No. 2.)
These budget amounts imply that shortfalls of US$1,879,900 in 2012, and an additional US$717,525 in 2013, will have to be covered, as a result
of: i) variations in local personnel costs, generated by government-decreed salary increases; the need to remain competitive in national labor
markets, as a means of partially offsetting the turnover in personnel, which in recent years has been 11%; and negative exchange rate impacts due
to the revaluation of certain local currencies; and ii) an increase in international personnel costs as a result of a partial adjustment for inflation in
2012 and post adjustments in 2012 and 2013, in which local inflation and the impact of the exchange rate play a role.
The following measures are proposed to cover these shortfalls:
To cut back operating costs (major objects of expenditure 3 to 9, excluding personnel) by US$746,138 in 2012 (6.2%) and an additional
US$602,625 in 2013 (5.4%), as detailed in Table No. 9.
To eliminate six personnel positions in the following areas:
o Biotechnology and Biosafety
o Clean Energies
o Risk Management and Reduction in Agriculture and Agribusiness
o Formulation of Technical Cooperation Projects
Table No. 1
2012 - 2013
Program Budget
2011
2012
2013
REGULAR FUND:
QUOTAS OF MEMBER STATES
27.298,2
27.684,9
27.799,8
MISCELLANEOUS INCOME
6.100,0
6.100,0
6.100,0
TOTAL REGULAR FUND
33.398,2
33.784,9
33.899,8
EXTERNAL RESOURCES FOR PROGRAMS AND PROJECTS
*154.582,0
158.451,6
141.274,6
INSTITUTIONAL NET RATE
10.097,3
10.228,4
9.628,9
198.077,5
202.464,9
184.803,3
RESOURCES BY SOURCE
TOTAL
*/ Estimates. Final figures will depend on the agreements signed.
Overall Budget
2011 and 2012 - 2013 Program Budget
(US$ x 000)
Table No. 2
2012
OEA
ASSESSED
QUOTA OVER- QUOTA TOTAL QUOTAS
ASSESSED
QUOTA OVER- QUOTA TOTAL QUOTAS
US$
3US$
3US$
3US$
3US$
3US$
3US$
%
US$
%
Antigua and Barbuda
0,022
6.052
0,0220,022
6.100
0
6.100
0,022
6.100
0
6.100
48
0,8%
0
0,0%
Argentina
3,211
883.304
2,4082,408
662.400
220.900
883.300
2,408
662.400
220.900
883.300
-4
0,0%
0
0,0%
Bahamas
0,077
21.182
0,0620,062
17.100
0
17.100
0,062
17.100
0
17.100
-4.082 -19,3%
0
0,0%
Barbados
0,060
16.505
0,0450,045
12.400
0
12.400
0,045
12.400
0
12.400
-4.105 -24,9%
0
0,0%
Belize
0,022
6.052
0,0220,022
6.100
0
6.100
0,022
6.100
0
6.100
48
0,8%
0
0,0%
Bolivia
0,046
12.654
0,0490,049
13.500
0
13.500
0,049
13.500
0
13.500
846
6,7%
0
0,0%
Brazil
7,953
2.187.765
9,9419,941
2.734.600
0
2.734.600
9,941
2.734.600
0
2.734.600
546.835
25,0%
0
0,0%
Canada
13,761
3.785.469
11,97211,972
3.293.300
0
3.293.300
11,972
3.293.300
0
3.293.300
-492.169 -13,0%
0
0,0%
Chile
1,073
295.168
1,1891,189
327.100
0
327.100
1,189
327.100
0
327.100
31.932
10,8%
0
0,0%
Colombia
0,839
230.798
1,0491,049
288.600
0
288.600
1,049
288.600
0
288.600
57.802
25,0%
0
0,0%
Costa Rica
0,187
51.441
0,2210,221
60.800
0
60.800
0,221
60.800
0
60.800
9.359
18,2%
0
0,0%
Dominica
0,022
6.052
0,0220,022
6.100
0
6.100
0,022
6.100
0
6.100
48
0,8%
0
0,0%
Dominican Republic
0,206
56.668
0,2570,257
70.700
0
70.700
0,257
70.700
0
70.700
14.032
24,8%
0
0,0%
Ecuador
0,207
56.943
0,2580,258
71.000
0
71.000
0,258
71.000
0
71.000
14.057
24,7%
0
0,0%
El Salvador
0,105
28.884
0,1140,114
31.400
0
31.400
0,114
31.400
0
31.400
2.516
8,7%
0
0,0%
Grenada
0,022
6.052
0,0220,022
6.100
0
6.100
0,022
6.100
0
6.100
48
0,8%
0
0,0%
Guatemala
0,187
51.441
0,1680,168
46.200
5.200
51.400
0,168
46.200
5.200
51.400
-41
-0,1%
0
0,0%
Guyana
0,022
6.052
0,0220,022
6.100
0
6.100
0,022
6.100
0
6.100
48
0,8%
0
0,0%
Haiti
0,045
12.379
0,0340,034
9.400
0
9.400
0,034
9.400
0
9.400
-2.979 -24,1%
0
0,0%
Honduras
0,045
12.379
0,0510,051
14.000
0
14.000
0,051
14.000
0
14.000
1.621
13,1%
0
0,0%
Jamaica
0,123
33.836
0,0930,093
25.600
0
25.600
0,093
25.600
0
25.600
-8.236 -24,3%
0
0,0%
Mexico
8,141
2.239.482
8,2818,281
2.278.000
105.300
2.383.300
8,281
2.278.000
217.300
2.495.300
143.818
6,4%
112.000
4,7%
Nicaragua
0,045
12.379
0,0340,034
9.400
0
9.400
0,034
9.400
0
9.400
-2.979 -24,1%
0
0,0%
Panama
0,163
44.839
0,1580,158
43.500
0
43.500
0,158
43.500
0
43.500
-1.339
-3,0%
0
0,0%
Paraguay
0,124
34.111
0,0930,093
25.600
0
25.600
0,093
25.600
0
25.600
-8.511 -25,0%
0
0,0%
Peru
0,553
152.123
0,6880,688
189.300
0
189.300
0,688
189.300
0
189.300
37.177
24,4%
0
0,0%
Saint Kitts and Nevis
0,022
6.052
0,0220,022
6.100
0
6.100
0,022
6.100
0
6.100
48
0,8%
0
0,0%
Saint Lucia
0,022
6.052
0,0220,022
6.100
0
6.100
0,022
6.100
0
6.100
48
0,8%
0
0,0%
Saint Vincent and the Grenadines
0,022
6.052
0,0220,022
6.100
0
6.100
0,022
6.100
0
6.100
48
0,8%
0
0,0%
Suriname
0,045
12.379
0,0340,034
9.400
0
9.400
0,034
9.400
0
9.400
-2.979 -24,1%
0
0,0%
Trinidad and Tobago
0,152
41.813
0,1800,180
49.500
0
49.500
0,180
49.500
0
49.500
7.687
18,4%
0
0,0%
United States of America
59,470
16.359.412
59,47059,470
16.359.400
0
16.359.400
59,470
16.359.400
0
16.359.400
-12
0,0%
0
0,0%
Uruguay
0,181
49.791
0,2140,214
58.900
2.300
61.200
0,214
58.900
5.200
64.100
11.409
22,9%
2.900
4,7%
Venezuela
2,060
566.679
2,1862,186
601.300
0
601.300
2,186
601.300
0
601.300
34.621
6,1%
0
0,0%
SUB TOTAL
99,235
27.298.239
99,425
99,425
27.351.200
333.700
27.684.900
99,425
27.351.200
448.600
27.799.800
386.661
1,4% 114.900
0,4%
Cuba
0,765
210.441
0,575
0,575
158.200
0
158.200
0,575
158.200
0
158.200
-52.241 -24,8%
0
0,0%
TOTAL CUOTAS
100,000
27.508.680
100,000
100,000
27.509.400
333.700
27.843.100
100,000
27.509.400
448.600
27.958.000
334.420
1,2% 114.900
0,4%
INGRESOS MISCELANEOS
26.100.000
6.100.000
6.100.000
0
0,0%
0
0,0%
TOTAL FONDO REGULAR
433.398.239
33.784.900
33.899.800
386.661
1,2% 114.900
0,3%
Note: The percentage for Cuba is not taken into consideration when calculating the Member State quotas.
1/ As per Resolution AG/RES. 2696 (XLI-O/11), of the OAS General Assembly of June 7
th, 2011.
2/ In 2010 and 2011 miscellaneous income will comprise US$3,500,000 to be generated and US2,600,000 from the Miscellaneous Income Fund.
3/ Rounded off to the nearest one hundred.
4/ The total of the Regular Fund does not include Cuba.
2013
IICA
%
%
MEMBER STATES
Quota Scale of the Member States and Miscellaneous Income for 2012 and 2013 Based on the OAS Quota Scale for 2012
1
(US$)
%
VARIATIONS
2012-2011
2013-2012
%
US$
2011
2012
IICA
IICA
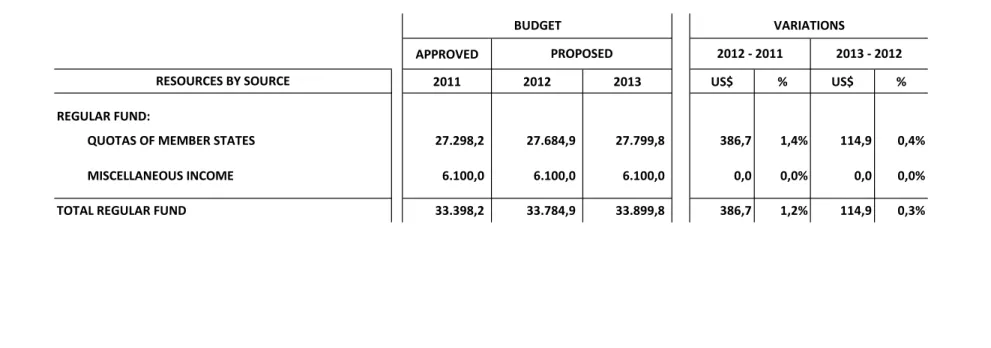
Program Budget
2012-2013
Table No. 3
2012 - 2013
Program Budget
APPROVED
2011
2012
2013
US$
%
US$
%
REGULAR FUND:
QUOTAS OF MEMBER STATES
27.298,2
27.684,9
27.799,8
386,7
1,4%
114,9
0,4%
MISCELLANEOUS INCOME
6.100,0
6.100,0
6.100,0
0,0
0,0%
0,0
0,0%
TOTAL REGULAR FUND
33.398,2
33.784,9
33.899,8
386,7
1,2%
114,9
0,3%
RESOURCES BY SOURCE
Budget of the Regular Fund
2011 and 2012 - 2013 Program Budget
(US$ x 000)
BUDGET
VARIATIONS
PROPOSED
2012 - 2011
2013 - 2012
Table No. 4
Program Budget
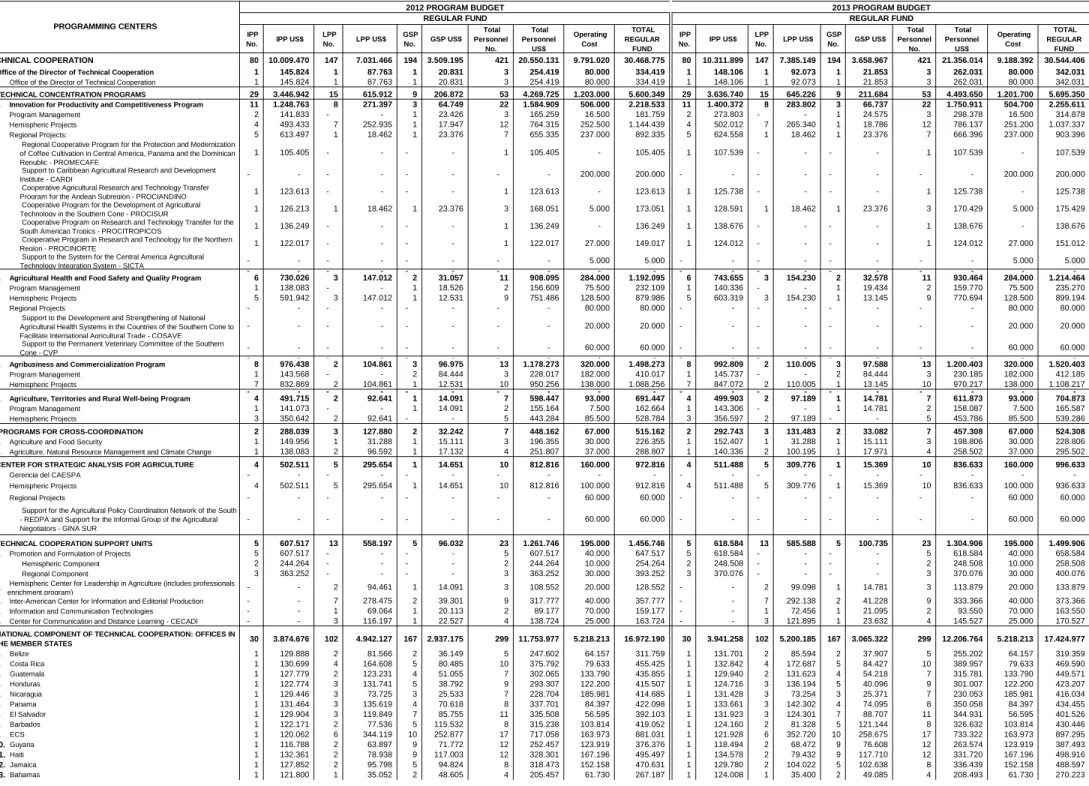
IPP No. IPP US$
LPP No. LPP US$ GSP No. GSP US$ Total Personnel No. Total Personnel US$ Operating Cost TOTAL REGULAR FUND IPP
No. IPP US$ LPP No. LPP US$ GSP No. GSP US$ Total Personnel No. Total Personnel US$ Operating Cost TOTAL REGULAR FUND I TECHNICAL COOPERATION 80 10.009.470 147 7.031.466 194 3.509.195 421 20.550.131 9.791.020 30.468.775 80 10.311.899 147 7.385.149 194 3.658.967 421 21.356.014 9.188.392 30.544.406 A. Office of the Director of Technical Cooperation 1 145.824 1 87.763 1 20.831 3 254.419 80.000 334.419 1 148.106 1 92.073 1 21.853 3 262.031 80.000 342.031 Office of the Director of Technical Cooperation 1 145.824 1 87.763 1 20.831 3 254.419 80.000 334.419 1 148.106 1 92.073 1 21.853 3 262.031 80.000 342.031
B. TECHNICAL CONCENTRATION PROGRAMS 29 3.446.942 15 615.912 9 206.872 53 4.269.725 1.203.000 5.600.349 29 3.636.740 15 645.226 9 211.684 53 4.493.650 1.201.700 5.695.350 1. Innovation for Productivity and Competitiveness Program 11 1.248.763 8 271.397 3 64.749 22 1.584.909 506.000 2.218.533 11 1.400.372 8 283.802 3 66.737 22 1.750.911 504.700 2.255.611 Program Management 2 141.833 - - 1 23.426 3 165.259 16.500 181.759 2 273.803 - - 1 24.575 3 298.378 16.500 314.878
Hemispheric Projects 4 493.433 7 252.935 1 17.947 12 764.315 252.500 1.144.439 4 502.012 7 265.340 1 18.786 12 786.137 251.200 1.037.337
Regional Projects: 5 613.497 1 18.462 1 23.376 7 655.335 237.000 892.335 5 624.558 1 18.462 1 23.376 7 666.396 237.000 903.396
Regional Cooperative Program for the Protection and Modernization of Coffee Cultivation in Central America, Panama and the Dominican Republic - PROMECAFE
1
105.405 - - - - 1 105.405 - 105.405 1 107.539 - - - - 1 107.539 - 107.539
Support to Caribbean Agricultural Research and Development
Institute - CARDI - - - - - - - - 200.000 200.000 - - - - - - - - 200.000 200.000 Cooperative Agricultural Research and Technology Transfer
Program for the Andean Subregion - PROCIANDINO 1 123.613 - - - - 1 123.613 - 123.613 1 125.738 - - - - 1 125.738 - 125.738 Cooperative Program for the Development of Agricultural
Technology in the Southern Cone - PROCISUR 1 126.213 1 18.462 1 23.376 3 168.051 5.000 173.051 1 128.591 1 18.462 1 23.376 3 170.429 5.000 175.429 Cooperative Program on Research and Technology Transfer for the
South American Tropics - PROCITROPICOS 1 136.249 - - - - 1 136.249 - 136.249 1 138.676 - - - - 1 138.676 - 138.676 Cooperative Program in Research and Technology for the Northern
Region - PROCINORTE 1 122.017 - - - - 1 122.017 27.000 149.017 1 124.012 - - - - 1 124.012 27.000 151.012 Support to the System for the Central America Agricultural
Technology Integration System - SICTA -- -- -- -- -- -- -- -- 5.000- 5.000- -- -- -- -- -- -- -- -- 5.000- 5.000 -2. Agricultural Health and Food Safety and Quality Program 6 730.026 3 147.012 2 31.057 11 908.095 284.000 1.192.095 6 743.655 3 154.230 2 32.578 11 930.464 284.000 1.214.464 Program Management 1 138.083 - - 1 18.526 2 156.609 75.500 232.109 1 140.336 - - 1 19.434 2 159.770 75.500 235.270
Hemispheric Projects 5 591.942 3 147.012 1 12.531 9 751.486 128.500 879.986 5 603.319 3 154.230 1 13.145 9 770.694 128.500 899.194
Regional Projects - - - - - - - - 80.000 80.000 - - - - - - - - 80.000 80.000
Support to the Development and Strengthening of National Agricultural Health Systems in the Countries of the Southern Cone to Facilitate International Agricultural Trade - COSAVE
- - - - - - - 20.000 20.000 - - - - - - - - 20.000 20.000
Support to the Permanent Veterinary Committee of the Southern
Cone - CVP - - - - - - - - 60.000 60.000 - - - - - - - - 60.000 60.000
- - - - - - - - - - - - - - - - - - -3. Agribusiness and Commercialization Program 8 976.438 2 104.861 3 96.975 13 1.178.273 320.000 1.498.273 8 992.809 2 110.005 3 97.588 13 1.200.403 320.000 1.520.403
Program Management 1 143.568 - - 2 84.444 3 228.017 182.000 410.017 1 145.737 - - 2 84.444 3 230.185 182.000 412.185
Hemispheric Projects 7 832.869 2 104.861 1 12.531 10 950.256 138.000 1.088.256 7 847.072 2 110.005 1 13.145 10 970.217 138.000 1.108.217
- - - - - - - - - - - - - - - - - - -4. Agriculture, Territories and Rural Well-being Program 4 491.715 2 92.641 1 14.091 7 598.447 93.000 691.447 4 499.903 2 97.189 1 14.781 7 611.873 93.000 704.873
Program Management 1 141.073 - - 1 14.091 2 155.164 7.500 162.664 1 143.306 - - 1 14.781 2 158.087 7.500 165.587
Hemispheric Projects 3 350.642 2 92.641 - - 5 443.284 85.500 528.784 3 356.597 2 97.189 - - 5 453.786 85.500 539.286
C. PROGRAMS FOR CROSS-COORDINATION 2 288.039 3 127.880 2 32.242 7 448.162 67.000 515.162 2 292.743 3 131.483 2 33.082 7 457.308 67.000 524.308 1. Agriculture and Food Security 1 149.956 1 31.288 1 15.111 3 196.355 30.000 226.355 1 152.407 1 31.288 1 15.111 3 198.806 30.000 228.806
2. Agriculture, Natural Resource Management and Climate Change 1 138.083 2 96.592 1 17.132 4 251.807 37.000 288.807 1 140.336 2 100.195 1 17.971 4 258.502 37.000 295.502
D. 4 502.511 5 295.654 1 14.651 10 812.816 160.000 972.816 4 511.488 5 309.776 1 15.369 10 836.633 160.000 996.633 Gerencia del CAESPA - - - - - - - - - - - - - - - - - - -
Hemispheric Projects 4 502.511 5 295.654 1 14.651 10 812.816 100.000 912.816 4 511.488 5 309.776 1 15.369 10 836.633 100.000 936.633
Regional Projects - - - - - - - - 60.000 60.000 - - - - - - - - 60.000 60.000
Support for the Agricultural Policy Coordination Network of the South - REDPA and Support for the Informal Group of the Agricultural Negotiators - GINA SUR
- - - - - - - 60.000 60.000 - - - - - - - - 60.000 60.000
E. TECHNICAL COOPERATION SUPPORT UNITS 5 607.517 13 558.197 5 96.032 23 1.261.746 195.000 1.456.746 5 618.584 13 585.588 5 100.735 23 1.304.906 195.000 1.499.906 1. Promotion and Formulation of Projects 5 607.517 - - - - 5 607.517 40.000 647.517 5 618.584 - - - - 5 618.584 40.000 658.584
Hemispheric Component 2 244.264 - - - - 2 244.264 10.000 254.264 2 248.508 - - - - 2 248.508 10.000 258.508
Regional Component 3 363.252 - - - - 3 363.252 30.000 393.252 3 370.076 - - - - 3 370.076 30.000 400.076
2. Hemispheric Center for Leadership in Agriculture (includes professionals
enrichment program) - - 2 94.461 1 14.091 3 108.552 20.000 128.552 - - 2 99.098 1 14.781 3 113.879 20.000 133.879 3. Inter-American Center for Information and Editorial Production - - 7 278.475 2 39.301 9 317.777 40.000 357.777 - - 7 292.138 2 41.228 9 333.366 40.000 373.366
4. Information and Communication Technologies - - 1 69.064 1 20.113 2 89.177 70.000 159.177 - - 1 72.456 1 21.095 2 93.550 70.000 163.550
5. Center for Communication and Distance Learning - CECADI - - 3 116.197 1 22.527 4 138.724 25.000 163.724 - - 3 121.895 1 23.632 4 145.527 25.000 170.527
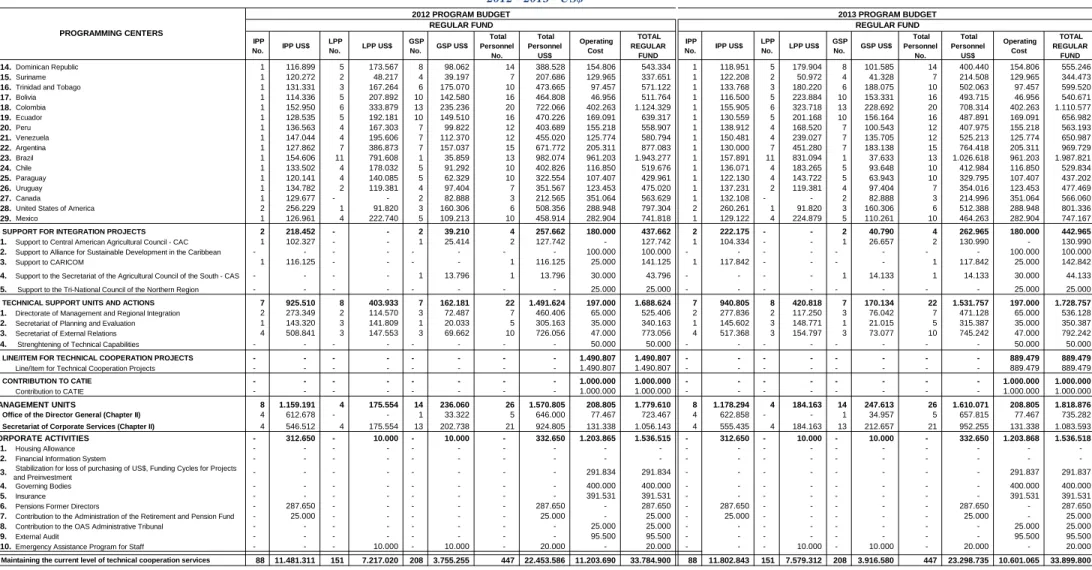
F. 30 3.874.676 102 4.942.127 167 2.937.175 299 11.753.977 5.218.213 16.972.190 30 3.941.258 102 5.200.185 167 3.065.322 299 12.206.764 5.218.213 17.424.977 1. Belize 1 129.888 2 81.566 2 36.149 5 247.602 64.157 311.759 1 131.701 2 85.594 2 37.907 5 255.202 64.157 319.359 2. Costa Rica 1 130.699 4 164.608 5 80.485 10 375.792 79.633 455.425 1 132.842 4 172.687 5 84.427 10 389.957 79.633 469.590 3. Guatemala 1 127.779 2 123.231 4 51.055 7 302.065 133.790 435.855 1 129.940 2 131.623 4 54.218 7 315.781 133.790 449.571 4. Honduras 1 122.774 3 131.741 5 38.792 9 293.307 122.200 415.507 1 124.716 3 136.194 5 40.096 9 301.007 122.200 423.207 5. Nicaragua 1 129.446 3 73.725 3 25.533 7 228.704 185.981 414.685 1 131.428 3 73.254 3 25.371 7 230.053 185.981 416.034 6. Panama 1 131.464 3 135.619 4 70.618 8 337.701 84.397 422.098 1 133.661 3 142.302 4 74.095 8 350.058 84.397 434.455 7. El Salvador 1 129.904 3 119.849 7 85.755 11 335.508 56.595 392.103 1 131.923 3 124.301 7 88.707 11 344.931 56.595 401.526 8. Barbados 1 122.171 2 77.536 5 115.532 8 315.238 103.814 419.052 1 124.160 2 81.328 5 121.144 8 326.632 103.814 430.446 9. ECS 1 120.062 6 344.119 10 252.877 17 717.058 163.973 881.031 1 121.928 6 352.720 10 258.675 17 733.322 163.973 897.295 10.Guyana 1 116.788 2 63.897 9 71.772 12 252.457 123.919 376.376 1 118.494 2 68.472 9 76.608 12 263.574 123.919 387.493 11.Haiti 1 132.361 2 78.938 9 117.003 12 328.301 167.196 495.497 1 134.578 2 79.432 9 117.710 12 331.720 167.196 498.916 12.Jamaica 1 127.852 2 95.798 5 94.824 8 318.473 152.158 470.631 1 129.780 2 104.022 5 102.638 8 336.439 152.158 488.597 13.Bahamas 1 121.800 1 35.052 2 48.605 4 205.457 61.730 267.187 1 124.008 1 35.400 2 49.085 4 208.493 61.730 270.223 NATIONAL COMPONENT OF TECHNICAL COOPERATION: OFFICES IN
THE MEMBER STATES
PROGRAMMING CENTERS
2012 PROGRAM BUDGET 2013 PROGRAM BUDGET
REGULAR FUND
2012 -2013
Overall Budget by Programming Center and Source of Financig
2012 - 2013 - US$
REGULAR FUND
CENTER FOR STRATEGIC ANALYSIS FOR AGRICULTURE
Table No. 4
Program Budget
IPP No. IPP US$
LPP No. LPP US$ GSP No. GSP US$ Total Personnel No. Total Personnel US$ Operating Cost TOTAL REGULAR FUND IPP
No. IPP US$ LPP No. LPP US$ GSP No. GSP US$ Total Personnel No. Total Personnel US$ Operating Cost TOTAL REGULAR FUND PROGRAMMING CENTERS
2012 PROGRAM BUDGET 2013 PROGRAM BUDGET
REGULAR FUND
2012 -2013
Overall Budget by Programming Center and Source of Financig
2012 - 2013 - US$
REGULAR FUND
14.Dominican Republic 1 116.899 5 173.567 8 98.062 14 388.528 154.806 543.334 1 118.951 5 179.904 8 101.585 14 400.440 154.806 555.246
15.Suriname 1 120.272 2 48.217 4 39.197 7 207.686 129.965 337.651 1 122.208 2 50.972 4 41.328 7 214.508 129.965 344.473
16.Trinidad and Tobago 1 131.331 3 167.264 6 175.070 10 473.665 97.457 571.122 1 133.768 3 180.220 6 188.075 10 502.063 97.457 599.520
17.Bolivia 1 114.336 5 207.892 10 142.580 16 464.808 46.956 511.764 1 116.500 5 223.884 10 153.331 16 493.715 46.956 540.671 18.Colombia 1 152.950 6 333.879 13 235.236 20 722.066 402.263 1.124.329 1 155.905 6 323.718 13 228.692 20 708.314 402.263 1.110.577 19.Ecuador 1 128.535 5 192.181 10 149.510 16 470.226 169.091 639.317 1 130.559 5 201.168 10 156.164 16 487.891 169.091 656.982 20.Peru 1 136.563 4 167.303 7 99.822 12 403.689 155.218 558.907 1 138.912 4 168.520 7 100.543 12 407.975 155.218 563.193 21.Venezuela 1 147.044 4 195.606 7 112.370 12 455.020 125.774 580.794 1 150.481 4 239.027 7 135.705 12 525.213 125.774 650.987 22.Argentina 1 127.862 7 386.873 7 157.037 15 671.772 205.311 877.083 1 130.000 7 451.280 7 183.138 15 764.418 205.311 969.729 23.Brazil 1 154.606 11 791.608 1 35.859 13 982.074 961.203 1.943.277 1 157.891 11 831.094 1 37.633 13 1.026.618 961.203 1.987.821 24.Chile 1 133.502 4 178.032 5 91.292 10 402.826 116.850 519.676 1 136.071 4 183.265 5 93.648 10 412.984 116.850 529.834 25.Paraguay 1 120.141 4 140.085 5 62.329 10 322.554 107.407 429.961 1 122.130 4 143.722 5 63.943 10 329.795 107.407 437.202 26.Uruguay 1 134.782 2 119.381 4 97.404 7 351.567 123.453 475.020 1 137.231 2 119.381 4 97.404 7 354.016 123.453 477.469 27.Canada 1 129.677 - - 2 82.888 3 212.565 351.064 563.629 1 132.108 - - 2 82.888 3 214.996 351.064 566.060
28.United States of America 2 256.229 1 91.820 3 160.306 6 508.356 288.948 797.304 2 260.261 1 91.820 3 160.306 6 512.388 288.948 801.336
29.Mexico 1 126.961 4 222.740 5 109.213 10 458.914 282.904 741.818 1 129.122 4 224.879 5 110.261 10 464.263 282.904 747.167
G.SUPPORT FOR INTEGRATION PROJECTS 2 218.452 - - 2 39.210 4 257.662 180.000 437.662 2 222.175 - - 2 40.790 4 262.965 180.000 442.965 1. Support to Central American Agricultural Council - CAC 1 102.327 - - 1 25.414 2 127.742 - 127.742 1 104.334 - - 1 26.657 2 130.990 - 130.990
2. Support to Alliance for Sustainable Development in the Caribbean - - - - - - - - 100.000 100.000 - - - - - - - - 100.000 100.000
3. Support to CARICOM 1 116.125 - - - - 1 116.125 25.000 141.125 1 117.842 - - - - 1 117.842 25.000 142.842
4. Support to the Secretariat of the Agricultural Council of the South - CAS - - - - 1 13.796 1 13.796 30.000 43.796 - - - - 1 14.133 1 14.133 30.000 44.133
5. Support to the Tri-National Council of the Northern Region - - - - - - - - 25.000 25.000 - - - - - - - - 25.000 25.000
H.TECHNICAL SUPPORT UNITS AND ACTIONS 7 925.510 8 403.933 7 162.181 22 1.491.624 197.000 1.688.624 7 940.805 8 420.818 7 170.134 22 1.531.757 197.000 1.728.757 1. Directorate of Management and Regional Integration 2 273.349 2 114.570 3 72.487 7 460.406 65.000 525.406 2 277.836 2 117.250 3 76.042 7 471.128 65.000 536.128
2. Secretariat of Planning and Evaluation 1 143.320 3 141.809 1 20.033 5 305.163 35.000 340.163 1 145.602 3 148.771 1 21.015 5 315.387 35.000 350.387
3. Secretariat of External Relations 4 508.841 3 147.553 3 69.662 10 726.056 47.000 773.056 4 517.368 3 154.797 3 73.077 10 745.242 47.000 792.242
4. Strenghtening of Technical Capabilities - - - - - - - - 50.000 50.000 - - - - - - - - 50.000 50.000
I. LINE/ITEM FOR TECHNICAL COOPERATION PROJECTS - - - - - - - - 1.490.807 1.490.807 - - - - - - - - 889.479 889.479 Line/Item for Technical Cooperation Projects - - - - - - - - 1.490.807 1.490.807 - - - - - - - - 889.479 889.479
J.CONTRIBUTION TO CATIE - - - - - - - - 1.000.000 1.000.000 - - - - - - - - 1.000.000 1.000.000 Contribution to CATIE - - - - - - - - 1.000.000 1.000.000 - - - - - - - - 1.000.000 1.000.000
II. MANAGEMENT UNITS 8 1.159.191 4 175.554 14 236.060 26 1.570.805 208.805 1.779.610 8 1.178.294 4 184.163 14 247.613 26 1.610.071 208.805 1.818.876 A.Office of the Director General (Chapter II) 4 612.678 - - 1 33.322 5 646.000 77.467 723.467 4 622.858 - - 1 34.957 5 657.815 77.467 735.282
- - - - - - - - - - - - - - - - - -
-B.Secretariat of Corporate Services (Chapter II) 4 546.512 4 175.554 13 202.738 21 924.805 131.338 1.056.143 4 555.435 4 184.163 13 212.657 21 952.255 131.338 1.083.593
III. CORPORATE ACTIVITIES - 312.650 - 10.000 - 10.000 - 332.650 1.203.865 1.536.515 - 312.650 - 10.000 - 10.000 - 332.650 1.203.868 1.536.518 1. Housing Allowance - - - - - - - - - - - - - - - - - - -
-2. Financial Information System - - - - - - - - - - - - - - - - - - -
-3. Stabilization for loss of purchasing of US$, Funding Cycles for Projects
and Preinvestment - - - - - - - - 291.834 291.834 - - - - - - - - 291.837 291.837 4. Governing Bodies - - - - - - - - 400.000 400.000 - - - - - - - - 400.000 400.000
5. Insurance - - - - - - - - 391.531 391.531 - - - - - - - - 391.531 391.531
6. Pensions Former Directors - 287.650 - - - - - 287.650 - 287.650 - 287.650 - - - - - 287.650 - 287.650
7. Contribution to the Administration of the Retirement and Pension Fund - 25.000 - - - - - 25.000 - 25.000 - 25.000 - - - - - 25.000 - 25.000
8. Contribution to the OAS Administrative Tribunal - - - - - - - - 25.000 25.000 - - - - - - - - 25.000 25.000
9. External Audit - - - - - - - - 95.500 95.500 - - - - - - - - 95.500 95.500
10. Emergency Assistance Program for Staff - - - 10.000 - 10.000 - 20.000 - 20.000 - - - 10.000 - 10.000 - 20.000 - 20.000
88
11.481.311 151 7.217.020 208 3.755.255 447 22.453.586 11.203.690 33.784.900 88 11.802.843 151 7.579.312 208 3.916.580 447 23.298.735 10.601.065 33.899.800
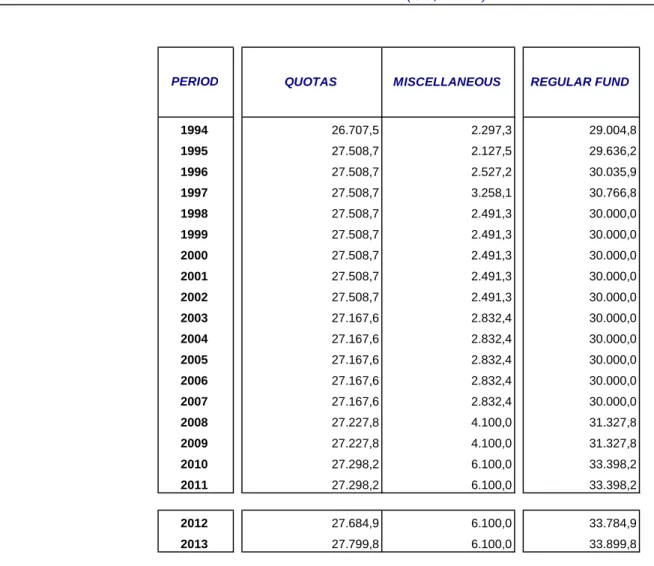
Total: Maintaining the current level of technical cooperation services
1994-2011 and 2012-2013 (US$ x 000)
1994
26.707,5
2.297,3
29.004,8
1995
27.508,7
2.127,5
29.636,2
1996
27.508,7
2.527,2
30.035,9
1997
27.508,7
3.258,1
30.766,8
1998
27.508,7
2.491,3
30.000,0
1999
27.508,7
2.491,3
30.000,0
2000
27.508,7
2.491,3
30.000,0
2001
27.508,7
2.491,3
30.000,0
2002
27.508,7
2.491,3
30.000,0
2003
27.167,6
2.832,4
30.000,0
2004
27.167,6
2.832,4
30.000,0
2005
27.167,6
2.832,4
30.000,0
2006
27.167,6
2.832,4
30.000,0
2007
27.167,6
2.832,4
30.000,0
2008
27.227,8
4.100,0
31.327,8
2009
27.227,8
4.100,0
31.327,8
2010
27.298,2
6.100,0
33.398,2
2011
27.298,2
6.100,0
33.398,2
2012
27.684,9
6.100,0
33.784,9
2013
27.799,8
6.100,0
33.899,8
Note: The Cuban quota was excluded from the quota resources as of 2003.
PERIOD
QUOTAS
MISCELLANEOUS
REGULAR FUND
Table No. 5
2012-2013
Program Budget
Evolution of the Regular Fund in Nominal Values
PP-C-05
Table No. 6
US$
US$
US$
CHAPTER I: Direct Technical Cooperation Services
23.996.054
5.668.560
29.664.614
88,8%
24.357.534
5.801.991
30.159.525
89,3%
24.620.168
5.801.991
30.422.159
89,7%
Innovation for Productivity and Competitiveness Program 7.435.100 1.297.230 8.732.330 29,4% 7.606.892 1.169.356 8.776.247 29,1% 7.693.518 1.166.343 8.859.861 29,1%
Agricultural Health and Food Safety and Quality Program 5.576.751 1.545.247 7.121.998 24,0% 5.868.501 1.715.022 7.583.523 25,1% 5.882.612 1.700.748 7.583.360 24,9%
Agribusiness and Commercialization Program 5.457.230 1.595.900 7.053.130 23,8% 5.790.576 1.670.112 7.460.688 24,7% 5.863.421 1.682.693 7.546.114 24,8%
Agriculture, Territories and Rural Well-being Program 5.526.973 1.230.183 6.757.156 22,8% 5.091.565 1.247.502 6.339.067 21,0% 5.180.617 1.252.207 6.432.824 21,1%
CHAPTER II: Management Costs
1.631.376
77.783
1.709.159
5,1%
1.702.312
67.738
1.770.050
5,2%
1.741.578
67.738
1.809.316
5,3%
Office of the Director General 662.870 20.000 682.870 40,0% 702.407 17.500 719.907 40,7% 714.222 17.500 731.722 40,4%
Secretariat of Corporate Services 968.506 57.783 1.026.289 60,0% 999.905 50.238 1.050.143 59,3% 1.027.355 50.238 1.077.593 59,6%
CHAPTER III: General Cost and Provisions
1.274.952
50.000
1.324.952
4,0%
1.224.681
20.000
1.244.681
3,7%
1.224.681
20.000
1.244.681
3,7%
Governing Bodies 400.000 0 400.000 30,2% 400.000 0 400.000 32,1% 400.000 0 400.000 32,1%
Insurance 441.802 0 441.802 33,3% 391.531 0 391.531 31,5% 391.531 0 391.531 31,5%
Pensions Former Directors 287.650 0 287.650 21,7% 287.650 0 287.650 23,1% 287.650 0 287.650 23,1%
Contribution to the OAS Administrative Tribunal 25.000 0 25.000 1,9% 25.000 0 25.000 2,0% 25.000 0 25.000 2,0%
Contribution to the Administration of the Retirement and Pension Fund 25.000 0 25.000 1,9% 25.000 0 25.000 2,0% 25.000 0 25.000 2,0%
External Audit 95.500 0 95.500 7,2% 95.500 0 95.500 7,7% 95.500 0 95.500 7,7%
Emergency Assistance Program for Staff 0 50.000 50.000 3,8% 0 20.000 20.000 1,6% 0 20.000 20.000 1,6%
CHAPTER IV: Renewal of Infrastructure and Equipment
395.857
303.657
699.514
2,1%
400.373
210.271
610.644
1,8%
213.373
210.271
423.644
1,2%
TOTAL
27.298.239
6.100.000
33.398.239
100,0%
27.684.900
6.100.000
33.784.900
100,0%
27.799.800
6.100.000
33.899.800
100,0%
PP-C-6 Table No. 6: Page 1 of 1
REGULAR FUND
QUOTAS
MISC.
REGULAR FUND
%
%
%
QUOTAS
MISC.
REGULAR FUND
QUOTAS
MISC.
CHAPTER
2011
2012
2013
2012 - 2013
Program Budget
Allocation of the Regular Fund by Chapter
Table No. 7
2012 - 2013
Program Budget
US$ % US$ % Class 2012 2013 Class 2012 2013
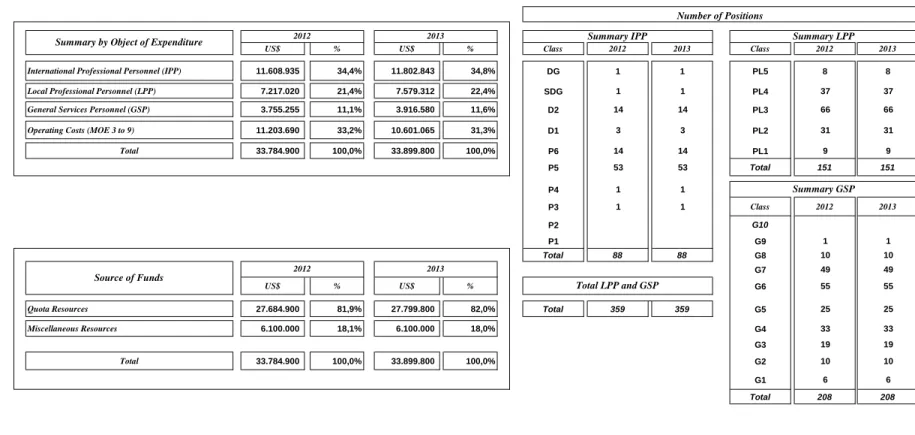
International Professional Personnel (IPP) 11.608.935 34,4% 11.802.843 34,8% DG 1 1 PL5 8 8
Local Professional Personnel (LPP) 7.217.020 21,4% 7.579.312 22,4% SDG 1 1 PL4 37 37
General Services Personnel (GSP) 3.755.255 11,1% 3.916.580 11,6% D2 14 14 PL3 66 66
Operating Costs (MOE 3 to 9) 11.203.690 33,2% 10.601.065 31,3% D1 3 3 PL2 31 31
Total 33.784.900 100,0% 33.899.800 100,0% P6 14 14 PL1 9 9 P5 53 53 Total 151 151 P4 1 1 P3 1 1 Class 2012 2013 P2 G10 P1 G9 1 1 Total 88 88 G8 10 10 G7 49 49 US$ % US$ % G6 55 55
Quota Resources 27.684.900 81,9% 27.799.800 82,0% Total 359 359 G5 25 25
Miscellaneous Resources 6.100.000 18,1% 6.100.000 18,0% G4 33 33
G3 19 19
Total 33.784.900 100,0% 33.899.800 100,0% G2 10 10
G1 6 6
Total 208 208
PP-C-07 Table No. 7: Page 1 of 1
Source of Funds
2012 2013Total LPP and GSP
Summary GSP
Overall Allocation of the Regular Fund: Quotas and Miscellaneous Income
(US$ and Number of Positions)
Number of Positions
Table 8
Program Budget
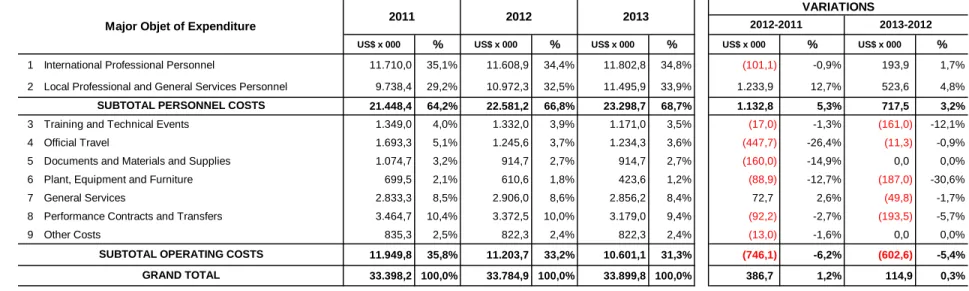
1 International Professional Personnel
11.608,9 100,0% 11.802,8 100,0%Salaries
5.224,0 45,0% 5.311,3 45,0%Benefits and Other Costs of International Personnel
6.384,9 55,0% 6.491,6 55,0%2 Local Professional and General Services Personnel
10.972,3 100,0% 11.495,9 100,0%Salaries
7.680,6 70,0% 8.047,1 70,0%Benefits and Other Costs of National Personnel
3.291,7 30,0% 3.448,8 30,0%3 Training and Technical Events
1.332,0 100,0% 1.171,0 100,0%Training for Personnel
159,8 12,0% 140,5 12,0%Technical Events
1.145,5 86,0% 1.007,1 86,0%Didactic Material
26,6 2,0% 23,4 2,0%4 Official Travel
1.245,6 100,0% 1.234,3 100,0%International Per Diems
660,2 53,0% 654,2 53,0%International Transportation
448,4 36,0% 444,4 36,0%National Per Diems
99,6 8,0% 98,7 8,0%National Transportation
37,4 3,0% 37,0 3,0%5 Documents and Materials and Supplies
914,7 100,0% 914,7 100,0%Publications and Documents
448,2 49,0% 448,2 49,0%Office Materials and Supplies
429,9 47,0% 429,9 47,0%Materials for IICA Projects
36,6 4,0% 36,6 4,0%6 Plant, Equipment and Furniture
610,6 100,0% 423,6 100,0%Improvements to Land, Buildings and Immoveable Assets
79,4 13,0% 55,1 13,0%Acquisition of Equipment and Furnishings
384,7 63,0% 266,9 63,0%Acquisition of Vehicles
146,6 24,0% 101,7 24,0%7 General Services
2.906,0 100,0% 2.856,2 100,0%Communications
697,4 24,0% 685,5 24,0%Public Services
203,4 7,0% 199,9 7,0%Repairs and Maintenance
813,7 28,0% 799,7 28,0%Fuel
145,3 5,0% 142,8 5,0%Rents
900,9 31,0% 885,4 31,0%Guard and Janitorial Contracts
145,3 5,0% 142,8 5,0%8 Performance Contracts and Transfers
3.372,5 100,0% 3.179,0 100,0%International Technical Consulting Services
303,5 9,0% 286,1 9,0%National Technical Consulting Services
1.349,0 40,0% 1.271,6 40,0%Support Services
779,0 23,1% 734,3 23,1%External Auditing
97,8 2,9% 92,2 2,9%Transfers to Third Parties
843,1 25,0% 794,7 25,0%9 Other Costs
822,3 100,0% 822,3 100,0%Insurance
592,0 72,0% 592,0 72,0%Official Hospitality
82,2 10,0% 82,2 10,0%Ceremonies and Awards
24,7 3,0% 24,7 3,0%Financial Expenses
106,9 13,0% 106,9 13,0%Others
16,4 2,0% 16,4 2,0%33.784,9 33.899,8
Breakdown of Each Major Object of Expenditure
2012
2013
TOTAL
2012 - 2013
Structure of the Major Objects of Expenditure - Regular Fund
(US$ x 000 and %)
Table No. 9
US$ x 000