Science Arts & Métiers (SAM)
is an open access repository that collects the work of Arts et Métiers Institute of Technology researchers and makes it freely available over the web where possible.
This is an author-deposited version published in: https://sam.ensam.eu Handle ID: .http://hdl.handle.net/10985/9763
To cite this version :
Yasmine BOUMENIR, Abdelmajid KADRI, Nadège SUIRE, Corinne MURY, Evelyne KLINGER -When sighted people are in the skin of visually impaired ones: perception and actions in virtual reality situation - In: Proceedings of the 9th International Conference on Disability, Virtual Reality & Associated Technologies (ICDVRAT), France, 2012-09-10 - Proceedings of the 9th Intl Conf. Disability, Virtual Reality & Assoc. Tech - 2012
When sighted people are in the skin of visually impaired ones:
perception and actions in virtual reality situation
Y Boumenir1, A Kadri1, N Suire2, C Mury2, E Klinger1
1
Arts et Métiers ParisTech – LAMPA EA1427, Angers-Laval, FRANCE
2
Institut pour malvoyants des Hauts Thébaudières, Vertou, FRANCE
yasmine.boumenir@ensam.eu, abdelmajid.kadri@ensam.eu, suire.n@thebaudieres.org, relaisortho@thebaudieres.org, evelyne.klinger@ensam.eu
1
www.hit-rv.fr, 2www.thebaudieres.org
ABSTRACT
Most of us do not know how a visually impaired person perceives and acts within the environment in everyday life. In this context, an experimental study was conducted using a virtual reality simulation in which sighted people were immersed in low vision situations: Blurred vision, Tunnel vision, central Scotoma. After a brief familiarization procedure with a virtual reality tool called “SENSIVISE” which includes a virtual apartment, 24 adults had to explore two rooms through low vision simulation or full vision (as control group) to identify their location, and then were instructed to find particular targets. Perception and actions performances were measured in terms of time needed to answer questions related to visual perception, and distances between the participants’ body and the screen. The results show that low vision simulation impairs perception among sighted people. It was expressed by a statistically significant effect of lower times needed to execute tasks compared to the control condition. Consequently, the sighted individuals realized how it is difficult to perceive and move when vision is limited.
1. INTRODUCTION
According to the World Health Organization, visual impairment affects nearly 246 million worldwide, including 1.7 million in France with congenital or late visual deficiency (Sander et al, 2005). With an aging population, the number of visually impaired people is growing rapidly due to multiple visual affections such as age related macular degeneration (AMD). AMD often results in vision loss to the central 15–20 deg. of the visual field (i.e. central Scotoma), and frequently afflicts both eyes (Cheung & Legge, 2005). Peripheral field loss (Tunnel vision) is a severe constriction of the peripheral field leaving only the central 5-10 deg. of the field functional. These forms can present varying degrees, in which the available visual field (central vs. peripheral visual-field loss), residual visual acuity, level of contrast sensitivity are all factors that play a role in influencing cognitive performance (Merabet et al., 2005) and behavior in daily life. For example, AMD is associated with decreased quality of life (Brown et al., 2002) and depression (Rovner & Casten, 2002).
When visually impaired people cannot control their daily interactions with the surrounding world, rupture with the family, social and professional networks, will operate. If we know that visually impaired persons are unable to watch the television from a normal viewing distance due to their Blurred vision, the most important information about their difficulties and needs are still misunderstood. And therefore, providing them assistance represents a challenge to family or sighted individuals who may lack knowledge about their relative’s visual impairment and the impact of visual acuity and central or peripheral vision on functional abilities. But this lack of knowledge leads the family members to overprotection (Ponchillia, 1984).
Otherwise, when family members include vision impairment, the independence feeling of their visually impaired relatives is enhanced (Cimarolli and Boerner, 2005). In addition, studies on teachers’ attitudes towards students with disabilities showed a significant impact on the educational experience (Kenny and Shevlin, 2004).
The use of Virtual Reality (VR) for rehabilitation and learning in the public health domain had already given positive results (Rizzo et al, 1998; Klinger et al, 2010), notably in the field of visual impairment (Lahav, 2006; Sanchez and Zuniga, 2006). VR has also been used to enhance awareness of educators or caregivers about difficulties met by people with disabilities in daily life (Pivik et al, 2002; Klinger et al, 2007; Passig, 2011).
In this global context we developed the SENSIVISE VR-based tool that proposes the simulation of three graduated visual impairments (central Scotoma, Blurred and Tunnel vision) whose levels have been defined with professionals of low vision at the Institut des Hauts Thébaudières. It allows sighted users to navigate and interact within a virtual environment (VE) that includes an apartment with several rooms, and to experiment the difficulties of visually impaired people during activities of daily life. SENSIVISE tool proposes adaptations of the VE in order to facilitate the understanding of the environment and of the tasks.
The objectives of this study are to examine: 1) the impact of visual impairment simulation on perceptions in a VE; 2) the relevance of the adaptations of the VE to improve the perceptions.
2. METHOD
2.1 Participants
This study involved 24 sighted participants (12 M and 12F); all volunteers, recruited by a call for volunteers posted to schools and university library of Laval, France. Their ages ranged between 18 and 74 years (35 ± 13.8).
2.2 Material
SENSIVISE is a VR-based application which was designed to inform and raise awareness about low vision. It simulates the entrance of a building and an apartment with a living room, a bedroom, a bathroom and a kitchen with a laundry room. All the rooms are equipped with 3D objects and furniture, as in a real apartment. Thanks to shaders (i.e. a computer program used to calculate rendering effects on graphics hardware), SENSIVISE proposes the simulation of three visual impairments (scotoma, blurred and tubular vision) which were chosen by the professionals of the Institute of Hauts Thébaudières according to their expertise in low vision. They also defined three levels of difficulty for each impairment: increasing the blurred aspect, decreasing the size of the tunnel, increasing the size of the scotoma (Figure 1). In order to improve perception of places and objects, SENSIVISE also proposes environmental adaptation options such as contrast (e.g. between the walls and the bath), light (e.g. dim light in the bedroom), objects choice (wrong versus right alarm clock in the bedroom) (Figure 2). Finally, SENSIVISE proposes games such as finding items and putting them in a correct order. During this VR-based game, participants are asked to collect pair of objects. The purpose is to show that putting the objects at the right place is very important for visually impaired people, and that looking for objects can become a difficult activity.
When participants interact with SENSIVISE, at first they choose the type and the level of low vision simulation thanks to a menu (Figure 1a). Then they walk in the virtual world using the keyboard and the mouse, and they interact with the objects using the mouse.
a) b)
Figure 1: A snapshot of the environment. a) allows to choose form and intensity of low vision displayed (on the left); and concurrently inform about the selected form (on the right); b) results of the three simulations; Control condition and Blurred vision on the left and right top
Figure 2: A snapshot of rooms before and after adaptations; light adjustment in the bedroom; right top; and contrast in the bathroom, middle; alarm clock adaptation, right down.
2.3 Experimental Design
In order to reach our objectives, four groups were tested corresponding to the control and the three low vision simulated conditions: blurred vision, central scotoma and tunnel vision. Two-rooms, “the bedroom” and “the bathroom”, were chosen for the tests according to a predefined scenario. Participants had to follow three steps: 1) a pre-test, 2) a test and 3) a post-test. In the first step, participants had to answer to a brief questionnaire (Q1) about how they rated themselves as users of computer (keyboard and mouse) according to the following definitions: “beginner”, “expert” and “intermediate”; and if they had prior knowledge about low vision. Then they had to carry out a familiarization procedure with the tool, without any low vision simulation. The testing phase involved the execution of the scenario in each room, in one of the low vision conditions, and was followed by a short questionnaire (Q2). The experiment was completed by a third questionnaire (Q3 post-test) related to self-assessment on the use of the VR-based tool “SENSIVISE” (See Table 1)
Table 1: The experimental design.
Q 1, 2, 3: Questionnaire ; P: Participant ; LV 1, 2 : Low vision condition
2.4 Procedure
SENSIVISE's application was displayed on a 22 inches screen which was located at 35 cm from the edge of the desk. The participants sat on a chair in front of the screen, with a mouse and a keyboard on the desk. The evaluator sat behind the participant with a keyboard and a mouse also connected to the application in order to select conditions and adaptations during the test. In addition, the evaluator used a laptop in order to fill out an online questionnaire created for this experiment.
18 participants out of 24 experiment each of the three visually impaired conditions in the bedroom and in the bathroom respectively. Tests were alternated between the participants in order to obtain at the end of the experiment six individuals in each condition: blurred, central scotoma and tunnel vision. The six remaining
participants followed the same scenario but in a control condition without any simulation of visual impairment. The test took one hour and each participant was tested individually and only once.
The experiment started with the familiarization step (pre-test) at the first floor of the VE in order to get familiar with the use of the keyboard to navigate and of the mouse to look up, down and around (i.e. head movements). Then the test step took place in the apartment, at the entrance of each room (bedroom and bathroom) in a visual impaired condition. The participant had to follow the predefined scenario which was enunciated by the evaluator: visual exploration followed by exploration through action while moving inside the room. During the unfolding of the test, participants had to answer to some questions.
In the visual exploration step, participants had 15 seconds to tell in which room they were (Question 1) by exploring the space with head movements. If beyond that time participants did not give a right answer, the evaluator activated adaptations: lighting at first, substituted by contrast if the answer was always bad, and finally both together.
In the exploration through action step, participants had 60 seconds to perform the requested task while moving inside the room. In the bedroom, participants had to find the alarm clock that was on a shelf near the bed (Question 2). Once in front of it, they were asked to read the time (Question 3). If participants were unable to read the time displayed on the alarm clock, two adaptations were tested: lighting and then another type of alarm clock. In the bathroom, participants had to navigate to reach the tablet near the sink and to list all the objects that they perceived on it (Question 2). Adaptations were activated when participants were unable to see all the objects: color contrasts. Then a game was performed, without time-limitation or adaptations, in which the participants had to put in order identical objects by clicking on the objects with the mouse (Question 3).
At the end of each tested room, participants were asked to answer the post-test questionnaire (Q3) about how they perceived the VE, how they interacted, their feeling about low vision and more generally about SENSIVISE.
2.5 Data Analysis
Visual and interacting explorations were performed to assess: 1) the impact of visual impairment simulation on perception; 2) the relevance of the adaptations on perception improvement.
The impact of visual impairment simulation on perception was determined by comparing qualitative and quantitative parameters between low vision conditions and control condition. These parameters include: responses to questions, time of response measured with a chronometer, or behavior assessed by the distance between the participant and the screen. Except for the game, response time was collected only for the good answers (less than or equal to 15 seconds or 60 seconds respectively for the visual exploration and for exploration through action). The time of response was the time elapsed between the end of the formulated question by the assessor and the response made by the participant. The statistical analyses were done using a non-parametric method of Kruskal-Wallis and the significant difference between conditions was analyzed using the Wilcoxon test.
3. RESULTS
Results presented in this section were collected among 24 subjects, 6 in each tested condition (control, blurred vision, tunnel vision, central scotoma). Data from the two sessions for each low vision condition were compared to the control condition. As visual exploration is common to both tested-rooms, data were analyzed in the same part. Data from exploration through action are presented separately for the bedroom and for the bathroom.
According to Questionnaire 1, 75% of the participants consider themselves as expert users of computer (keyboard and mouse) and 50% declared to be familiar with low vision in a general way.
3.1 Impact of Visual Impairment Simulation on Perception
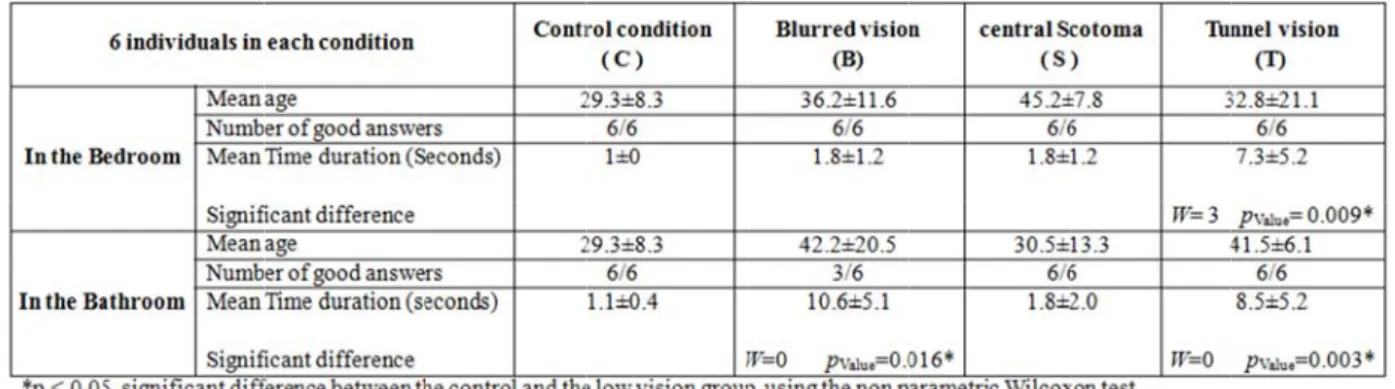
3.1.1 Visual exploration. Individual performance was documented by the number of good answers and the
times needed by the participants to answer questions related to the visual exploration session. These data were recorded and analyzed for each study group (Table 2). In the bedroom, all participants of the four groups were able to give the right answer. Participants from the tunnel vision group were the longest to answer. In the bathroom, only three subjects of the blurred vision group gave good answers against 6 in the other groups.
Th reveal reveal in the vision Th Comp condit from t 3.1.2 A – In select five p signif and th to rea In clock after 6 low v time d he Kruskal W led a statistica led that this st e bedroom (W n (W= 0, p Valu he distance b pared to the pa
tion were clos the control an
Table 2: M
data for par
Figure 3: M Blurred visi Exploration T n the bedroom ted conditions participants fro ficant differen he central scot ach the alarm c n order to perf belonging to 60 seconds. A vision conditio displayed on t
allis test comp ally significan tatistically sig W= 3, p Value= ue= 0.003) grou between the p articipants fro ser to the scre nd blurred visi Means, Standar rticipants in lo Mean distanc on ( B ), Cent Through Actio m. Participants . All participa om the central nces between p toma groups. P clock compare
form the next the central sc All participants on, only two p the alarm cloc
parisons betw nt effects (p Va gnificant effec
0.009) and p ups in the bath participant and m the control een. The Wilc on conditions
rd deviations, ow vision simu
ces and standa tral scotoma (
on.
were asked to ants from cont l scotoma and participants fro Participants fr ed to the other t step of the cotoma and th s were asked t participants, b k.
ween the contro Value = 0.012). ct concern only participants fro hroom (See ta d the screen l condition, pa coxon test reve s (W=33, p Valu
and test of W
ulated conditio
ard deviations ( S ), Tunnel vi
o reach the ala trol and blurre d tunnel vision om the contro from the blurre
r groups. procedure, th he tunnel visio to read the tim belonging to th ol condition w A post-hoc an y the participa om the blurre able 2).
was also ana articipants from
ealed a signifi ue= 0.013).
Wilcoxon valu ons and contr
s for each gro ision ( T )
arm clock by w ed vision cond n groups (Tabl ol and the blur ed vision and he two particip on groups we me on the clock he tunnel visi with each of th nalysis realize ants from the ed (W= 0, p V alyzed (Figur m blurred visi ficant differenc es (w and p) rols oup: Control walking throu dition reach th le 3). The Wil rred groups an central scotom pants who fai re placed in f k. The results ion group, we he low vision c ed by the Wilc tunnel vision Value= 0.016) a re 3, in the b ion and centra nce between pa
on the record
condition ( C
ugh the VE in he alarm clock lcoxon test rev nd between the ma group were ailed to reach front of the al s showed that, ere able to tell
conditions coxon test group (T) and tunnel bathroom). al scotoma articipants ded C ), one of the k, against vealed e control e longest the alarm larm clock in case of l the exact
B – In th perceived participan control gr 0.002*). 3.1.3 The by clickin vision con The W table 5). A participan The distri Ta W Fi he bathroom. d. Participants nts from the l roup and each
Table 3: Nu e game. Durin ng on the obje nditions were Wilcoxon test All participan nts from cont ibution of thes able 5: Mean Wilcoxon value igure 4: The Participants s had to list ni low vision gr h low vision g umber of good Table 4: Me ng this step in ects with the e compared to gives signific nts from the th trol group, esp
se times durat
time and sta s
game perfor
were asked to ine objects, pe roups was abl group revealed d answers and ean number of the bathroom mouse. Data the control co cant difference hree low vision pecially partic tion is shown andard deviati rmance: Distr o reach the ta erceived by th le to list them d a statistical s d Mean times f items found a m, participants from the gam ondition. es between the n groups took cipants from on figure 4. ion, recorded ribution of tim
ablet near the he control grou m in full (Tab significant wi (seconds) with and standard had to put in me performed e control grou k more time to the blurred g
d from the gam
me duration t e sink to list up. Results sh ble 4). Compa th Wilcoxon t h the Wilcoxon deviation. order 5 pairs by each partic up and each lo
find and arran roup and from
me in each te
to answer in
all the object how that none arisons betwe test (W= 36, p n values. s of identical o cipant from th ow vision grou ange the objec
m the tunnel est condition. each group: ts they e of the een the p Value= objects he low up (see ts than group.
3.2 Relevance of Adaptations
In order to attempt to improve perception, adaptations of the VE were proposed to the participants who failed to give good answers. The adaptations were introduced one by one and then combined. During visual exploration, reducing lighting was sufficient to help the three participants from the blurred group who failed to give good answers when they had to recognize the bathroom.
During exploration through action,
In the bedroom, with a dim light or a digital clock none participant was able to read the time in blurred vision or central scotoma. Contrariwise, 3 out of the 4 participants who were not able to read the time, succeeded after changing the clock. And then, the combination of the two adaptations helped the only person who failed in the group to read time.
In the bathroom, adding contrast helped two participants from the blurred vision group and one participant from each central scotoma and tunnel vision groups to find all items. In addition, light and contrast together allowed two participants from the tunnel vision group to list all the items.
3.3 Perception and Navigation in SENSIVISE
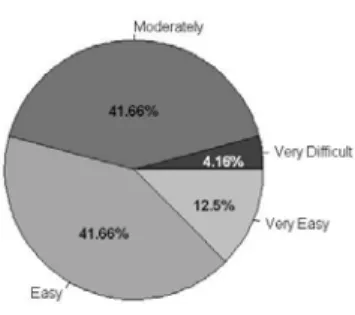
During the post-test, each participant had to evaluate in a graduate scale how he perceived the VE for each low vision condition. Except for the control condition group, all participants reported a very bad perception and this in the two rooms tested. And finally, in another graduate scale how they rated the navigation in SENSIVISE application; results are proposed in Figure 5.
Figure 5: Usability assessment of the SENSIVISE application for all participants
4. DISCUSSION
According to the study results, perceiving a VE in low vision condition is not easy. Although almost all participants answered well the questions about visual exploration, times were longer for participants in the low vision conditions compared to control condition. It seems that in the case of a global view, when vision is blurred or when the peripheral visual field is limited, as in a tunnel vision, the observation times are longer and participants tend to be closer to the screen in particular with blurred vision. Moreover, when the task requires vision for detail, times are longer with central scotoma vision compared to the other groups. Studies in this direction have shown that persons with central field loss have reduced acuity and contrast sensitivity, and read quite slowly (Legge et al., 1992).
The questionnaires chosen for this test were related to the SENSIVISE environment but also to the real needs of people with low vision in terms of lighting and contrast. Indeed, contrast sensitivity is crucial to many human visual activities including reading, object recognition and mobility. Studies have shown that reductions in contrast sensitivity (rather than visual acuity) are related to instability and falls in the elderly (Turano et al, 1994; Lord et al, 1991, 2000; Buckley et al, 2005). In addition, contrast adaptation studies using both behavioral and neurophysiological methods support the view that the adaptation produces a functional benefit by enhancing contrast sensitivity around the adapting contrast (Gardner et al., 2005).
The adjustments of light and contrast proposed in our study helped some participants from low vision conditions to give good answers. Moreover, the digital clock as presented here in SENSIVISE only helped people with tunnel vision. Many models of alarm clock exist in SENSIVISE, but to compare our results with another experiment that is underway, this alarm clock was chosen.
At the end of the test, all participants stated that they had a great difficulty to distinguish shapes and objects and thus to reach the requested objectives, and felt lucky to see much better without low vision simulation. For the usability aspect of SENSIVISE, 4.16% of those tested reported having trouble using the keyboard and mouse to navigate in the VE.
As a result, the impact of the visual impairment of perceptions in a VE was achieved. However, the relevance of adaptations was not huge in this test and is currently tested in the context of visual impairment with visually impaired persons.
Information collected through SENSIVISE about how low vision can affect our cognitive abilities and our reaction times may help the sighted people to adopt a best attitude towards the visually impaired persons. Our future aim is to provide the SENSIVISE application for educational institutions and free internet access to inform about low vision and therefore increase the well being of all.
5. CONCLUSION
SENSIVISE is a VR-based application that was created to raise awareness about low vision, by providing information on some forms of visual impairment and on their impact on everyday tasks. Through this study, all participants understood the effort of perception and the difficulties of action met when their vision was impaired. This study allowed us also to know the limits of the proposed adaptations of the VE for certain forms of visual impairment simulation. In future work, we will try to find out if the behavior of visually impaired persons interacting with SENSIVISE (in normal vision condition) is similar to that of sighted people interacting in impaired vision condition.
Acknowledgements: Authors would like to thank Dassault Systèmes for financial support (Passion for
Innovation Programme), ENOZONE and EMISSIVE for development support, and all volunteers who gave their consent to carry out the experiments presented in this study.
6. REFERENCES
M M Brown, G C Brown, S Sharma, J Landy, J Bakal (2002), Quality of life with visual acuity loss from diabetic retinopathy and age-related macular degeneration, Archives of Ophthalmology, 120, 4, pp. 481– 484.
S H Cheung, G E Legge (2005) Functional and cortical adaptations to central vision loss, VisNeurosci, 22, 2, pp. 187-201.
V R Cimarolli, K Boerner (2005), Social support and well-being in adults who are visually impaired. Journal
of Visual Impairment & Blindness, 99, 9, pp. 521-534.
J L Gardner, P Sun, R A Waggoner, K Ueno, K Tanaka, K Cheng (2005), Contrast adaptation and representation in human early visual cortex. Neuron, 47, 4, pp. 607–620.
M Kenny, M Shevlin (2004), Diversity at school: Disability, In Diversity at school (A Lodge, K Lynch, Eds), Dublin, pp. 77-91.
E Klinger, E Geslin, A Shirai, S Richir (2007), HandiSim: A VR-based manual wheelchair with visual feedback and physical simulation, Proceedings Cybertherapy 12, Washington, DC, pp. 96.
E Klinger, P L Weiss, P A Joseph (2010), Virtual reality for learning and rehabilitation, In Rethinking
physical and rehabilitation medicine (J P Didier, E Bigand, Eds), Springer, Paris, pp. 203-221.
O Lahav (2006), Using virtual environment to improve spatial perception by people who are blind,
Cyberpsychol Behav, 9, 2, pp. 174-177.
G A Legge, J A. Ross, L M. Isenberg, J M. LoMoy (1992), Psychophysics of Reading: Clinical Predictors of Low-Vision Reading Speed, Investigative Ophthalmology and Visual Science, 33, 3, pp. 677–687. S R Lord, R D Clark, I W Webster (1991), Visual acuity and contrast sensitivity in relation to falls in an
elderly population, Age Ageing, 20, 3, pp. 175–181.
S R Lord, H B Menz (2000), Visual contributions to postural stability in older adults, Gerontology, 46, 6, pp. 306–310.
L B Merabet, J F Rizzo, A Amedi, D C Somers, A Pascual-Leone (2005), What blindness can tell us about seeing again: Merging neuroplasticity and neuroprostheses, Nat Rev Neurosci., 6, 1, pp. 71-77.
D Passig (2011), The impact of Virtual Reality on educators’ awareness of the cognitive experiences of a dyslectic student, Teachers College Record, 113, 1, pp. 181-204.
J Pivik, J McComas, I Macfarlane, M Laflamme (2002), Using virtual reality to teach disability awareness, J
Educational Computing Research, 26, 2, pp. 203-218.
P E Ponchillia (1984), Family services: Role of the center-based teaching professional, Journal of Visual
Impairment & Blindness, 78, 3, pp. 97-100.
A A Rizzo, J G Buckwalter, U Neumann, C Kesselman, M Thiebaux (1998), Basic issues in the application of virtual reality for the assessment and rehabilitation of cognitive impairments and functional disabilities,
Cyberpsychol Behav, 1, 1, pp. 59-78.
B W Rovner, R J Casten (2002), Activity loss and depression in age-related macular degeneration, American
Journal of Geriatric Psychiatry, 10, 3, pp. 305–310.
J Sanchez, M Zuniga (2006), Evaluating the interaction of blind learners with audio-based virtual environments, Annual Review of CyberTherapy and Telemedicine Virtual Healing: Designing Reality, 4, pp. 167-173.
M S Sander, M C Bournot, F Lelièvre, A Tallec, C Chambet, C Corbé, P Gilbert, C Peretti, X Zanlonghi (2005), Les personnes ayant un handicap visuel : Les apports de l'enquête Handicaps - Incapacités - Dépendance, Etudes et Résultats, DREES, 416, pp. 1-12.
K Turano, G S Rubin, S J Herdman, E Chee, L P Fried (1994), Visual stabilization of posture in the elderly: Fallers vs. nonfallers, Optom Vis Sci., 71, 12, pp. 761–769.