Science Arts & Métiers (SAM)
is an open access repository that collects the work of Arts et Métiers Institute of
Technology researchers and makes it freely available over the web where possible.
This is an author-deposited version published in:
https://sam.ensam.eu
Handle ID: .
http://hdl.handle.net/10985/10104
To cite this version :
Feliks BEZATI, Daniel FROELICH, Valérie MASSARDIER, Elisabeth MARIS - Addition of X-ray
fluorescent tracers into polymers, new technology for automatic sorting of plastics : proposal for
selecting some relevant tracers Resources, Conservation and Recycling n°55, p.12141221
-2011
Any correspondence concerning this service should be sent to the repository
Administrator :
archiveouverte@ensam.eu
Addition of X-ray fluorescent tracers into polymers, new technology for
automatic sorting of plastics: Proposal for selecting some relevant tracers
Feliks Bezati
a,b,∗, Daniel Froelich
a, Valérie Massardier
b, Elisabeth Maris
aaLaboratoire Conception Produit Innovation (LCPI), Institut ARTS et METIERS ParisTech Chambéry, Savoie Technolac, 4 Rue du Lac Majeur, F-73375 Le Bourget du Lac Cedex, France bIngénierie des Matériaux Polymères – Laboratoire des Matériaux Macromoléculaires (IMP/LMM), UMR-CNRS 5223, INSA-Lyon 17 avenue Jean Capelle F-69621 Villeurbanne Cedex,
France
Keywords: Sorting Recycling Polyolefin Rare earth oxides Tracer
X-ray fluorescence
a b s t r a c t
A description of a new technology for automatic sorting of plastics, based on X-ray fluorescence detection of tracers, added in such materials is presented. This study describes the criteria for the selection of tracers, and concluded that the most adapted for XRF are some rare earth oxides. The plastics chosen for tracing and identification are the ones contained in ELV and WEEE from which discrimination is difficult for the existing sorting techniques due to their black colour.
1. Introduction
The substantial benefits of plastics in terms of low weight, dura-bility, and low cost together with their properties to be used at a wide range of temperatures, be chemical and light resistant as well as to be easily workable as a hot melt helps explains that since 1950, their production has increased an average of almost 10% per year on a global basis and that the annual worldwide demand has grown to 225 million tonnes in 2004 (Andrady and Neal, 2009; APME, 2006). In the European context, according to PlasticsEurope (APME, 2006) the thermoplastic and thermosetting demand by converters was 47 million tonnes in 2004. The major countries of plastic pro-duction are Germany, Italy, France, UK (United Kingdom) and Spain, which together account for around 70% of all European conversion.
Table 1 presents a breakdown of plastic demand and post-consumer waste in Germany, Italy, France, UK and Spain during the year 2004 (APME, 2005). Of the plastics consumed, 37% was used for packaging, 15% for durable consumer applications such as electronics goods and vehicles and the remainder for building/construction applications, domestic/household use, agri-culture, etc. Post-consumer plastic waste generation across these five countries was 14.6 million tonnes in 2004, for a demand of
∗ Corresponding author at: Laboratoire Conception Produit Innovation (LCPI), Institut ARTS et METIERS ParisTech Chambéry, Savoie Technolac, 4 Rue du Lac Majeur, F-73375 Le Bourget du Lac Cedex, France. Tel.: +33 (0) 472 436 003; fax: +33 (0) 472 438 527.
E-mail address:feliks.bezati@ensam.eu(F. Bezati).
33.1 million tonnes.Table 1confirms that the main source of plas-tic wastes has its origin in the field of packaging. However, it is clear that post-consumer waste from electronic and electrical equipment (WEEE) and end-of-life vehicles (ELV) are becoming significant sources with approximately 10% of plastic wastes.
Fig. 1summarizes the recovery and disposal for post-consumer plastic waste by sector in France, Spain, Italy, UK and Germany in 2004 (APME, 2005). More than 50% of post-consumer plastic waste is sent to landfill for disposal. The automotive and electrical indus-tries are the worst performers with less than 10% of plastic wastes recycled. Moreover, the energetic recovery of plastic wastes in these sectors is achieved through easy options such as incineration, which may cause the emission of harmful gases together with gen-eration of toxic fly and bottom ash that contain lead and cadmium (Dodbiba and Fujita, 2004; Patel et al., 1998; Curlee and Das, 1991). For giving a real policy of raw resource management based on the recycling of end-of-life products, the European Commission has set up two Directives, 2000/53/CE and 2002/96/CE, dealing with materials of ELV and WEEE, respectively. The objective for the ELV is that from January 1st 2015, the reuse and recovery rate shall be increased to a minimum of 95% of average weight per vehicle and year, whereas the recovery quotas for 10 WEEE categories were fixed to a range of 70–80% for the end of 2006.
The recycling of polymer materials coming from ELV and WEEE is difficult because large numbers of polymer types, grades and blends are used. In addition, the presence of additives can produce significant changes to the mechanical and thermal properties of the polymers. Consequently, the separation and automatic sorting 0
Table 1
Plastic demand and post-consumer waste by sector in France, Spain, Italy, UK and Germany in 2004.
Demand Waste
ktonnes % ktonnes %
Packaging 12,250 37.0 8970 61.3
Electrical and electronics 2480 7.5 600 4.1
Automotive 2480 7.5 820 5.6
Other 15,890 48.0 4240 29.0
Total 33,100 14,630
Fig. 1. Recovery and disposal of post-consumer plastic waste by sector in France,
Spain, Italy, UK and Germany in 2004 (APME, 2005).
of polymers as part of a recycling scheme is a major issue. Moreover, for today’s optical sorting technologies it is impossible to discrim-inate the black plastic parts in cars and electronic equipments.
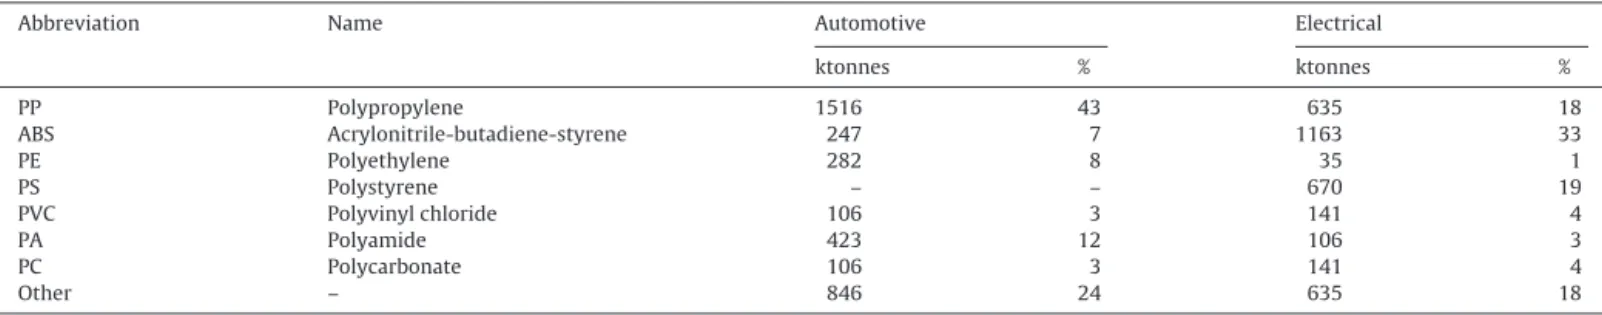
Table 2lists the main types of polymers and their consump-tion in Europe in 2004 for the sectors of automotive and electronic industry. PP together with ABS represents the largest volume of commodity plastics and could be excellent secondary sources of materials.
In this paper, we will review the current technologies for the sorting of plastics and point out their limits, in order to propose a new technology for automatic sorting of plastic wastes through the use of a tracer system, mainly orientated for the ELV and WEEE. 2. Sorting and separation technologies for plastics
For an economically efficient recycling of polymer materials, waste plastics need to be sorted cheaply and automatically into individual types and grades due to the various characteristics that each of the different resin types hold.Brunohas separated the auto-mated sorting of plastic wastes into two categories: macrosorting and microsorting. The macrosorting section deals with the sorting of whole bottles or containers whereas the microsorting section follows the sorting of plastics after it has been chopped into pieces. A comparison of the applications of macrosorting and microsorting and their limits are given inTable 3.
As it can be seen inTable 3, for the macrosorting systems, optical sorting is limited for colour separation of plastics only; the near infra-red is unsuitable for dark objects whereas middle infra-red can identify them but cannot provide a high-speed identification. The X-ray technology, transmission or fluorescence, is limited to the separation of PVC from PET and the laser induced breakdown spectroscopy is unsuitable for high speed automatic sorting.
Regarding the microsorting techniques, density separation and froth flotation are slow processes which require at least one sepa-ration step for each material, and do not provide polymers of high purity. The triboelectric/electrostatic separation could be used for plastics of significantly different dielectric constant, but this tech-nique requires dry and clean plastic surfaces. Moreover, all the sorting techniques mentioned above could not identify different grades of the same polymer.
3. Tracing: a new concept for plastic identification and automatic sorting
As shown previously, the existing technologies of sorting do not provide the versatility or flexibility needed for separating the dark plastics into monopolymeric fractions which are the essential pre-requisite materials for any efficient recycling process. In the end of 1990s,Simmons et al. (1998)andAhmad (2000) proposed a new concept on identification of plastics by marking them with a binary combination of fluorescent tracers detectable by UV (ultra-violet) spectroscopy. The use of a tracer system could provide high purity of the sorted materials, separation by polymer grade as well as polymer type, separation by additive system, high speed posi-tive identification and high speed sorting. This project, founded by the European Economic Community, was focused on the sorting of rigid plastics from packaging household waste for demonstrating the concept. They concluded that the speed and purity of sort-ing were limited by the mechanical ssort-ingulation inadequacy of the conveyor system at high speed for the clear plastics and that the presence of pigments reduced the fluorescence yield. In the case of black pigments, the reduction was too drastic to allow identifi-cation. Aside from these limitations, UV spectroscopy is a surface detection method and this may imply a “clean” surface for tracer identification. The use of “tags” for plastic identification by UV/Vis spectroscopy has also been studied byCorbett et al. (1994). They showed that the addition of phosphor luminescent “tags” to dif-ferent sort of polymers is viable. However, the detection can be disturbed by the stability of the organic “tags” during the repro-cessing of polymers and contaminants, which may be luminescent. The specialized companies in magnetic sorting, as Eriez (Mankosa and Luttrell, 2005), also proposed a magnetic sorting pro-cess of polymers in which a magnetic substance was dispersed. The main advantage of the magnetic detection was the lack of sensitiv-ity with respect to the additives contained in polymers. However, the magnetic tracer system provided only binary separation and required high tracer amount.
Table 2
Plastics consumption in automotive industry and electronic and electrical equipment by resin type in Europe in 2004 (APME, 1999, 2001; Maudet-Charbuillet, 2009).
Abbreviation Name Automotive Electrical
ktonnes % ktonnes % PP Polypropylene 1516 43 635 18 ABS Acrylonitrile-butadiene-styrene 247 7 1163 33 PE Polyethylene 282 8 35 1 PS Polystyrene – – 670 19 PVC Polyvinyl chloride 106 3 141 4 PA Polyamide 423 12 106 3 PC Polycarbonate 106 3 141 4 Other – 846 24 635 18
Table 3
Comparison of the applications of macrosorting and microsorting technologies and their limits.
Sorting technology Application Limits
Macrosorting
Optical (Pascoe, 2003) Sorting of polymers by colour, removing coloured impurities
Does not identify the polymer, limited for only colour separation
Near infra-red (Alam et al., 1994; Scott and Waterland, 1995)
Bottle sorting Unsuitable for dark objects
Mid infra-red (Pascoe, 2003) Technology which can identify dark plastics Cannot be used for high-speed identification and requires relatively smooth, clean surface
X-ray (Dinger, 1992; Kenny and Bruner, 1994)
Proven and established technology for the identification of PVC
Cannot identify the polymer families since they are composed of the same elements. Only used for the separation of PVC from PET
Laser induced breakdown spectroscopy (Gondal and Siddiqui, 2007; Cuesta et al., 2009)
Identification of PE, PP, ABS. Unsuitable for high speed automatic sorting, time of analysis: 1-5 s.
Microsorting
Density separation (Bruno; Altland et al., 1995)
A low cost separation technique used for any material mixture of different densities
Similar densities for some plastics (PE vs. PP, PVC vs. PET), which leads to a low purity of sorted fractions. Slow process, requires at least one separation step for each material
Froth flotation (Shent et al., 1999; Fraunholcz, 2004)
Used for any kinds of polymers. The material is treated with a surfactant for changing the wettability
Selectivity may be difficult to achieve. Requirement of a surfactant to modify the plastics. Separation of only one component at a time
Triboelectric/electrostatic separation (Hearn and Ballard, 2005; Iuga et al., 2005)
Used for plastics of significantly different dielectric constant
Requires a dry and clean plastic surface
Table 4 summarizes the advantages and drawbacks of some spectroscopic techniques which can be used for detecting a tracer system together with the magnetic detection as reported by
Froelich et al. (2007).
From the comparison between the detection techniques of
Table 4, it comes out that the XRF spectrometry shows potential for detecting a tracer system dispersed into dark polymer materials coming from ELV and WEEE.
XRF spectrometry is a volume, non-destructive elemental anal-ysis. Compared to ultra violet fluorescence, the detection process is not affected by black pigments, and a “clean” surface is not required due to a volume detection of around 1 mm depth. However, as XRF is a spectroscopic method based on elemental analysis, thus the number of tracers is limited by the Periodic Table.
4. The selection of tracers 4.1. The detection system in XRF
For having an efficient sorting, the detection system must be able to reliably identify the tracers, singly or in any combination, at very high speeds and analyse the data generated. To achieve the above requirements, the identification system is based on four components, as shown inFig. 2:
- Illumination source: an X-ray generator.
- Filter system: a copper filter, for reducing the noise of measure-ments.
Table 4
Comparison of the detection techniques which can be used for detecting a tracer system (Froelich et al., 2007).
Detection technique Advantages Drawbacks
UV High speed
identification. Tracer concentration: 1–10 ppm
High quantities of tracer for dark plastics. Fluorescence of the polymer matrix. Surface detection Near infra-red High speed identification Unsuitable for the
identification of tracers in dark plastics Mid infra-red Can identify the tracers
in dark plastics Unsuitable for high-speed identification XRF (X-ray fluorescence)
Can identify the tracers in dark plastics. High speed identification. Volume detection
The number of tracers limited by the Periodic Table
Neutron activation Can identify the tracers in dark plastics
Case study for biological applications Magnetic detection Lack of sensitivity with
the additives contained in plastics. Proven and established technology
Only binary discrimination. Requires an elevated quantity of tracers
- XRF detection: silicon, high purity germanium or cadmium tel-lurium detectors, proceeding to 200,000–1,000,000 counts/s. - Data processing electronics: processed the output from the
detec-tors for identifying the tracers.
The excitation of the tracers is achieved through the use of an X-ray generator and the detection by X-ray fluorescence spectrom-etry. Each tracer emits a unique radiation in XRF, which depends on the atomic number of the element. The detection system, cou-pled with a data processing system, detects the emitted radiation and identifies the signature of the tracer, and thus the nature of the polymer matrix. The tracer concentration must be in the range of [100–1000 ppm] in order to not affect the properties of the poly-mer matrix and to be cost effectiveness. To achieve an automatic sorting of plastics by grade and type, the tracers might be used in a matrix, such that each combination corresponds to a specific type of polymer. For example, inFig. 2, by using only 3 tracers, it is possible to identify 7 (23− 1) variations of different plastics. The
detection of tracers will be achieved by EDXRF (energy dispersive X-ray fluorescence).
4.2. Selection of elements composing the tracers
The selection of tracers adapted for the XRF spectrometry detec-tion system is based on a two steps process. As XRF is an elemental analysis, the first step is to choose the more adapted elements from the Periodic Table. Once these selected, the second step is to find the chemical form of the elements which will be conformed to a number of key criteria based on the material properties and tracer identification, summarized as follows:
- High X-ray fluorescent yield: for an intense signal and distin-guished peaks.
- Toxicity and radioactivity: elimination of toxic and radioactive ele-ments.
- Element availability and physical state: elimination of elements having poor reserves and of elements which cannot be added as solids in the polymer matrix.
- Singularity of tracer signal: elimination of elements contained in polymer additives, such as “natural tracers”.
4.2.1. High X-ray fluorescent yield
With the aim of having visible and well distinguishable peaks from the background sample, the intensity of tracers has to be maximalist and their fluorescent transmissions should lie in the energy range of [10–60 keV], where the detectors performed the best. The fluorescent peak should preferably be narrow, for reduc-ing the background noise, and, furthermore, they should differ from other selected tracers by at least 0.5 keV, (resolution of commer-cial detectors) for ensuring adequate and reliable discrimination between tracers.
The tracer identification will be carried out by detecting their K energy lines in order to operate at energies in which the detec-tors have high efficiency. Therefore, elements emitting at energies lower than 10 keV will be dismiss, since these energies are more likely absorbed by air, plastic dust coverings, thin metal foils, which may be present in the construction of an “industrial” sorting envi-ronment. Consequently, by applying these criteria, the elements having an atomic number lower than 30 (ZnK␣1= 9.67 keV) could not be chosen as tracers.
4.2.2. Toxicity and radioactivity
The elements which can be selected as tracers must display very low toxicity and radioactivity due to regulations in processing and use. Toxic elements such as Gallium (Ga), Arsenic (As), Selenium (Se), Cadmium (Cd), Tin (Sn), Antimony (Sb), Mercury (Hg), Thal-lium (Tl), Lead (Pb) and Bismuth (Bi) will be rejected for a potential XRF tracer application (Lauwerys et al., 2007).
Furthermore, radioactive elements such as Curium (Cm), Ameri-cium (Am), Plutonium (Pu), Uranium (U), Thorium (Th), Radium (Ra), Polonium (Po) and Actinium (Ac) or synthetic ones such as
Po U Bi Pb Tl Hg Au Pt Ir Os Re W Ta Hf Lu Yb Er Tm Ho Tb SmGdDy Eu Pr Nd Ce La Cs Xe Te I Sb Sn In Cd Ag Pd Rh Ru Mo Nb Zr Y Rb Sr Kr Br Se As Ge Ga Zn Cu Co Ni Fe Mn Cr V Ti Sc Ca K A Cl S P Si Al Na Mg Ne F O C N Be B Li He H Ba 1.E-11 1.E-10 1.E-09 1.E-08 1.E-07 1.E-06 1.E-05 1.E-04 1.E-03 1.E-02 1.E-01 1.E+00 100 90 80 70 60 50 40 30 20 10 0 Atomic Number, Z Abundance of elements
Fig. 3. Abundance in weight percentage of elements in Earth’s upper continental
crust as a function of atomic number. The rare earth elements are labelled in red bold whereas the 11 rarest “metals” are labelled in green italic (Pannetier, 1985). Americium (Am), Berkelium (Bk), Bohrium (Bh), Curium (Cm), Cal-ifornium (Cf), Darmstadtium (Ds), Dubnium (Db), Einsteinium (Es), Fermium (Fm), Hassium (Hs), Lawrencium (Lr), Mendelevium (Md), Meitnerium (Mt), Neptunium (Np), Nobelium (No), Rutherfordium (Rf), Seaborgium (Sg) and Technetium (Tc) will also be eliminated. 4.2.3. Availability and material behaviour
Elements having poor reserves (Fig. 3), and which are expensive such as Ruthenium (Ru), Rhodium (Rh), Palladium (Pd), Silver (Ag), Indium (In), Tellurium (Te), Osmium (Os), Iridium (Ir), Platinum (Pt), Gold (Au), Protactinium (Pa), Rhenium (Re) and Astatine (At) will be rejected as potential tracers for XRF application.
With respect to the material behaviour the elements of the noble gases group such as Helium (He), Neon (Ne), Argon (Ar), Kryp-ton (Kr), Xenon (Xe) and Radon (Rn) will be eliminated since their standard state is gas.
4.2.4. Singularity of tracer signal
In order to avoid confusion caused by the emissions from the ele-ments composing the additives incorporated within the polymer matrix, it is necessary to identify these elements, by considering them as “natural tracers”, for ensuring an adequate and reliable discrimination between tracers.Table 5summarizes the main addi-tives found in plastic materials.
The elements composing the additives will be eliminated as “natural tracers” and can probably be used for identifying the
prop-Table 5
The main additives used in plastics according to Murphy’s ‘Additives for Plastics Handbook’ (Murphy, 1996).
Additives Specifications of additives
Lubricants Ca, Zn, Li, Ba, Al, Pb stearates, organic compounds Plasticizers Chlorinated, phosphor and amino organic
polymers
Release agents Lubricants, alcohols, metallic stearates (Ca, Zn, Li, Ba, Al, Pb, Mg, Cd, Na)
Fillers and reinforcements
Glass fibers, carbon fibers, talc, mica, wollastonite, barite, calcium carbonate, Pb, Mn, Ba, Ti, Fe, Co, Ni oxides
Colourants (75% inorganic compounds): TiO2(white), Pb
(coloured or white), iron oxides (yellow, red, black-brown), Cr (yellow), Mo (orange), Cd (red), Co (blue), Zn (white), aluminium (green), carbon black and organic pigments
Anti-foaming agents Insoluble oils, silicones, alcohols, stearates and glycols
Stabilizers Salts of Ba, Ca, Sr, Cd, Zn, ZnO
Antioxidants S-organic, P-organic, carbon black, organic compounds
erties that they add in the polymer matrix. These elements are the following one: Fluor (F), Magnesium (Mg), Aluminium (Al), Phosphor (P), Chlorine (Cl), Calcium (Ca), Titanium (Ti), Chrome (Cr), Manganese (Mn), Iron (Fe), Cobalt (Co), Nickel (Ni), Zinc (Zn), Strontium (Sr), Brome (Br), Cadmium (Cd), Tin (Sn), Antimony (Sb), Barium (Ba), Mercury (Hg) and Lead (Pb).
4.2.5. The potential elements for XRF tracer application
By applying the key criteria defined above the list of potential elements is the following one:
- Rare earth elements: Yttrium (Y), Lanthanium (La), Cerium (Ce), Praseodymium (Pr), Neodymium (Nd), Samarium (Sm), Europium (Eu), Gadolinium (Gd), Terbium (Tb), Dysprosium (Dy), Holmium (Ho), Erbium (Er), Thulium (Tm), Ytterbium (Yb).
- Solid metals: Germanium (Ge), Zirconium (Zr), Niobium (Nb), Molybdenum (Mo), Iodine (I), Lutetium (Lu), Hafnium (Hf), Tan-talum (Ta) and Tungsten (W).
4.3. Selection of tracers – rare earth oxides
The selection process developed above has shown that rare earth elements are the most adapted to be used as tracers in XRF. For these elements, it is convenient to use as tracers their most sta-ble chemical form, the oxide (Hussein, 1996; Sastry et al., 1966). In order to confirm their selection, we have first overviewed their application and availability. Secondly, we have considered their use phase as tracers by analysing their toxicity and stability. Finally, we have evaluated their end-of-life phase by studying what it will be the danger of such particles in the plastic wastes during the incineration or disposal.
4.3.1. Rare earth elements: application and availability
In the contrary of what their name indicates rare earth elements are not so rare elements. Their content in the earth’s upper crust is estimated to 0.02% and they have more important reserves than the copper and the lead (Fig. 3). The three main minerals from which rare earth oxides are extracted are the monazite, bastnaesite and xenotime (Leveque and Maestro, 2005; Gupta and Bose, 1989).
Since their discovery, rare earth elements have found many applications in various fields of materials science, thanks to their
specific electronic structure, by offering high specificity and unit value. For example, cerium oxide plays an important role in the domain of multifunctional catalysts by reducing the emission level of pollutants such as nitrogen oxide and monocarboxylic oxide (Nunan et al., 1992; Diwell et al., 1991). Cerium oxide together with erbium oxide is also known to be one of the best polishing agents for glass (Niinisto, 1987). Thanks to their small, lightweight and high-strength, rare earth element magnets, such as alloys contain-ing Nd, Sm, Gd, Dy, or Pr, have allowed miniaturization of numerous electrical and electronic components used in appliances, comput-ers, automobiles, and military gear. Some of rare earth elements, such as Y, La, Ce, Eu, Gd and Tb, have found applications to the new energy-efficient fluorescent lamps and batteries containing La and Ce are gradually replacing Ni–Cd batteries in computer as well as communications applications and could probably replace lead-acid batteries in automobiles (USGS, 2005; Falconnet, 1993).
According to the 2010 edition of the U.S. Geological Sur-vey (USGS) Mineral Commodity Summaries (USGS, 2010a,b), the world’s rare earth reserves are estimated to 100 Mtonnes. As shown inTable 6, 36.4% of the world reserves are located in China, 13.1%
Table 6
World reserves of rare earth ores (USGS, 2010a,b).
Country Mine production in 2009 Reserves
tonnes wt% ktonnes wt%
China 129,000 97 36,000 36.4
Commonwealth of Independent States
Not available Not available 19,000 19.2
United States – – 13,000 13.1
Australia – – 5400 5.5
India 2755 2 3100 3.1
Brazil 665 0.5 48 0.05
Others 580 0.5 22,500 22.7
World total (rounded) 133,000 100,000
in United States, 5.5% in Australia and 3.1% in India; the remain reserves can be found in places such as Canada, Brazil, Malaysia and Africa.
Because of its relative abundance of rare earth containing min-erals, China has been very active in 2009 and has developed a major rare earth element industry, by eclipsing all other countries in pro-duction of both ore and refined products, by producing almost the totality (97 wt%) of rare earth minerals. It can also been seen in
Table 6that countries with important mine ore reserves such as United States and Australia, have no production since 2009; for the reason that the prices proposed by the Chinese market are very low, due to much lower labour and regulatory costs (USGS, 2005). This fact shows also the importance of integrating other countries than China in the rare earth mine production, mostly due to the total dependence on a unique international supplier.
As can be seen inFig. 3andTable 7, there are differences in the abundances of individual rare earth oxides. First, the even atomic numbers rare earth elements (58Ce,60Nd,62Sm,. . .) have greater
abundances than the odd ones (57La,59Pr,63Eu,. . .). Second, the
lighter rare earth elements are more incompatible and therefore more strongly concentrated in the continental crust than the heav-ier ones (USGS, 2005).
If it is considered that the objective is to trace 1000 ktonnes of plastics per year in Europe for WEEE and ELV, at a tracer concen-tration of about 100 ppm, this means that the quantity of each rare earth oxide used as tracer in binary combination, will be approxi-mately 400 tonnes.
1000 (ktonnes plastics)⊗ 3 (tracers) ⊗ 4 (repeatability) ⊗ 0.1 g (tracer)/kg (plastics)
3 (number tracers) = 400 tonnes (tracers/year)
For reserve and production data presented inTable 7, it was con-sidered that the distribution of rare earth elements (except Yttrium) is similar to the one of the Earth’s crust. For the yttrium oxide, the values were obtained according to the U.S. Geological Survey data. Based onTable 7, the 400 tonnes tracer demand of rare earth oxides does not seem to be a problem with respect to reserves and production of the light rare earth elements such as Y, La, Ce, Pr, Nd and Sm, since they will present 1–6% of the total production of 2009. For the even atomic number rare earth elements, such as Gd, Dy, Er and Yb, the availability does not seem to be a problem. However, regarding the tracer demand compared to the production of 2009 (6–19%), this could be a potential issue causing a bottleneck for the market distribution.
The use of rare earth elements in automotive pollution con-trol catalysts, permanent magnets, and rechargeable batteries are expected to continue to increase as future demand for conven-tional and hybrid automobiles, computers, electronics and portable equipment grows. This means that markets are expected to require greater amounts of higher purity mixed and separated products for meeting the demand (Hedrick, 2007; Maestro and Huguenin, 1995). For these reasons, the availability and the production of rare earth
Table 7
Rare earth oxides production in 2009, reserves, tracing demand and prices in 2010 given by AMPERE for a purity of 99.9%.
Tracers Production in 2009
(tonnes)
Reserves (ktonnes) Tracing demand based
on 2009 production (%) Prices for 1 kg (D) Y2O3 8900 540 4 12 La2O3 18,900 15,300 2 14 CeO2 48,500 39,100 1 6 Pr2O3 5800 4700 7 31 Nd2O3 25,200 20,400 2 28 Sm2O3 6800 5500 6 50 Eu2O3 200 170 200 560 Gd2O3 6300 5100 6 85 Tb2O3 1000 770 40 800 Dy2O3 3800 3100 11 340 Ho2O3 1200 1000 33 500 Er2O3 2100 1700 19 30 Tm2O3 200 170 200 300 Yb2O3 3200 2500 13 250
elements are very important parameters which have to be taken in consideration for the selection of tracers.
4.3.2. Use phase: toxicity and stability of rare earth oxides
The tracers must have very low toxicity and need to meet the regulations associated with their processing and use.Table 8
presents the hazard classification of some rare earth oxides. With respect to Annexe I of European Directive 67/548/EC, the majority of rare earth oxides are classified as irritant and their risk code is R36, which means that they may be irritating to eyes. Regarding the median lethal dose (LD50), the results show that these substances
have a very low toxicity. Moreover, a study done byHirano and Suzuki (1996)on the exposure, metabolism, and toxicity of rare earths and related compounds showed that these elements are not highly toxic, and their cytotoxicity to macrophages is comparable to that of Cd or silica in vitro. The rare earth oxides, used as tracers are intending for plastics used in automotive and electronic indus-try, thus their property for being irritating to eyes will not be a problem in this approved applications.
The substances used as tracers must not chemically react with the host materials and cause changes to any of their thermal, mechanical or physical properties beyond acceptable limits. The characteristics of some rare earth oxides are given inTable 9. Rare earth oxides are inert particles and thus cannot chemically react with the host polymer material. For most of them, they crystallise to a cubic close packing arrangement with some exceptions such as lanthanum and neodymium oxides which crystallise to a hexag-onal one. They can be provided to a micrometric size in order not to act as probable nucleator agents by modifying the thermal prop-erties of the polymer matrix (Xiaomin et al., 1996; Ye et al., 1996; Liu et al., 1993).
Table 8
Hazard classification of some rare earth oxides.
Rare earth oxides
CAS number Hazard
symbolsa Risk code LD50d(mg/kg) Y2O3 1314-36-9 Xib R36c >5000 La2O3 1312-81-8 Xi R36 >5000 CeO2 1306-38-3 Xi R36 >5000 Pr2O3 12037-29-5 Xi R36 >5000 Nd2O3 1313-97-9 Xi R36 >5000 Gd2O3 12064-62-9 Xi R36 >5000 Dy2O3 1308-87-8 Xi R36 >5000 Er2O3 12061-16-4 Xi R36 >5000 Yb2O3 1314-37-0 Xi R36 >5000
aClassification with respect to Annexe I of European Directive 67/548/EC. b Irritant.
c Irritating to eyes.
d Median lethal dose of a toxic substance (LD
50): dose required to kill half the
members of a tested population.
Regarding the effect of tracers in the thermal and mechani-cal properties as well as in their stability under weathering, the authors have already reported in previous works (Bezati et al., 2011, 2010a,b) that the addition of 1000 ppm of rare earth oxides of micrometric particle size into PP matrix has a minor effect on the mechanical and thermal properties of the traced materials as well as in the photo-degradation of the polymer after UV irradiation exposure.
4.3.3. End-of-life phase: rare earth element risks during incineration or disposal
Even if the best scenario for the traced plastics is to consider that hundred percent will be recovered, although, one possibility could be that part of the post-consumer traced plastic wastes are sent to landfill for disposal or to incineration for energy recovery. Therefore it is important to analyse the life cycle of the traced plastics and obtain more knowledge in the thermal decomposition of rare earth oxides and their potential risk to soils.
Diatloff et al. (1995)as well asWahid et al. (2000)have reported the positive effects of rare earth elements on agricultural produc-tion. In particularly, La, Ce, Pr and Nd can promote the root growth of coconut, corn and mungbean at a low rate of application. On the contrary, high application of rare earth elements may lead to their scattering and bioaccumulation in the environment and cause environmental pollution (Haley, 1965; Sabbioni et al., 1982).
Zhang et al. (2001)have studied the rare earth element con-tent in various waste ashes and the pocon-tential risk to Japanese soils. The results showed that Y, La, Ce, Pr, Nd, Dy, Yb, Ho, Er, Tm and Lu in the waste ash samples were normally distributed, whereas Sc, Sm, Eu, Gd and Tb were not. Ce, with an average of 26 mg/kg, was the most abundant of the whole rare earth ele-ments, followed by La, with an average of 14 mg/kg, whereas the least abundant was Tm with an average of 0.2 mg/kg. They also found that the content in waste ashes followed the sequence of Ce > La = Y > Nd > Sm > Pr > Gd > Dy > Eu > Tb > Er > Yb > Ho > Lu > Tm.
Table 9
Characteristics of some rare earth oxides.
Tracers Mean particle size (m) Density (g/cm3) Crystalline form of the oxide Melting point (◦C) Y2O3 1–10 2989 Cubic 2415 La2O3 1–10 5872 Hexagonal 2250 CeO2 1–10 6110 Cubic 2600 Nd2O3 1–10 6453 Hexagonal 2272 Gd2O3 1–10 7600 Cubic 2340 Dy2O3 1–10 8161 Cubic 2340 Er2O3 1–10 8660 Cubic 2355 Yb2O3 1–10 9200 Cubic 2346
Based on the studies described above, the selection of rare earth oxide as tracers will probably not affect the life cycle of the plastic material during the incineration and disposal. However, additional studies have to be done in order to confirm this conclusion. 5. Conclusion
In this paper we have shown that the existing sorting techniques cannot discriminate the polymers in different families and grades and cannot identify the black plastics, which are the main poly-mer materials used in automotive and electronic industry. Based on this research work, it appears that X-ray fluorescence, used with a tracer system, could be a solution for the high speed identification and automatic sorting of black plastics into different families and grades.
The addition of X-ray fluorescent tracers to polymer materials provides positive and specific versatility, high purity of sorted frac-tions as well as efficient and effective sorting. The major advantage of XRF compared to other optical techniques, such as UV spec-troscopy, is its ability to detect the tracers even if the polymer matrix is black. However, for XRF the number of tracers is limited to the elements of Periodic Table.
This study has concluded that the tracers the more adapted for the XRF detection process are some rare earth oxides such as Y2O3,
CeO2, Nd2O3, Gd2O3, Dy2O3and Yb2O3. The selected components
are non toxic, non radioactive, with important reserves, and in con-centration levels below 1000 ppm do not affect the properties of the polymer matrix.
The results of this work together with recent publications of the authors (Bezati et al., 2011, 2010a,b; Bezati, 2010c) has lead to a four-years project, mainly funded by the French Agency of Research, with the objective of demonstrating the technical fea-sibility and commercial viability of sorting of plastics containing X-ray fluorescent tracer.
Acknowledgements
The authors would like to thank the French Industry-University Cooperative Research Network on Waste (RECORD – www.record-net.org) and the French Environment and Energy Management Agency (ADEME –www.ademe.fr) for their contribution to the funding of this work and for providing industrial orientations and scientific supervision to the research.
References
Ahmad SR. Marking of products with fluorescent tracers in binary combinations for automatic identification and sorting. Assembly Autom 2000;20:58–64. Alam MK, Stanton SL, Hebner GA. Near-infrared spectroscopy and neural networks
for resin identification. Spectroscopy 1994;9:30–40.
Altland BL, Cox D, Enick RM, Beckman EJ. Optimization of the high-pressure near-critical liquid-based microsortation of recyclable post-consumer plastics. Resour Conserv Recycl 1995;15:203–17.
Andrady AL, Neal MA. Applications and societal benefits of plastics. Philos Trans R Soc B 2009;364:1977–84.
APME. An analysis of plastics production, demand and recovery in Europe. Association of Plastic Manufactures in Europe, Brussels, Belgium.
http://www.apme.org; 2006.
APME. Plastic waste in European key countries. Association of Plastic Manufactures in Europe, Brussels, Belgium.http://www.apme.org; 2005.
APME. Plastic: a material of innovation for the electrical and electronic industry. Association of Plastic Manufactures in Europe, Brussels, Belgium.
http://www.apme.org; 2001.
APME. Plastic: a material of choice for the automotive industry. Association of Plastic Manufactures in Europe, Brussels, Belgium.http://www.apme.org; 1999. Bezati F, Massardier V, Balcaen J, Froelich D. A study on the dispersion, preparation,
characterization and photo-degradation of polypropylene traced with rare earth oxides. Polym Degrad Stabil 2011;96:51–9.
Bezati F, Froelich D, Massardier V, Maris E. Addition of tracers into the polypropy-lene in view of automatic sorting of plastic wastes using X-ray fluorescence spectrometry. Waste Manage 2010a;30:591–6.
Bezati F, Massardier V, Froelich D, Maris E, Balcaen J. Elaboration and char-acterization of traced polypropylene with rare earth oxides for automatic identification and sorting of end-of-life plastics. Waste Biomass Valor 2010b;1: 357–65.
Bezati F. L’addition de traceurs dans les polymères: Une nouvelle voie spectro-scopique par fluorescence X, pour l’identification rapide et le tri des matériaux plastiques. France: Institut national des sciences appliquées de Lyon; 2010c. Bruno EA. Automated sorting of plastics for recycling.http://www.p2pays.org. Corbett EC, Frey JG, Grose RI, Hendra PJ, Taylorbrown T. An investigation into the
applicability of luminescent tagging to polymer recovery. Plast Rub Compos Process Appl 1994;21:5–11.
Cuesta JML, Mascaro JF, Lorecki B. Nouvelles technologies de tri et identification des matières plastiques. La Seyne sur Mer, France: Journées MIEC; 2009. Curlee TR, Das S. Plastics wastes (management control recycling and disposal). New
Jersey: Noyes Data Corporation; 1991.
Diatloff E, Smith FW, Asher CJ. Rare earth elements and plant growth: II. Responses of corn and mungbean to low concentrations of lanthanum in dilute, continuously flowing nutrient solutions. J Plant Nutr 1995;18:1977–89.
Dinger P. Automatic sorting for mixed plastics. BioCycle 1992;33:80–2.
Kenny GR, Bruner RS. Experience and advances in automated separation of plastics for recycling. J Vinyl Addit Technol 1994;16:181–6.
Diwell AF, Rajaram RR, Shaw HA, Truex TJ. The role of ceria in three-way catalysts. Stud Surf Sci Catal 1991;71:139–52.
Dodbiba G, Fujita T. Progress in separating plastic materials for recycling. Phys Sep Sci Eng 2004;13:165–82.
Falconnet P. The rare earth industry: a world of rapid change. J Alloys Compd 1993;192:114–7.
Fraunholcz N. Separation of waste plastics by froth flotation – a review. Part I. Miner Eng 2004;17:261–8.
Froelich D, Maris E, Massardier V. Etat de l’art technico-economique sur les procédés et techniques d’incorporation de traceurs dans des matériaux polymères, en vue du tri automatisé des déchets plastiques des produits hors d’usage. Report N◦
05-0907/1A, RECORD, French Industry-University Cooperative Research Network on Waste.www.record-net.org; 2007.
Gondal MA, Siddiqui MN. Identification of different kinds of plastics using laser-induced breakdown spectroscopy for waste management. J Environ Sci Health A 2007;42:1989–97.
Gupta CK, Bose DK. Process technology – rare and refractory metals. Bull Mater Sci 1989;12:381–405.
Haley TJ. Pharmacology and toxicology of the rare earth elements. J Pharm Sci 1965;54:663–70.
Sabbioni E, Pietra R, Gaglione P. Long-term occupational risk of rare-earth pneumo-coniosis. A case report as investigated by neutron activation analysis. Sci Total Environ 1982;26:19–32.
Hearn GL, Ballard JR. The use of electrostatic techniques for the identification and sorting of waste packaging materials. Resour Conserv Recycl 2005;44:91–8. Hedrick JB. Minerals yearbook, rare earths. United State Geological Survey.
http://minerals.usgs.gov/; 2007.
Hirano S, Suzuki KT. Exposure, metabolism, and toxicity of rare earths and related compounds. Environ Health Perspect 1996;104:85–95.
Hussein GAM. Rare earth metal oxides: formation, characterization and catalytic activity. Thermoanalytical and applied pyrolysis review. J Anal Appl Pyrol 1996;37:111–49.
Iuga A, Calin L, Neamtu V, Mihalcioiu A, Dascalescu L. Tribocharging of plastics granulates in a fluidized bed device. J Electrostat 2005;63:937–42.
Lauwerys RR, Haufroid V, Huet P, Lison D. Toxicologie industrielle et intoxications professionnelles. Masson, IIssy-les-Moulineaux; 2007.
Leveque A, Maestro P. Terres Rares. Techniques de l’Ingeˇınieur; 2005.
Liu J, Tang G, Qu G, Zhou H, Guo Q. Crystallization of rare earth oxide-filled polypropylene. J Appl Polym Sci 1993;47:2111–6.
Mankosa MJ, Luttrell GH. Plastic material having enhanced magnetic susceptibility, method of making and method of separating. N◦WO/2004/012920; 2005.
Maudet-Charbuillet C. Proposition d’outils et démarches pour l’intégration de filières de recyclage de matières plastiques dans la supply chain automobile. France: Institut ParisTech Chambéry; 2009.
Murphy J. The additives for plastics handbook. Oxford: Elsevier Advanced Technol-ogy; 1996.
Niinisto L. Industrial applications of the rare earths, an overview. Inorg Chim Acta 1987;140:339–43.
Maestro P, Huguenin D. Industrial applications of rare earths: which way for the end of the century. J Alloys Compd 1995;225:520–8.
Nunan JG, Robota HJ, Cohn MJ, Bradley SA. Physicochemical properties of Ce-containing three-way catalysts and the effect of Ce on catalyst activity. J Catal 1992;133:309–24.
Pannetier R. Momento du vade mecum nucleaire. Paris: SCF du Bastet; 1985. Patel MK, Jochem E, Radgen P, Worrell E. Plastics streams in Germany – an
anal-ysis of production, consumption and waste generation. Resour Conserv Recycl 1998;24:191–215.
Pascoe RD. Sorting of plastics using physical separation techniques. Recycling and reuse of waste materials. In: Proceedings of the international symposium; 2003. p. 173–88.
Sastry RLN, Yoganarasimhan SR, Mehrotra PN, Rao CNR. Preparation, characteriza-tion and thermal decomposicharacteriza-tion of praseodymium, terbium and neodymium carbonates. J Inorg Nucl Chem 1966;28:1165–77.
Scott DM, Waterland RL. Identification of plastic waste using spectroscopy and neu-ral networks. Polym Eng Sci 1995;35:1011–5.
Shent H, Pugh RJ, Forssberg E. A review of plastics waste recycling and the flotation of plastics. Resour Conserv Recycl 1999;25:85–109.
Simmons BA, Overton BW, Viriot M, Ahmad SR, Squires DK, Lambert C. Fluorescent tracers enable automatic identification and sorting of waste plastics. Br Plast Rubber 1998:4–8.
USGS. Rare earths. United State Geological Survey; 2010a, http://minerals.usgs.gov/. USGS. Yttrium. United State Geological Survey; 2010b, http://minerals.usgs.gov/. USGS. Rare earth elements-critical resources for high technology. United State
Geo-logical Survey; 2005, http://minerals.usgs.gov/.
Wahid PA, Valiathan MS, Kamalam NV, Eapen JT, Vijayalakshmi S, Prabhu RK. Effect of rare earth elements on growth and nutrition of coconut palm and root
com-petition for these elements between the palm and Calotropis gigantea. J Plant Nutr 2000;23:329–38.
Xiaomin Z, Jingshu L, Zhihui Y, Jinghua Y. Rheological properties and crystallization behavior of yttrium oxide filled low ethylene content polypropylene copolymer. J Appl Polym Sci 1996;62:313–8.
Ye C, Liu J, Mo Z, Tang G, Jing X. Crystal structure of polypropy-lene filled with rare earth oxides. J Appl Polym Sci 1996;60: 1877–81.
Zhang F, Yamasaki S, Kimura K. Rare earth element content in various waste ashes and the potential risk to Japanese soils. Environ Int 2001;27: 393–8.