HAL Id: hal-01089413
https://hal.inria.fr/hal-01089413
Submitted on 1 Dec 2014HAL is a multi-disciplinary open access archive for the deposit and dissemination of sci-entific research documents, whether they are pub-lished or not. The documents may come from teaching and research institutions in France or abroad, or from public or private research centers.
L’archive ouverte pluridisciplinaire HAL, est destinée au dépôt et à la diffusion de documents scientifiques de niveau recherche, publiés ou non, émanant des établissements d’enseignement et de recherche français ou étrangers, des laboratoires publics ou privés.
of an Automated Process
Sylvain Fleury, Éric Jamet, Achraf Ghorbel, Aurélie Lemaitre, Eric Anquetil
To cite this version:
Sylvain Fleury, Éric Jamet, Achraf Ghorbel, Aurélie Lemaitre, Eric Anquetil. Application of the Resources Model to the Supervision of an Automated Process. ACM Transactions on Computer-Human Interaction, Association for Computing Machinery, 2015, 30, pp.103 - 121. �10.1080/07370024.2014.893831�. �hal-01089413�
Interaction.
Application of the Resources Model to the Supervision
of an Automated Process
Sylvain Fleury
1, Éric Jamet
1, Achraf Ghorbel
2,
Aurélie Lemaitre
1&
Eric Anquetil
21
University of Rennes 2,
2INSA, University of Rennes 1
AUTHORS’MINI-BIOS:
Sylvain Fleury holds a PhD in cognitive psychologist and has a special interest in
human-computer interaction. He is a member of the LOUSTIC laboratory at the University of Rennes 2.
Éric Jamet, a professor of cognitive ergonomics with an interest in human-computer
interaction, isthe head of LOUSTIC, a multidisciplinary ICT usage laboratory, and a researcher with the CRPCC research center at the University of Rennes 2.
Achraf Ghorbel, who holds a PhD computer science and has a special interest in
document analysis, is a member of the Intuidoc team at the INSA/IRISA laboratory.
Aurélie Lemaitre, an assistant professor in computer science, with an interest in offline
structured document recognition, is a researcher with the IntuiDoc team at the University of Rennes 2/IRISA laboratory.
Eric Anquetil is a professor in computer science with an interest in pattern recognition
(gestures, symbols, drawings, structured documents, etc.), and leads the IntuiDoc team at the INSA/IRISA laboratory.
Interaction.
Abstract
The present study was designed to ascertain how far flagging up potential errors can improve the automatic interpretation of technical documents. We used the resources model to analyze the supervised retro-conversion of architectural floor plans, from the perspective of distributed cognition. Results showed that automated assistance helps users to correct errors spotted by the system and also saves time. Surprisingly, they also showed that flagging up possible errors may make users less effective in identifying and correcting errors that go unnoticed by the system. Responses to a questionnaire probing the participants’ confidence in the system suggested that they were so trusting that they lowered their vigilance in those areas that had not been signaled by the system, leading to the identification of fewer errors there. Thus, while the participants’ confidence in the automated assistance system led to improved performances in those areas it highlighted, it also meant that areas to which the system did not draw attention were less thoroughly checked.
Interaction.
CONTENTS
1. INTRODUCTION
1.1. Resources model 1.2. Trust in the software 1.3. Hypotheses 2. METHOD 2.1. Participants 2.2. Material 2.3. Procedure 3. RESULTS 3.1. Task duration 3.2. Errors
Errors spotted by the system Errors not spotted by the system 3.4. Degree of trust in the automated system 4. DISCUSSION AND CONCLUSION
Interaction.
1. INTRODUCTION
Symbol recognition is currently a rapidly developing field with many applications. One promising area is the recognition of the symbols contained in technical documents, with a view to obtaining interpretations compatible with computer-aided design (CAD) software-a process known as retro-conversion. In this context, several recent research projects have focused on the development or improvement of tools for retro-converting architectural plans (Ahmed, Liwicki, Weber, & Dengel, 2011; Lu, Tai, Su, & Cai, 2005), electrical diagrams (Ouyang & Davis, 2009) and road maps (Chiang & Knoblock, 2013). The study described in this article was conducted under the aegis of the MobiSketch (http://mobisketch.irisa.fr/) project to design software capable of interpreting plans such that they are compatible with CAD software1. MobiSketch aims to develop generic, pen-based software for structured document analysis, design and editing, focusing on
technical documents such as architectural floor plans. The idea is to offer a
comprehensive, one-stop-shop solution, from paper document recognition to pen-based document sketching on a table PC. Our software is designed to interpret the symbols on a scanned plan in order to make it directly compatible with the main types of architecture software. The problem is that this kind of system is liable to make mistakes. Our own software has been found to have a 9% error rate (Ghorbel, Lemaitre, & Anquetil, 2012). Users therefore have to be able to identify and correct these errors. Several studies have been conducted to determine how best to improve the interface in order to make this task easier (Fleury et al., 2013a; Fleury et al., 2013b; Fleury & Jamet, 2013). The specific functionality we tested here is the software’s ability to highlight areas carrying a risk of error. Our software is able to assign a likelihood score to each of its symbol
interpretations, that is, to assess its own risk of error for each interpretation (Ghorbel, Almaksour, Lemaitre, & Anquetil, 2011; Ghorbel, Macé, Lemaitre, & Anquetil, 2011). Users have to verify the symbol interpretations in order to detect the errors - a task that bears some similarities with the detection of weapons in X-ray images of luggage, which has been the subject of several studies. In one such study, conducted by Wiegmann et al. (2006), participants were shown a series of images and asked to indicate whether they could see a knife. In this experiment, 20% of the images contained a knife. Some
participants had to perform this task without any assistance, while others benefited from automated assistance. This assistance consisted of a simulated automatic pattern
recognition system, capable of detecting the presence of a knife in an image with an accuracy of 0.90 and a false alarm rate of 0.25. Depending on the experimental condition, the automated assistance could take one of three forms: a message displayed before the image appeared, a message displayed at the same time as the image, or a circle around the relevant area in the image. Results showed that, compared with the textual cues, the spatial cue (circling the target) significantly improved detection performances. The experiment conducted by Goh, Wiegmann, and Madhavan (2005) confirmed this result by demonstrating the superiority of a direct cue surrounding the potential target over an indirect cue indicating its supposed presence somewhere in the image. In a study featuring a monitoring task, Skitka, Mosier, and Burdick (1999) showed that automated
1
This software is under development as part of the "MobiSketch" French National Research Agency (ANR) project, within the framework of the “Content and Interaction” program (ref. 09-CORD-015).
Interaction.
assistance could improve participant accuracy. However, when the assistance made mistakes, participants tended to err, too. The authors called this an error of complacency (Skitka et al., 1999), in that participants trusted the automated assistance more than they should have done, given its actual reliability. The same pattern of results was obtained by Alberdi et al. (2008) in a study involving automated assistance for lesion detection in mammography. Again, the participants’ detection performances increased when the assistance provided relevant information, but declined when it provided irrelevant information. However, neither Skitka et al. (1999) nor Alberdi et al. (2008) actually measured participant confidence in order to confirm their interpretations of the results.
1.1. Resources model
A general model, dealing with cognition as a distributed phenomenon, namely the resources model (Fields, Wright, & Harrison, 1997; Wright, Fields, & Harrison, 1996; Wright, Fields, & Harrison, 2000), could provide a relevant way of interpreting it. The task performed by the participants in the experiment was therefore analyzed from the perspective of distributed cognition (Hutchins, 1995), via the resources model. This model focuses on the system composed of human-machine interactions, rather than solely on the user’s cognitive functioning. This system contains a number of informational resources that can be stored either in the user’s memory (user-embedded) or else in the machine or even a paper-based manual (device-embedded). According to Wright et al. (1996), a variety of resources can be contained in the system, including plans, interaction states, goals, affordances, histories and action-effect mappings.
The types of informational resources
A plan is a sequence of actions, events or states. It can be either user-embedded, stored in memory, or device-embedded, in the form of a written step-by-step procedure on the screen or a manual. The plan may either be available from the very outset, or else be built by the user in the course of the interaction. It may contain conditional loops. The interaction state is the set of values of the relevant variables for the interaction at a specific point in time. In the case of a website, for instance, it corresponds to being on a particular page. The site may or may not be in a loading state. The transition from one state to another may either follow an action of the user or else result from an action by the machine itself. The state may or may not be external (e.g., visible on the screen). The user can certainly see which page he is or she is browsing, but the loading of elements is not necessarily reported (internal state). The goal is a description of the state to be
achieved. This description may be either external, if it is represented on the screen or in a manual, or internal, if it is constructed in the user’s memory. A goal and a plan are two different things. A plan is a procedure, a sequence of events designed to reach a goal, whereas a goal is solely the targeted state. For example, in the Tower of Hanoi game, the goal is the final configuration the player must achieve, whereas the plan is the set of disk moves needed to achieve that goal. The term affordances refer to “the actionable
properties between the world and an actor” (Norman, 1999, p.38). More specifically, in this model, the affordances are to the set of possible actions the user can perform in a given interaction state. These actions can be identified by the user. For example, a button
Interaction.
with an arrow pointing towards the right in a website has an affordance (following page). A history is the set of actions, events or states that have taken place since the start of the interaction. A history can be stored either in the machine, thereby allowing the undo function to cancel the last action that was performed, or else in the user’s memory. Histories resemble plans because they are sequences of actions, events or states.
However, unlike plans, histories cannot contain conditional loops, as they concern events that took place in the past. Action-effect relations are the set of causal relations between user actions and changes in the interaction state. For example, in many programs, the action of clicking on the cross has the effect of closing the window. These action-effect relations may be either external, explained in user manuals, or else internal, stored in the user’s memory.
Interaction strategies
In the resources model, an interaction sequence is defined as a succession of steps, that is, changes in resource configuration (Wright et al., 1996). Each step is characterized by the execution of two processes: the choice of a future action that takes account of current resources, and the re-configuration (or updating) of resources to take account of previous actions. For example, the plan is updated at every step (Wright et al., 1996).
Fields et al. (1997) defined six main interaction strategies in view of available
resources. In the plan-following strategy, the interaction state allows users to know where they are in the plan. The plan tells them which action to do next, and users go back and forth between plan and state. The planning strategy consists in producing a plan that can then be used in a plan-following strategy. The planning is done by coordinating the goals, states, action-effect relations and affordances for each stage of the plan (Fields et al., 1997; Wright et al., 2000). The semantic matching strategy uses the same resources as the planning strategy. The users decide what they will do by matching action-effect relations with goals, and trying to see if the resulting state of the system meets those goals. Display-based interaction is identical to semantic matching, except that the action-effect relations and affordances are externally matched. In goal-directed exploration, users do not have a plan, and move forward on the basis of trial and error. They try something from the available affordances and compare the state of the system with the goal. If the two do not match, they try something else. Finally, with
learning-by-exploring, users create new plans by looking at the history of a series of actions with
positive outcomes. This strategy can also expand the action-effect repertoire for the purposes of future semantic matching (Fields et al., 1997).
Many publications in the field of human-computer interaction (HCI) cite the resources model as an important reference for task-modeling tools (e.g., Blandford & Furniss, 2006; Doherty, Campos, & Harrison, 2008). For example, it can be applied to the design of virtual wayfinding environments (Smith & Hart, 2006), the modeling of smart environments (Harrison, Massink, & Latella, 2009), the design of graphic user interfaces (Mehrnejad, Toreini, & Ghaemi Bafghi, 2011), and the design of healthcare technology (Rajkomar & Blandford, 2011).
Interaction.
The resources model focuses on information in the distributed cognitive system. It does not, therefore, take subjective variables into account, even though they could have a significant impact on the interaction. In the present case, user confidence in the machine could be an important factor (Jian, Bisantz, & Drury, 2000). In previous applications of the resources model, the machine did not make mistakes (Fields, Wright, Marti, & Palmonari, 1998; Smith, Duke, & Wright, 1999; Wright et al., 1996). In our study, however, the questioning of participants by the software was driven by uncertainty about the symbol interpretations. It was the risk of error that prompted the software to ask for the participants’ input. There might or might not, therefore, be an actual mistake. In addition, some potential errors in the retro-conversion might be missed by the software. This meant that the participants’ confidence in the software was crucial. If they did not trust the machine, the system’s requests for input would be pointless, as the participants would still check every inch of the plan with the same intensity. This is what Fogg and Tseng (1999) call the incredulity error. Conversely, if participants placed too much faith in the software, they might be less vigilant and miss errors that were not flagged up. In this case, they would be committing a gullibility error (Fogg & Tseng, 1999). In the field of HCI, trust can be defined as “the attitude that an agent will help achieve an
individual’s goals in a situation characterized by uncertainty and vulnerability” (Lee & See, 2004, p. 51). According to Fogg and Tseng (1999), “trust indicates a positive belief about the perceived reliability of, dependability of, and confidence in a person, object, or process” (p. 81). A user’s assessment of a system’s credibility is not always in line with that system’s actual level of accuracy. Credibility can be evaluated accurately, but it can also be overestimated or underestimated.
Being a form of interpersonal trust, trust in a system is dynamic, changes across
interactions, and increases or decreases over time (Hoffman et al., 2013; Lee & Moray, 1992; Khasawneh, Bowling, Jiang, Gramopadhye, & Melloy, 2003). In general, a system tends to gain credibility when it provides correct, accurate, and relevant information. Conversely, it loses credibility when it supplies false information (Khasawneh et al., 2003). According to Lee and See (2004), when the level of confidence corresponds to the true level of reliability, it tends to induce an appropriate use of the system. However, excessively high confidence in relation to actual reliability can lead to misuse, while an excessively low level of trust may result in cessation of use. The over-confidence is called complacency by Miller and Parasuraman (2007). In this case, the operator tends to become less vigilant. This attentional disengagement was modeled by Parasuraman and Manzey (2010) in the form of a loop involving trust, the allocation of attentional
resources, and feedback from the system. According to this model, the operator allocates attentional resources to all nonautomated tasks, but the amount of resources allocated to automated tasks depends on his or her degree of trust in the system. Feedback provided by the system on the outcome of the participants’ actions further affects their trust. The over-confidence effect has also been demonstrated in research on a collision alarm system for car drivers (Abe, Itoh, & Tanaka, 2002). In this study, participants who were highly confident in the system performed more poorly on obstacle avoidance, when the automated assistance was no longer working, than participants who were less confident in it.
Interaction.
Generally speaking, designers seek to make their systems as credible as possible. However, Lee and See (2004) recommend designing systems so that trust is simply appropriate, rather than too high.
1.3. Hypotheses
If they are to pinpoint errors of interpretation, participants must implement a semantic matching strategy, whereby they decide which actions to take (i.e., which interpretations to correct) by matching the action-effect relation with the goals and system state. In this situation, the goals are the correct interpretations of the symbols, as described in the instructions, and the system state refers to the interpretations that are performed by the software. When these two informational resources fail to match up, the user must perform a correction in order to make them correspond. As we mentioned earlier, the software is able to assess the degree of certainty for each of its interpretations. Thus, it is able to tell the user which interpretations carry a risk of error. By flagging up each risky
interpretation in turn, the software provides the user with a plan (i.e., a set of areas to check in a given order). Thus, it allows the user to implement a second interaction strategy (plan-following strategy) in parallel with the semantic-matching strategy. This plan-following strategy, which focuses more on the risky areas, promotes the detection of highlighted errors. Our first hypothesis (H1) therefore predicted that more participants would correct errors flagged up by the system than the same errors which are not signalled.
The fact that the software was capable of making mistakes might have an impact on trust. For each plan, four of the six potential error flagged up by the system were indeed errors. We therefore expected participants in the without-interruption condition to find more of the errors that were not flagged up by the machine in the with-interruption condition. Machine errors tend to decrease what Merritt and Ilgen (2008) call
history-based-trust. However, Wiegmann, McCarley, Kramer, and Wickens (2006) showed that
in a luggage screening task, a system for automatically detecting knives had a positive impact on the users’ confidence in their own judgments. They therefore attributed credibility to the system whenever it intervened. Indeed, the phenomenon of
complacency induced by the automation should occur (Skitka et al., 1999). The second hypothesis of this study (H2) was thus that users asked for their input have greater confidence in the machine. Our third hypothesis (H3) was that these users correct fewer unreported errors than those who are not asked for their input, because their increased confidence reduces the extent of checks on areas not flagged up by the machine.
2. METHOD
2.3. Participants
Participants in the present study were 48 volunteers (11 men and 37 women), none of whom worked or studied in the field of architecture. The youngest was aged 18.75 years and the oldest 44.17 years. Their mean age was 26.23 years (SD = 5.98). For their participation, volunteers receive a voucher valued at 15 euros.
Interaction.
2.4. Material
In this experiment, each of the four tasks was performed on a Tablet PC Asus Eee Slate 12.1, and a prototype software capable of automatically recognizing various symbols was used to create the plan interpretations (see Fig. 1). Each participant had to correct the errors of interpretation of four plans in succession, in one of two experimental conditions: interruption by the system (IS) and without interruption by the system (WIS).
Figure 1. Photograph of the interface with a fully interpreted plan
In the WIS condition, the original plan was immediately displayed on the screen, and the automatic recognition process then began to unfold. Participants were able to halt this process at any time to correct errors. The IS condition was identical to the WIS one, except that when the system encountered a possible error, it halted the interpretation and displayed the possible corrections on the screen in clickable buttons. Participants had to correct errors by selecting the right symbol (door, casement, sliding window, wall or furniture). Each of the plans we used had 60 symbols and six misinterpretations. In the IS condition, there were six interruptions by the system, four of which concerned genuine errors and two correct interpretations. Thus, two errors in each plan failed to trigger an interruption by the system.
In the WIS condition, the task consisted in watching the retro-conversion as it unfolded and monitoring the interpretations proposed for each symbol by the prototype software. When participants noticed a misinterpretation, they had two ways of correcting it. The first was to click on the pause button first, to halt the retro-conversion process, and then click on the misinterpreted symbol to view the range of possible corrections. The
Interaction.
second was to click directly on the misinterpreted symbol, which had the effect of
blocking the retro-conversion process and displaying the correction options. Our decision to create this shortcut met the minimal actions and the flexibility criterions (Bastien & Scapin, 1993), in that it eliminated one of the steps in the error correction process and allows the participants to perform the task in different ways.
This loop was repeated for each error that was identified until the retro-conversion process came to an end. The participants’ goal was an error-free plan interpretation. This goal was included in the printed instructions and available throughout the task. More specifically, the meanings of all the symbols were provided in the instructions, and the goal was thus device-embedded. It should be noted that the symbols were not chosen arbitrarily. All of them had some similarities with the furniture they symbolize. For instance, a single bed was represented by an elongated rectangle and a table by a square. It was therefore possible for participants to guess the meaning of a given symbol without consulting the instructions.
During the retro-conversion there were very few affordances, as the only two possible actions were halting the retro-conversion process by clicking on the pause button, and viewing the range of possible corrections for a given symbol by clicking directly on it. These relation action-effects were explained in the instructions, but in any case the pause button was displayed on the screen throughout the task and there was no ambiguity as to its function. The aim of the participants was to match the goals (relevant interpretations described in the printed instructions) with the state of the system (interpretations displayed on the screen), that is, to detect and correct errors of interpretation. This task therefore involved implementing a semantic matching strategy. To do this, participants had to compare the constantly evolving state (i.e., the interpretations gradually performed by the software) with the goals. As they were dealing with a continuous flow of
information, they had to act quickly. Whenever they detected a mismatch between goal and state, they either clicked the pause button or directly on the symbol in need of correction, and a window opened, displaying the possible interpretations of the selected symbol.
In the IS condition, whenever the prototype detected a particularly low likelihood score for an interpretation displayed on the screen (i.e., a high risk of misinterpretation), it automatically stopped and asked the user to confirm or correct it (see Fig. 2). By so doing, the software provided the user with a plan (i.e., a set of specific areas to check in a given order). Thus, a plan-following strategy could be implemented by users in parallel with the semantic matching strategy. Whenever the user signals an error, the software suggests several corrections and the user has to select one of them.
Figure 2. Example of software solicitation. The software asks if this interpretation is an error (left), and it suggests other interpretations (right).
Interaction.
2.5. Procedure
An architectural floor plan was displayed on the screen. This plan was then
interpreted by the prototype and participants were asked to correct interpretation errors. Each participant thus checked four different plans (see Fig. 3) in the same experimental condition. The order of presentation of the four plans was counterbalanced within each experimental group in order to cancel any effect of plan difficulty. Thus, each of the four plans used in this experiment was used the same number of times, in each of the 24 possible orders. Participants did not receive any feedback about their performance between plans.
Figure 3. 2D architectural floor plans used in the experiment
Before beginning the task, the participants were asked to carefully read through the instructions. They then monitored the retro-conversion process and corrected any errors they detected. At the end of this process, they had to state whether or not they had consulted the instructions during the interaction. Finally, participants were asked to answer a questionnaire measuring their trust or distrust in the system (Jian et al., 2000). This questionnaire consisted of 12 items. Half of them probed trust in the system (e.g., “The system is reliable”) and half probed distrust (e.g., “The system is deceptive”). For each item, the participants were asked to specify their level of agreement on a 7-point Likert-like scale ranging from 1 (Not at all) to 7 (Extremely).
The factors manipulated in this study were condition and training. Condition was a categorical between-participants variable with two modalities (WIS and IS), and training was an ordinal within-participants variable with four modalities denoting the successive trials. The two dependent variables were task duration and corrected errors. We
distinguished between two types of error: the four errors that the system spotted in each plan and the two errors that it did not spot in each plan. Because of this distinction, the
Interaction.
number of errors in each category was low, making it unlikely that the scores could be distributed in order to allow for the comparison of variances and means. These variables were therefore recoded as binomial variables, with 0 signifying at least one error in the plan, and 1 the absence of this error type in the plan. Depending on the variable, the zero indicated the absence of either a signaled error or an unsignaled error.
3. RESULTS
3.3. Task duration
As the times were continuous values bounded by a minimum but not a maximum, and as we were seeking to assess the effects of a between-participants variable (condition) and a within-participants variable (training), we modeled times with a gamma distribution in a repeated-measure framework using generalized estimating equations (Ballinger, 2004; Ghisletta & Spini, 2004).
There were significant main effects of training, Wald χ2(3, N = 191) = 77.619, p < .001, and condition on task duration, Wald χ2(1, N = 191) = 4238, p = .040. (see Fig. 4). By contrast, there was no significant interaction between training and condition, Wald χ2(3, N = 191) = 5.534, p = .137. There was no difference in the time it took the software to analyze each plan, either in the two conditions or in the four successive trials. The differences in task durations therefore stemmed from differences in correction duration.
Figure 4. Mean task duration (and standard deviation) as a function of condition and trial number.
3.4. Errors
Errors spotted by the system
0 50 100 150 200 250 300 1st 2nd 3rd 4th WIS IS Task duration (seconds)
Interaction.
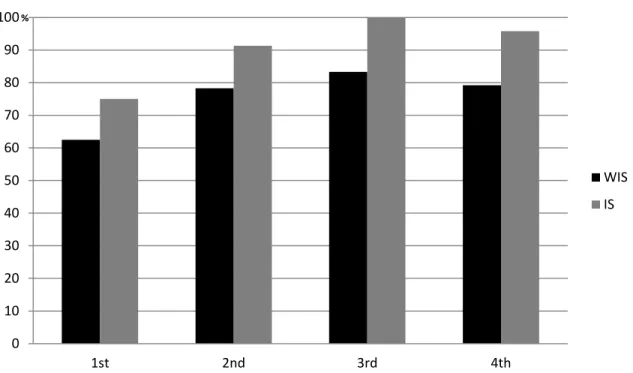
The proportion of errors flagged up by the system that were successfully corrected by the participants was calculated in relation to training and condition, using a logistic regression model with repeated measures. There were significant main effects of training, Wald χ2(3, N = 191) = 410.325, p < .001, and condition on the proportion of errors spotted that were corrected, Wald χ2(1, N = 191) = 106.589, p < .001 (see Fig. 5). By contrast, there was no significant interaction between the order and condition variables, Wald χ2(2, N = 191) = 1.321, p = .517. This result is consistent with H1, which stated that errors highlighted by the system would be corrected by a higher proportion of participants than errors that the system missed.
Figure 5. Percentage of participants who corrected all the errors spotted by the system as a function of condition and trial number.
Errors not spotted by the system
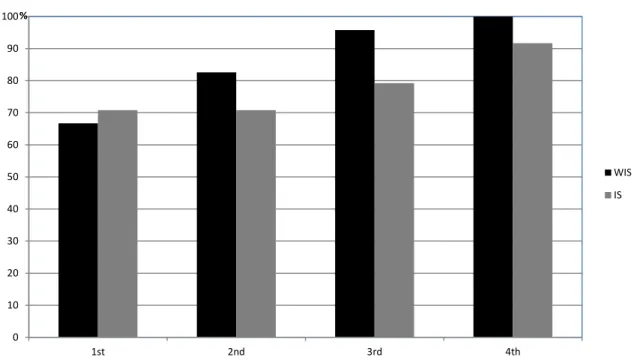
The proportion of errors not spotted by the system that were successfully corrected was calculated in relation to training and condition using a logistic regression model with repeated measures. There were significant main effects of training, Wald χ2(3, N = 191) = 270.145, p < .001, and condition on the proportion of corrected errors that had not been flagged up by the system, Wald χ2(1, N = 191) = 101.186, p < .001. In addition, the interaction between training and condition was significant, Wald χ2(2, N = 191) = 603.430, p < .001. In Figure 6, we can see that the superiority of the WIS group only emerged from the second plan onwards. This result is consistent with our hypothesis that requests for user input generate overconfidence (H2) which, in turn, has a negative impact on the detection of unspotted errors.
Figure 6. Percentage of participants who corrected all the unspotted errors as a function of condition and trial number
0 10 20 30 40 50 60 70 80 90 100 1st 2nd 3rd 4th % WIS IS
Interaction.
A complementary analysis comparing the proportions of participants who corrected all the errors failed to reveal any significant difference between the WIS group (65.28%) and the IS group (67.73%), Wald χ2(1, N = 191) = .064, p = .800. As the condition variable had inverse effects on error correction, depending on whether or not the error had been spotted by the system, when no distinction was made between these two types of errors, no difference emerged.
3.5. Degree of trust in the automated system
Because we had translated the items used to measure trust and distrust into French for the purposes of our experiment, we conducted a confirmatory factor analysis to ensure that we found the same factor structure as Jian et al. (2000). This analysis confirmed the one-dimensionality of trust, χ2 = 20.15, p = 0.13, RMSEA = 0.1, and distrust, χ2 = 9.33, p = 0.41, RMSEA = 0.03. Moreover, when we calculated Cronbach’s alpha to assess the items’ internal consistency, we found high values for both trust (α = .87) and distrust (α = .74).
We ran Levene’s test to ensure that the variances could be considered as equal, a necessary condition to use analysis of variances (ANOVA). Levene’s test on the
distribution of distrust scores revealed acceptable homoscedasticity, F(1, 46) = .002, p = .966. . A one-way ANOVA showed no statistically significant difference between the WIS and IS groups, F(1, 46) = .961, MSE = .973, p = .332 (see Fig. 7). Levene’s test on the distribution of trust scores also revealed acceptable homoscedasticity, F(1, 46) = .006,
p = .936. A one-way ANOVA revealed the statistically significant superiority of trust in
the IS group compared with the WIS group, F(1, 46) = 5.713, MSE = 5.685, p = .021. This result is consistent with H2, in that the participants in the IS group had greater confidence in the system than the participants in the WIS group.
Figure 7. Means and standard deviations for the trust and distrust scores
0 10 20 30 40 50 60 70 80 90 100 1st 2nd 3rd 4th % WIS IS
Interaction.
Distrust Trust
M SD M SD
WIS 3.94 1.02 3.76 .93
IS 4.22 1.00 4.45 1.07
4. DISCUSSION AND CONCLUSION
The first objective of this study was to test the predictive power of the resources model for a task of supervising an automated process. The second objective was to assess the contribution of the subjective dimension trust to modeling this type of task. Our first hypotheses (H1) derived from the resources model were validated by our results. H1 predicted that participants who were asked to provide input would be better at correcting the errors spotted by the system than participants who were not asked for their input. Participants in the IS group were significantly more likely to correct all the errors that were flagged up than participants in the WIS group. In the WIS condition, participants used the semantic matching strategy, which consists in matching the state of the system with the goals in order to detect errors. In the IS condition, the software provided participants with a plan, by flagging up potential errors during the retro-conversion process. This plan shows the participants each symbol they must check and informs when they have to do it. This enabled them to implement a plan-following strategy for checking each successive interpretation provided by the software. However, this strategy was implemented in conjunction with the semantic matching strategy, for even in the IS condition, some unsignaled errors were corrected. This result is also coherent with the findings of Wiegmann et al. (2006), who observed an improvement in target detection performances when the system cued the presence or absence of targets with a 90% hit rate.
The resources model was originally intended to allow the modeling of HCIs from a distributed cognition perspective (Wright et al., 1996; Wright et al., 2000). It has already been applied to Microsoft’s Excel spreadsheet application by its authors as an example (Wright et al., 1996), as well as to an air traffic control task (Fields et al., 1998) and even to the design of a virtual environment (Smith et al., 1999), and many recent publications have described modeling with the resources model (e.g., Harrison et al., 2009; Mehrnejad et al., 2011; Rajkomar & Blandford, 2011). Here, the application of this model to a task of supervising an automated retro-conversion process bore fruit owing to the distribution of resources involved in supervision. The resources model thus provides a relevant analytical framework for this type of task, although it does not explain all the results, as some are linked to subjective variables. For instance, in our study, the IS group corrected fewer unspotted errors than the WIS group. This difference which is coherent with our third hypothesis only emerged from the second plan onwards. The differences in the level of trust between the IS and WIS conditions stemmed from the degree of relevance of the requests for user input. As there is no difference between both groups before the
beginning of the first plan analysis, we assume that trust levels were the same in both groups at the beginning of the experiment. Therefore, this trust level gradually changed in the course of the interaction. At the start of the task, participants had no experience of the software. Their trust had therefore not been affected and should have been the same in
Interaction.
both groups. In accordance with our second hypothesis, the level of trust measured at the end of the task differed between the two groups. This means that the change in the level of trust took place during the task. This idea is consistent with the description of trust as a dynamic phenomenon that is constantly changing (Lee & Moray, 1992). Nevertheless, in the absence of measures of trust levels after each plan, it is impossible to be sure that the change in trust was a gradual process in this experiment. In addition, the IS group trusted the system more than the WIS one did. It seems that the requests for input increased the participants’ confidence, such that it generated a gullibility error (Fogg & Tseng, 1999). The participants’ confidence in the machine undoubtedly affected their interaction strategy, as they presumably felt that the system was capable of effectively flagging up all the potential errors. Thus, the gradually appearing negative effect of sollicitations on the detection of unsignalled errors suggests that the participants using the plan-following strategy partially neglected the semantic matching strategy because of the increasing trust. They were less vigilant in searching for errors that were unreported. Because of the trust, they tend to consider that following the plan provided by the software is sufficient to detect the errors.
Moreover, 79% of the participants in the WIS group stated that they consulted the printed instructions during the task, compared with just 46% in the IS group. When users can choose between several strategies to perform a given task, the trust they feel may influence the choices they make. A high level of trust encourages users to select
strategies that are based more on information from the software. Conversely, a low level of trust presumably encourages users to select strategies that make the result less
dependent on the software’s judgments. Globally, we assume that participants tend to memorize the instruction while reading them during the task. This is coherent with the learning effect obtained for the task duration and error correction.
The IS participants believed that the system was more reliable and that they therefore had less need to monitor its interpretations and thus check the instructions. Wiegmann et al. (2006)’s results did not distinguish between the images in which the system cued the target and those in which it did not. In addition, the authors showed that when a judgment made by the automatic aid was consistent with the participants’ response, they expressed a higher degree of confidence in their response than when the judgment was discordant. This shows that the participants took the system’s advice into account and thus placed a greater degree of faith in it. If the system’s judgment was trusted in Wiegmann et al. (2006)’s experiment, as it was in ours, the participants who were provided with assistance were possibly less accurate in detecting targets when they were not cued by the system than participants who received no such assistance.
Because Wiegmann et al. (2006) also did not distinguish between performances on the images in which the system’s cuing was correct and those for which no assistance was given despite the presence of a knife, they may have missed a negative effect of the automated aid on those images that did not generate assistance. Overall, the results of our study are consistent with the resources model, showing that it can have both a predictive and a prescriptive value for tasks involving the supervision of an automated process. It is, however, important to stress that it focuses on information distributed across the system,
Interaction.
and does not include subjective dimensions. Faith in the system is an important variable in HCI, and was needed to explain our results. Therefore, the predictive nature of the resources model could be improved if it incorporated subjective aspects. Some experiments and design projects using the resources model may yield erroneous conclusions or design choices owing precisely to the model’s failure to take subjective factors into account.
The main limitation of the present study was that the comparison was based on the straightforward absence or presence of a system for requesting input. To confirm our interpretation of the results, we would therefore need to vary the relevance of the requests and examine the impact of these variations on participants’ trust and performance. More relevant requests would improve error correction rates, but by the same token, the attendant increase in confidence in the system would reduce the detection of unreported errors. Conversely, less relevant ones would mean that fewer errors were corrected with the help of the system, and users would also pay more attention to checking the rest of the plan.
The results of the present study could lead to a number of concrete interface design recommendations for CAD, beautification, retro-conversion or even target detection software. Our study shows that the introduction of interruptions by the system to ask for user input when there is a risk of error has benefits, but also disadvantages. On the one hand, it can save time and improve the identification of some types of errors. On the other hand, it may result in other errors being missed. Concretely, software that incorporates this functionality does not necessary improve overall performance in tracking errors. The negative effect on some error detection may be problematic and difficult to anticipate. Our results suggest that the negative effect of requests for input could be compensated for by more training. Thus, performance could be maximized by implementing requests to users if the users perform the task frequently, in order to benefit from their training. In addition, as suggested by Lee and See (2004), a more appropriate level of confidence (i.e. that matches with the level of reliability of the software) may be obtained by
communicating the software’s actual performance to the user. For example, the
instructions could have included the information that, on average, one third of the errors made by the software are not signaled. This type of objective information would ensure that the level of trust corresponded to the software’s degree of reliability.
Finally, the value of this type of assistance seems to be largely dependent upon its accuracy. The more accurate the assistance is in detecting targets, the smaller the set of targets that undergo the local negative effect. The results of our experiment do not allow us to say whether more accurate assistance is accompanied by greater trust by the user. Further research is therefore needed to investigate effects related to the accuracy of the assistance.
Interaction.
REFERENCES
Abe, G., Itoh, M., & Tanaka, K. (2002). Dynamics of drivers' trust in warning systems. 17th IFAC
World Congress, 5, p. 2002. Barcelona, Spain.
Ahmed, S., Liwicki, M., Weber, M., & Dengel, A. (2011). Improved automatic analysis of architectural floor plans. Proceedings of the International Conference on Document
Analysis and Recognition, 864-868.
Alberdi, E., Povyakalo, A. A., Strigini, L., Ayton, P., & Given-Wilson, R. (2008). CAD in mammography: lesion-level versus case-level analysis of the effects of prompts on human descisions. International Journal of Computer Assisted Radiology and Surgery,
3(1-2), 115-122.
Ballinger, G. A. (2004). Using generalized estimating equations for longitudinal data analysis.
Organizational Research Methods, 7(2), 127-150.
Bastien, J. M., & Scapin, D. L. (1993). Ergonomics criteria for the evaluation of human-computer
interfaces (Technical Report). Rocquencourt: Institut National de Recherche en
Informatique et en Automatique.
Blandford, A., & Furniss, D. (2006). DiCoT: A methodology for applying distributed cognition to the design of team working systems. Proc. DSVIS 2005.
Chiang, Y.-Y., & Knoblock, C. A. (2013). A general approach for extracting road vector data from raster maps. International Journal on Document Analysis and Recognition, 16(1), 55-81. Doherty, G., Campos, J., & Harrison, M. D. (2008). Resources for situated actions. In N. Graham
& P. Palanque (Eds.), Interactive systems: Design, specification and verification (Vol. 5136, pp. 194-207). Springer-Verlag.
Fields, B., Wright, P. C., & Harrison, M. D. (1997). Objectives, strategies and resources as design drivers. Proceedings of Human Computer Interaction: INTERACT'97, 14-18.
Fields, B., Wright, P. C., Marti, P., & Palmonari, M. (1998). Air traffic control as a distributed cognitive system: A study of external representations. ECCE9: Proceedings of the Ninth
European Conference on Cognitive Ergonomics, 85-90.
Fleury, S., & Jamet, E. (2013). Facilitate the comparision of multiple visual information on the screen: the example of the electronic architectural plan correction. Applied Ergonomics. Fleury, S., Jamet, E., Loup-Escande, E., Ghorbel, A., Lemaitre, A., & Anquetil, E. (2013a). Toward
Specifications for Automatic Recognition Software : An Example of a User-Centred Design. Journal of Software Engineering and Applications. 6(10A).
Interaction.
Fleury, S., Ghorbel, A., Lemaitre, A., Anquetil, E., & Jamet, E. (2013). User-centred design of an interactive off-line handwritten architectural floor plan recognition. ICDAR2013. Washington, USA
Fogg, B. J., & Tseng, H. (1999). The elements of computer credibility. Proceedings of CHI99, 80-87.
Ghisletta, P., & Spini, D. (2004). An introduction to generalized estimating equations and application to assess selectivity effects in a longitudinal study on very old individuals.
Journal of Educational and Behavioral Statistics, 29(4), 421-437.
Ghorbel, A., Almaksour, A., Lemaitre, A., & Anquetil, E. (2011). Incremental learning for interactive sketch recognition. Ninth IAPR International Workshop on Graphics
RECognition.
Ghorbel, A., Macé, S., Lemaitre, A., & Anquetil, E. (2011). Interactive competitive breadth-first exploration for sketch interpretation. International Conference on Document Analysis
and Recognition (ICDAR), (pp. 1195-1199).
Ghorbel, A., Lemaitre, A., & Anquetil, E. (2012). Competitive hybrid exploration for off-line sketches structure recognition. International Conference on Frontiers of Handwriting
Recognition. Bari, Italy.
Goh, J., Wiegmann, D. A., & Madhavan, P. (2005). Effects of Automation Failure in a Luggage Screening Task: A Comparison Between Direct and Indirect Cueing. Proceedings of the
Human Factors and Ergonomics Society 49th Annual Meeting, (pp. 492-496).
Harrison, M. D., Massink, M., & Latella, D. (2009). Engineering crowd interaction within smart environments. Proceedings of EICS'09. Pittsburgh.
Hoffman, R. R., Johnson, M., Bradshaw, J. M., & Underbrink, A. (2013). Trust in Automation.
Intelligent Systems, IEEE, 28(1), 84-88.
Hutchins, E. (1995). Cognition in the wild. Cambridge, MA: MIT Press.
Jian, J.-Y., Bisantz, A. M., & Drury, C. G. (2000). Foundations for an empirically determined scale of trust in automated systems. International Journal of Cognitive Ergonomics, 4(1), 53-71.
Khasawneh, M. T., Bowling, S. R., Jiang, X., Gramopadhye, A. K., & Melloy, B. J. (2003). A model for predicting human trust in automated systems. Proceedings of the 8th Annual
International Conference on Industrial Engineering - Theory, Applications and Practice,
(pp. 216-222). Las Vegas.
Lee, J. D., & See, K. A. (2004). Trust in automation: Designing for appropriate reliance. Human
Interaction.
Lee, J., & Moray, N. (1992). Trust, control strategies and allocation of function in human-machine systems. Ergonomics, 35(10), 1245-1270.
Lu, T., Tai, C. L., Su, F., & Cai, S. (2005). A new recognition model for electronic architectural drawings. Computer Aided Design, 37, 1053-1069.
Mehrnejad, M., Toreini, E., & Ghaemi Bafghi, A. (2011). Security analyzing and designing GUI with the resources model. Proceedings of the 8th International ISC Conference on
Information Security and Cryptology, 14-15.
Merritt, S. M., & Ilgen, D. R. (2008). Not all trust is created equal: Dispositional and history-based trust in human-automation interactions. Human Factors: The Journal of the Human
Factors and Ergonomics Society, 50(194), 194-210.
Miller, C., & Parasuraman, R. (2007). Designing For Flexible Interaction Between Humans and Automation: Delegation Interfaces for Supervisory Control. Human Factors, 49(1), 57-75. Norman, D. A. (1999). Affordance, conventions, and design. Interactions, 6(3), 38-43.
Ouyang, T. Y., & Davis, R. (2009). A visual approach to sketched symbol recognition. Proceedings
of the 21st International Joint Conference on Artificial Intelligence, 1463-1468. Morgan
Kaufmann.
Parasuraman, R., & Manzey, D. H. (2010). Complacency and biais in human use of automation: An attentional integration. Human Factors: The Journal of the Human Factors and
Ergonomics Society, 52(3), 381-410.
Rajkomar, A., & Blandford, A. (2011). Distributed cognition for evaluating healthcare technology.
Proceedings of the 25th BCS Conference on Human-Computer Interaction, 341-350.
British Computer Society.
Skitka, L. J., Mosier, K. L., & Burdick, M. (1999). Does automation biais decision-making?.
International Journal of Human-Computer Studies, 51(5), 991-1006.
Smith, S. P., & Hart, J. (2006). Evaluating distributed cognitive resources for wayfinding in a desktop virtual environment. 1st IEEE Symposium on 3D User Interfaces. Alexandria. Smith, S., Duke, D., & Wright, P. (1999). Using the resources model in virtual environment
design. Workshop on User Centered Design and Implementation of Virtual Environments, 57-72.
Wiegmann, D., McCarley, J. S., Kramer, A. F., & Wickens, C. D. (2006). Age and automation interact to influence performance of a simulated luggage screening task. Aviation,
Space, and Environmental Medicine, 77(8), 825-831.
Wright, P. C., Fields, B., & Harrison, M. D. (1996). Distributed information resources: A new approach to interaction modelling. Proceedings of ECCE8: Eighth European Conference
Interaction.
Wright, P. C., Fields, R. E., & Harrison, M. D. (2000). Analysing human-computer interaction as distributed cognition: The resources model. Human Computer Interaction, 15(1), 1-42.
Interaction.
FOOTNOTES
1
This software is under development as part of the "MobiSketch" French National Research Agency (ANR) project, within the framework of the “Content and Interaction” program (ref. 09-CORD-015).
Interaction.
FIGURE CAPTIONS
Figure 1. Photograph of the interface with a fully interpreted plan
Figure 2. Example of software solicitation. The software ask if it is an error (left), and it suggest others interpretations (right).
Figure 3. 2D architectural floor plans used in the experiment
Figure 4. Mean task duration (and standard deviation) as a function of format and number of trials.
Figure 5. Percentage of participants who corrected all the errors spotted by the system as a function of format and number of trials.
Figure 6. Percentage of participants who corrected all the unspotted errors as a function of format and number of trials
Interaction.
FIGURES
Interaction.
Figure 2. Example of software solicitation. The software asks if this interpretation is an error (left), and it suggests others interpretations (right).
Interaction.
Interaction.
Figure 4. Mean task duration (and standard deviation) as a function of format and number of trials 0 50 100 150 200 250 300 1st 2nd 3rd 4th WIS IS Task duration (seconds)
Interaction.
Figure 5. Percentage of participants who corrected all the errors spotted by the system as a function of format and number of trials
0 10 20 30 40 50 60 70 80 90 100 1st 2nd 3rd 4th % WIS IS
Interaction.
Figure 6. Percentage of participants who corrected all the unspotted errors as a function of format and number of trials
0 10 20 30 40 50 60 70 80 90 100 1st 2nd 3rd 4th % WIS IS
Interaction.
Figure 7. Means and standard deviations for the trust and distrust scores
Distrust Trust
M SD M SD
WIS 3.94 1.02 3.76 .93
Interaction.
NOTES
Support. This study was conducted as part of the “MobiSketch” French National