Electrochemical Dissolution and Passivation
Phenomena of Gold Cyanidation from Roasted
Ore In the Presence of Iron Oxides
Thèse
Ahmet Deniz Bas
Doctorat en génie des matériaux et de la métallurgie
Philosophiæ doctorat (Ph. D.)
Québec, Canada
Electrochemical Dissolution and Passivation
Phenomena of Gold Cyanidation from Roasted
Ore In the Presence of Iron Oxides
Thèse
Ahmet Deniz Bas
Sous la direction de :
iii
Résumé
Cette thèse de doctorat est divisée en des études sur l'or pur; la corrosion galvanique; et la polarisation de l'or en présence d'oxydes de fer contenus dans un minerai d'or grillé. La dissolution de l’or diminue en présence de magnétite et, augmente en présence d’hématite et de maghémite. Des produits de corrosion et des couches adsorbées ralentissent la dissolution d’or. Pour les études sur l’or pur, une augmentation du pH de 10 à 11 a réduit de 35 fois la densité de courant, alors qu'elle a augmentée de 32 fois en diminuant l'agitation de 100 à 60 tr/min. Les études potentiostatiques, à trois potentiels anodiques, montrent que l'augmentation de la concentration de cyanure, du pH, et du potentiel diminuent la densité de courant. Des films d'oxydes d'or ont été identifiés par XPS. La mesure du bruit électrochimique est un outil prometteur pour estimer la vitesse de corrosion in situ.
Pendant les tests de corrosion galvanique, utilisés en mode ampèremètre zéro-résistance, les électrodes minérales testées ont eu un effet négatif sur la lixiviation de l’or selon l’ordre décroissant : magnétite, magnétite-hématite avec des surfaces égales, et minerai d'or grillé. Cependant, la maghémite et l'hématite ont eu un effet positif. La concentration d'ions solubles et la vitesse de diffusion pourraient retarder ou favoriser la dissolution. L’argent a été identifié par XPS sur la surface de l’or, suggérant, une passivation partielle.
À partir des études de polarisation potentiodynamique, l'hématite, en tant que composé système “combiné d'anode Au-hématite”, favorise le courant de corrosion anodique de 12%, alors que la magnétite abaisse le courant (de 11%). Les études de deux cellules séparées ont été réalisées pour révéler l’influence des ions solubles dans la dissolution de l’or. Le balayage du potentiel circuit ouvert jusqu’à vers des valeurs cathodiques en présence d'oxygène atmosphérique et de cyanure montre des vitesses de corrosion, déduites des pentes de Tafel, sont proches des à valeurs industrielles. La vitesse de lixiviation de l'or diminue de 40% en présence de pulpe de magnétite, alors que celle-ci augmente, respectivement de 25% et 10% pour l'hématite et la maghémite. MEB-EDX confirment l'effet négatif de la magnétite par la présence d’une forte accumulation d’oxydes de fer sur la surface de l'or. De faibles quantités d'or ont été identifiées sur les particules de magnétite par XPS. La séparation magnétique des résidus de cyanuration a été suivie la caractérisation électrochimique du concentré et des rejets.
iv
Abstract
This Ph.D. thesis is divided into studies using pure gold; galvanic corrosion; and gold polarization in presence of iron oxides of roasted gold ore. Gold dissolution decreases in the presence of magnetite, and increases in the presence of hematite, and maghemite. The corrosion products and adsorbed layers lead to a slowdown of gold dissolution. For pure gold study, increasing pH from 10 to 11 results in a current density lower by 35 times, while it increases by 32 times with decreasing agitation from 100 to 60 rpm. At three anodic potentials, potentiostatic studies show that increasing cyanide concentration, pH, and potential decrease the current density. Au oxides have been identified by XPS. Electrochemical noise measurement is promising tool with its in-situ corrosion rate
estimation.
In galvanic corrosion studies, employing zero-resistance ammeter (ZRA) mode, the tested mineral electrodes show a negative effect on gold leaching in decreasing order: magnetite, magnetite-hematite with equal surfaces, and roasted gold ore. However, maghemite and hematite show a positive effect. Concentration of soluble ions and diffusion rate could retard or promote gold dissolution. Silver has been identified by XPS on gold surface suggesting partial passivation.
In potentiodynamic polarization studies, hematite, as a part of the combined “Au-hematite anode” system promotes anodic corrosion current by 12%, while magnetite shows negative effect (11%). Two separate container tests have been considered to examine the influence of soluble ions on gold dissolution. Scanning from open circuit potential to more cathodic values in presence of atmospheric oxygen and cyanide shows corrosion rates obtained from Tafel slopes close to industrial practice. Gold leach rate decreases by 40% with magnetite slurry, whereas it increased by 25% and 10% for hematite and maghemite, respectively. SEM-EDS findings have confirmed the negative effect of magnetite due to the high accumulation of iron oxides on the gold surface. Low amounts of gold in magnetite particles are identified by XPS. Magnetic separation of leach tailings has been followed by electrochemical characterisation of the concentrate and the residues.
v
Table of Contents
Résumé ... iii Abstract ... iv Table of Contents ...v List of Tables ... ix List of Figures ...x Acknowledgements ... xvi Foreword ... xviii Chapter 1 Introduction ...11.1 State of the Technology ...2
1.2 Scientific Problem and Objectives of This Project ...2
1.3 Description of the Strategy Adapted to This Ph.D. Thesis ...3
1.4 Key Contributions of This Ph.D. Project ...5
Chapter 2 Critical Review of Electrochemical Dissolution of Gold ...9
Résumé ...11
Abstract ...12
2.1 Leaching and Types of Gold Ores ...13
2.2 Electrochemical Dissolution of Gold ...14
2.3 Passivation Phenomenon and Inhibition of Gold Dissolution ...15
2.4 Electrochemical Methods Used in Gold Dissolution Studies ...17
2.4.1 Potentiodynamic polarization ...19
2.4.2 Cyclic Voltammetry (CV) ...24
2.4.3 Potentiostatic and Galvanostatic Polarization Methods ...25
2.4.4 Galvanic Corrosion by Zero Resistance Ammeter ...26
2.4.5 Electrochemical Noise Measurement (ENM) ...26
2.4.6 Scanning Reference Electrode Technique (SRET) ...28
2.4.7 Electrochemical Impedance Spectroscopy (EIS) ...28
2.5 Electrochemical Studies of Gold Cyanidation ...29
2.5.1 Pure Gold Studies ...29
2.5.2 Sulphidic Gold Ore Studies ...33
2.5.3 Oxidised Gold Ores Studies ...35
vi
2.6.1 Practical Implications ...38
2.6.2 The Mechanism of Dissolution Slowdown During Cyanidation ...43
Chapter 3 Electrochemical Behaviour of Pure Gold in Cyanide Solutions ...48
Résumé ...49
Abstract ...50
3.1 Introduction ...51
3.2 Experimental Conditions ...53
3.2.1 Ore Sample and Roasted Gold Ore Electrode Preparation ...53
3.2.2 Cyclic Voltammetry, Potentiodynamic, and Potentiostatic Tests Procedures ...53
3.2.3 Electrochemical Noise (EN) Measurement Test Procedure ...54
3.2.4 Procedure of Surface Characterization Test ...55
3.3 Results and Discussion ...55
3.3.1 CV without Agitation and Potentiodynamic Tests ...55
3.3.2 Effect of pH on Anodic Behaviour of Gold...62
3.3.3 Potentiostatic Tests at Different Anodic Potentials ...64
3.3.4 Electrochemical Noise Measurements (ENM) ...65
3.3.5 Surface Characterization...72
3.4 Conclusions ...73
3.5 Acknowledgements ...74
Chapter 4 Galvanic Interactions Between Gold and Iron Oxide Electrodes in Cyanide Solutions 75 Résumé ...76
Abstract ...77
4.1 Introduction ...78
4.2 Experimental...79
4.2.1 Ore Sample ...79
4.2.2 Material and Preparation of Electrodes ...80
4.2.3 Electrochemical Test Procedure ...81
4.3 Results ...81
4.3.1 Peak Determination by Cyclic Voltammetry (CV) ...81
4.3.2 Galvanic Dissolution of Gold ...83
4.4 Conclusions ...93
4.5 Acknowledgements ...94
vii
Résumé ...96
Abstract ...97
5.1 Introduction ...98
5.2 Experimental Conditions ...100
5.2.1 Roasted Gold Ore Sample ...100
5.2.2 Material and Preparation of Electrodes ...100
5.2.3 Electrochemical Test Procedures ...101
5.2.4 Conventional Cyanide Leaching ...104
5.3 Results and Discussion ...104
5.3.1 Dissolution Behaviour of Gold at Open Circuit Potentials (OCP) ...104
5.3.2 Potentiodynamic Polarization of Au, RGO, and Oxide Mineral Electrodes ...112
5.3.3 Effect of Leaching Parameters on Anodic Polarization of RGO Electrode ...114
5.3.4 Corrosion Rate of Au, RGO, and Combined Disc Electrodes ...120
5.4 Conclusions ...125
5.5 Acknowledgements ...127
Chapter 6 Electrochemical Interactions Between Gold and Iron Oxide Minerals ...128
Résumé ...129
Abstract ...130
6.1 Introduction ...131
6.2 Experimental Conditions ...133
6.2.1 Material and Preparation of Electrodes ...133
6.2.2 Electrochemical Procedures ...134
6.3 Results and Discussion ...136
6.3.1 Potentiodynamic Cathodic Polarization of Gold and Roasted Gold Ore ...136
6.3.2 Combined Anode Electrode Polarization (CAP) System ...138
6.3.3 Interpretation of Electrochemical Findings ...143
6.4 Conclusions ...153
6.5 Acknowledgements ...155
Chapter 7 Influence of Iron Oxide Slurries on the Dissolution of Gold Electrode ...156
Résumé ...157
Abstract ...158
7.1 Introduction ...160
viii
7.2.1 Ore Sample and Iron Oxide Minerals ...162
7.2.2 Electrochemical and Leaching Test Procedures ...163
7.2.3 Magnetic Separation Tests...164
7.3 Results and Discussion ...164
7.3.1 The Influence of Cyanidation on the Open Circuit Potential (OCP) of Au ...164
7.3.2 Corrosion Rate of Au by Cathodic Polarization and Conventional Leaching ...166
7.3.3 SEM-EDS, and XPS studies ...171
7.3.4 Cyanidation of RGO and Gold Recovery from Magnetic Concentrate ...173
7.3.5 Electrochemical Characterization of the Magnetic Concentrate and Tailings...177
7.3.6 Influence of Iron Oxides on Gold Dissolution ...182
7.4 Conclusions ...184
7.5 Acknowledgements ...185
Chapter 8 Conclusions and Recommendations ...186
8.1 Evaluation of Dissolution and Passivation Phenomena...187
8.2 Recommendations for Future Studies...191
References ...192
Appendix A Passive Behaviour of Gold in Sulphuric Acid Medium ...209
Appendix B Electrochemical Study of Gold Cyanidation in the Presence of Roasted Gold Ore and Its Associated Oxide Minerals ...211
Appendix C Complimentary Activities during the Doctoral Formation ...213
ix
List of Tables
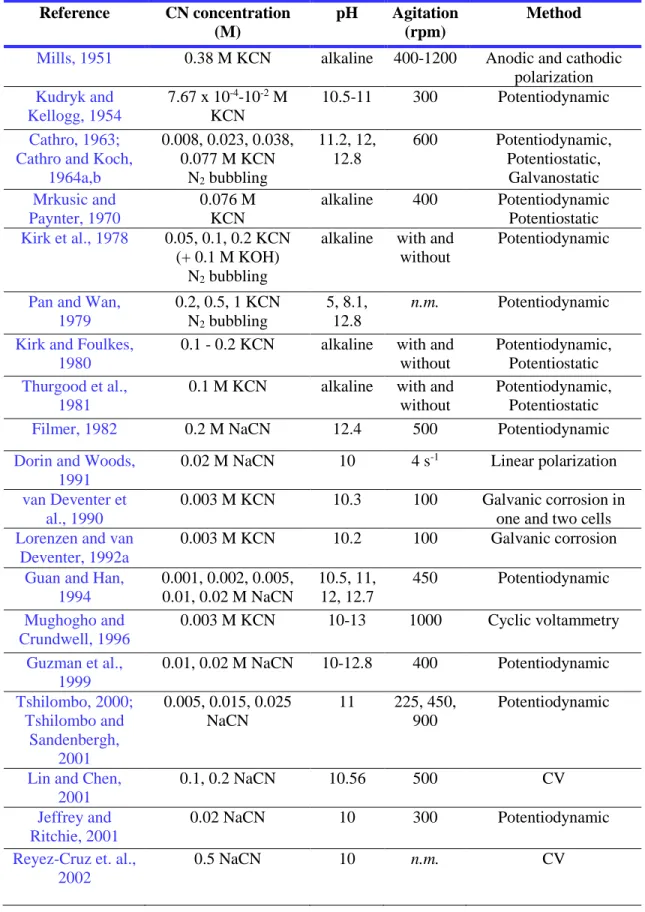
Table 2.1 A brief summary of the electrochemical methods used for gold cyanidation (continue
on the next page). ...18
Table 2.2 Gold anodic dissolution profiles at different conditions (Nicol, 1980). ...21
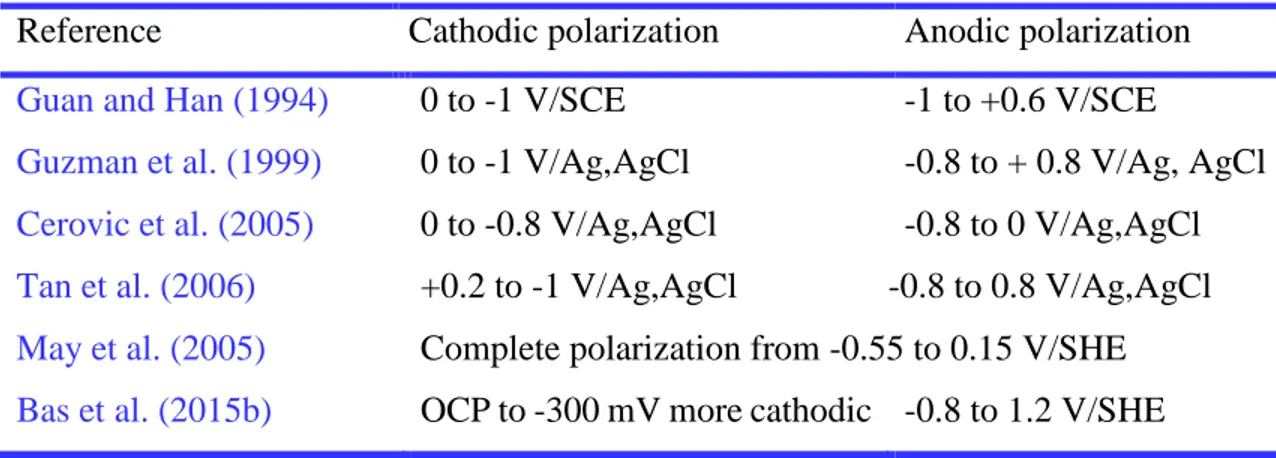
Table 2.3 Comparison of the polarization potential range from some selected papers. ...23
Table 2.4 Comparison of the peak current densities. ...31
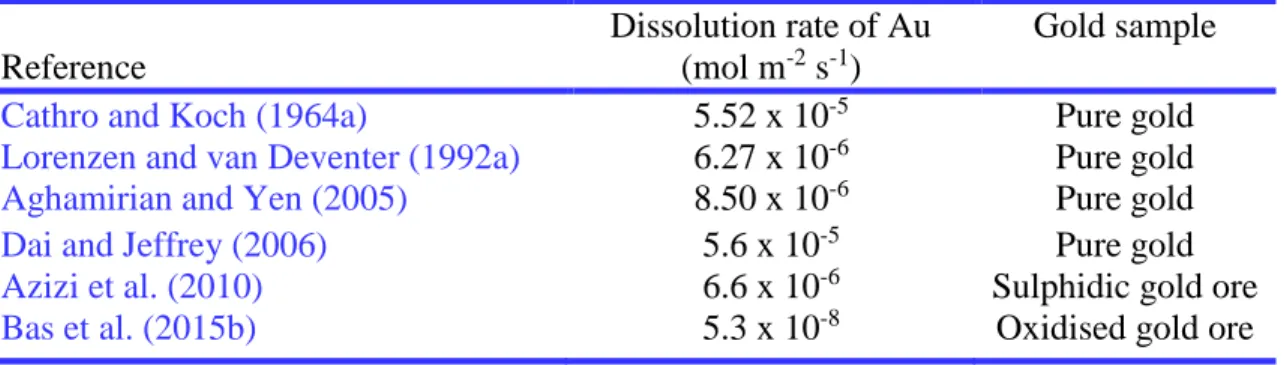
Table 2.5 Comparison of dissolution rates of gold from some selected papers. ...39
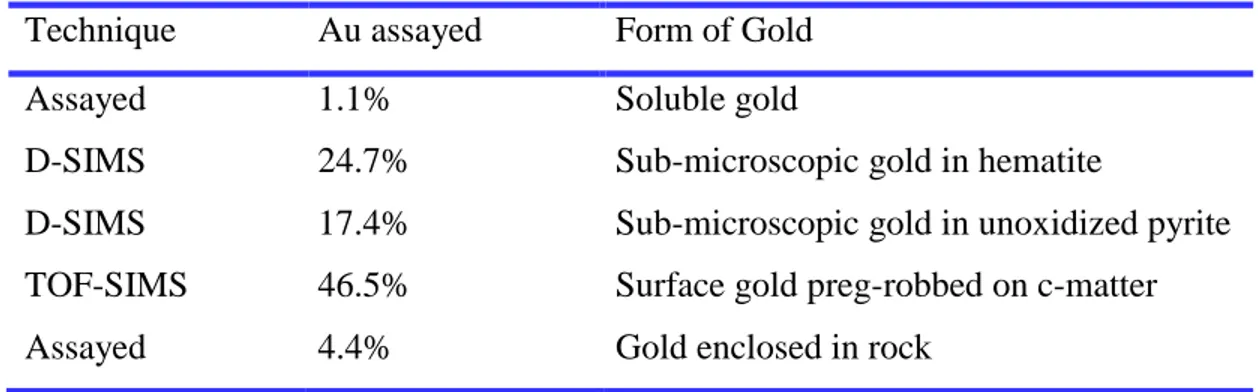
Table 2.6 Gold deportment results of carbon-in-leach tailings and the techniques used to analyse forms of gold (Total assayed gold = 3.4 g/L) (Dimov and Hart, 2014). ...45
Table 5.1 Corrosion potentials of different electrodes in absence and in presence of gold ore slurry in 0.04 M NaCN solution, pH 10.5 at 25 °C. ...105
Table 5.2 Dissolution rate (calculated from cathodic Tafel polarization slope) of electrodes (pure gold (Au) electrode with a surface of 1 cm2, roasted gold ore (RGO) electrode with a surface area of 4.9 cm2) (*1 is calculated by extrapolating Tafel slope to OCP for comparison). ...122
Table 6.1 Important electrochemical terms on gold polarization with disc electrodes. ...145
Table 7.1 Open Circuit Potential (OCP) (V/SHE) of electrodes for 2 minutes prior and after 4 h of leaching. ...165
Table 7.2 Corrosion rates of Au in different conditions (Pure Au electrode: 0.25 cm2). ...166
Table 7.3 Influence of lead nitrate on the cyanidation of roasted gold ore, pH: 10.5, NaCN: 0.01 M, 24 h. ...173
x
List of Figures
Fig. 1.1 A representative illustrations of the strategy adapted. ...3
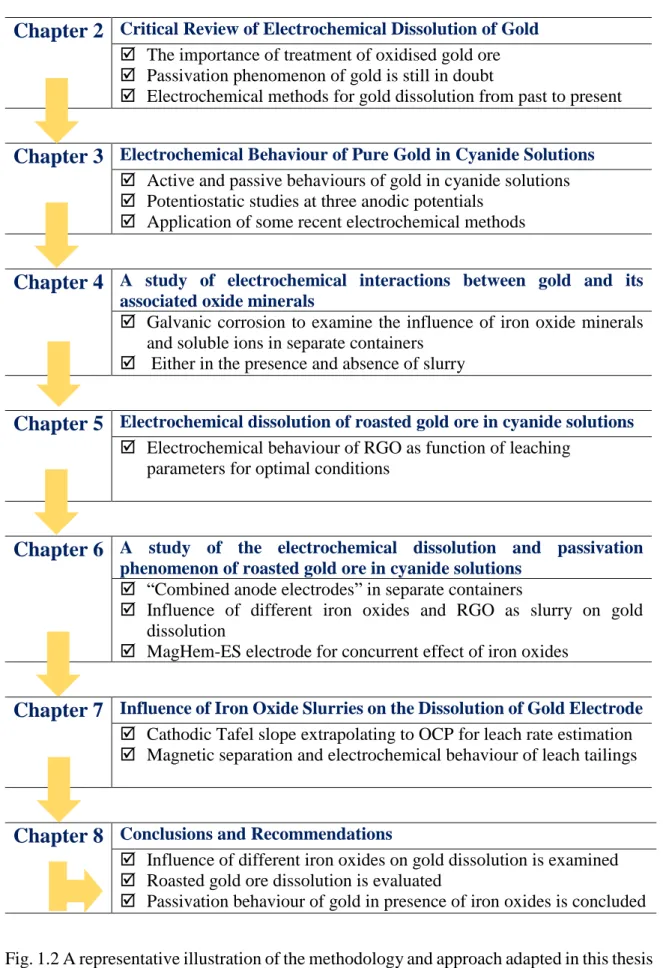
Fig. 1.2 A representative illustration of the methodology and approach adapted in this thesis ...8
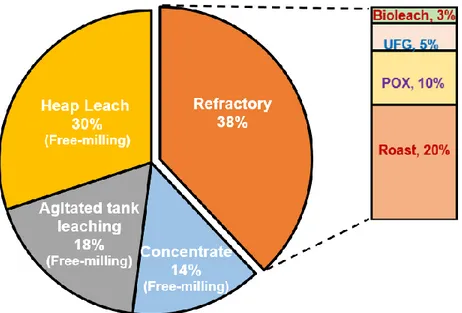
Fig. 2.1 Gold processing routes of the top 20 global gold producers in 2011 (Adams, 2016). ...14
Fig. 2.2 Cathodic and anodic Tafel polarization diagram (ASTM G3-89, 2006). ...20
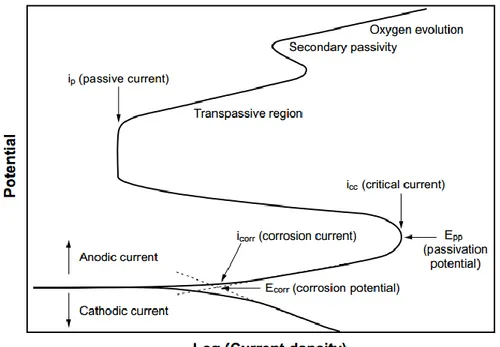
Fig. 2.3 Hypothetical polarization diagram for a passivable system with anodic and cathodic branches (ASTM G3-89, 2006). ...20
Fig. 2.4 Comparison of the gold anodic dissolution profiles (Nicol, 1980). ...21
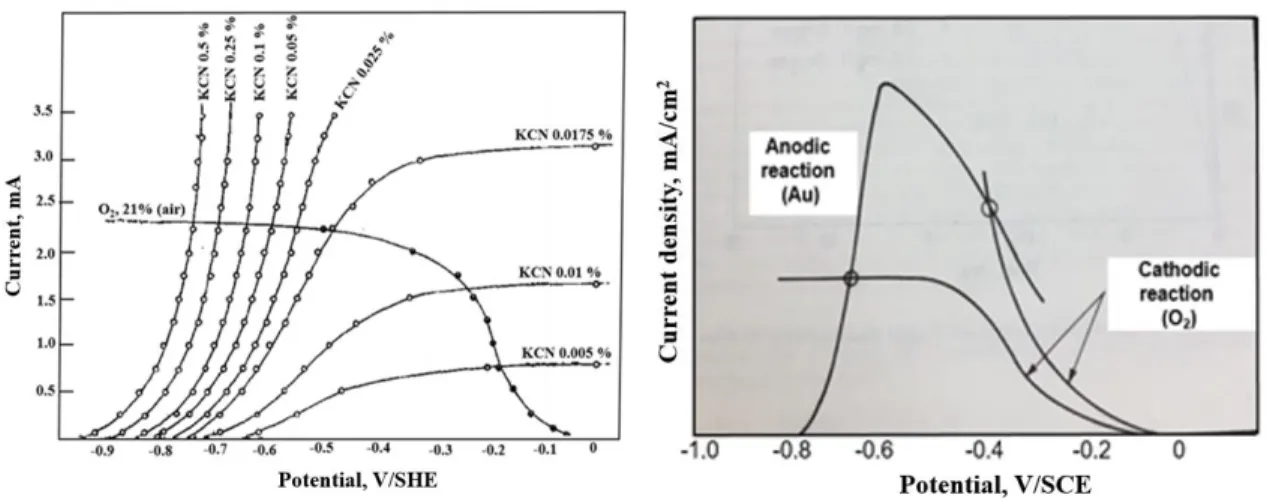
Fig. 2.5 Anodic (as function of cyanide concentration) and cathodic curves for gold dissolution (adapted from Kudryk and Kellogg, 1954). ...44
Fig. 2.6 Polarization curves showing passivation of the anodic reaction from the work of Mills (1951), retrieved and adapted from Cathro and Walkley (1961). ...44
Fig. 2.7 Superposition of reduction curves for ferric ion and of the anodic polarization curve of Type 410 stainless steel in M H2SO4. Curve (1) 0.01 M Fe3+ at 55 cm/sec, (2) 0.066 M Fe3+ at 55 cm/sec, and (3) 0.066 M Fe3+ at 100 cm/sec. In case (3) the limiting diffusion current density for the ferric ion is greater than the critical current density for the steel and the ferric ion therefore passivates the steel (adapted from Scully, 1966). ...47
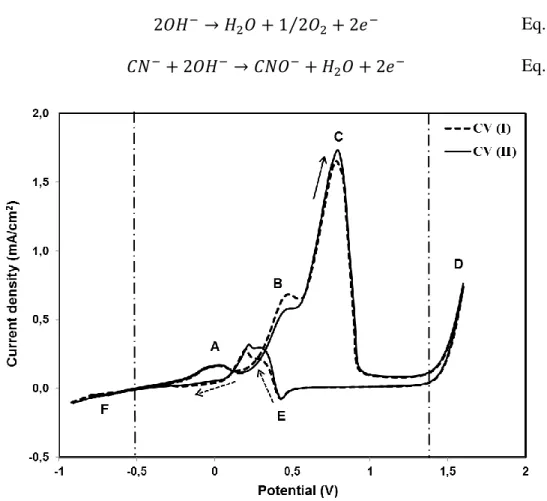
Fig. 3.1 Cyclic voltammetry of pure gold electrode (Au, 1 cm2) in the first two cycles (CV I and II) without agitation (dotted arrow indicates the return) in 0.04 M NaCN solution in oxygen-free conditions at pH 10.5. ...56
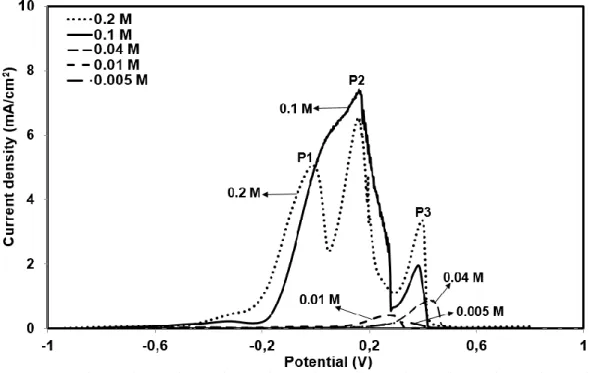
Fig. 3.2 Effect of NaCN concentration on anodic potentiodynamic behaviour of gold electrode (Au, 1 cm2) (NaCN: 0.005 - 0.2 M, pH 10.5, T: 25˚C, scan rate: 0.166 mV/s and argon bubbling). ...57
Fig. 3.3 Potentiodynamic and cyclic voltammetry test of pure gold electrode (Au, 1 cm2) at 100 rpm agitation in 0.04 M NaCN solution in oxygen-free conditions at pH 10.5. ...60
Fig. 3.4 Influence of oxygen on anodic potentiodynamic behaviour of pure gold (Au, 1 cm2) and compared to roasted gold ore electrode (RGO, 4.9 cm2) in solution with atmospheric oxygen, 100 rpm agitation in 0.04 M NaCN solution (pH 10.5), T: 25˚C, scan rate: 0.166 mV/s). ...61
Fig. 3.5 Effect of pH on the anodic potentiodynamic behaviour of gold electrode (Au 1 cm2) in 0.04 M NaCN solution at 100 rpm agitation (pH: 10-12), T: 25˚C, scan rate: 0.166 mV/s) (** 60 rpm agitation). ...62
xi
Fig. 3.6 Corrosion (dissolution) rates (icorr) of RGO (4.9 cm2) after 0.166 mV/s scan rate at different pH values (10.5-11.5) in 0.04 M NaCN electrolyte at 100 rpm agitation in duplicates (1. run and 2. run). ...63 Fig. 3.7 Effect of potential (1 and 1.4 V) on current changes in different cyanide concentrations
(0.04 and 0.1 M) using potentiostatic test (pH 10-11, T: 25˚C, scan rate: 0.166 mV/s, Argon bubbling) (a: pH 10 at 1 V 0.04M NaCN; b: pH 10 at 1.4 V 0.04M NaCN; c; pH 11 at 1 V 0.04M NaCN; d: pH 11 at 1.4 V 0.04M NaCN; e: pH 11 at 1 V in 0.1M NaCN; f: pH 11 at 1.4 V in 0.1M NaCN). ...64 Fig. 3.8 Potential (a) and current (b) noise recorded during 24 h immersion of gold electrode in
three concentrations of NaCN (0.01, 0.04 and 0.1 M) at pH 10.5. ...66 Fig. 3.9 Instantaneous measured 1/Rn for gold (Au 1 cm2) immersed in three concentrations of
NaCN (0.01, 0.04 and 0.1 M) and roasted gold ore (RGO 4.9 cm2) for comparison in 0.04 M NaCN at pH 10.5. ...67 Fig. 3.10 Recorded potential noise (a) and current noise (b) decay in time for two polarized gold
electrodes under potentiostaic conditions at 1 and 1.4 V during 16 h immersion in NaCN solution (0.04 M). ...69 Fig. 3.11 Potential noise (…) and current noise (—) for two polarized gold electrodes under
potentiostaic conditions applying one active potential (a) 0.3 V and two passive potentials (b) 1 V and (c) 1.4 V immersed in NaCN solution (0.04 M) after 16h. ...71 Fig. 3.12 X-ray photoelectron Spectroscopy (XPS) surface analysis for gold electrode after 2 h
potentiostatic in 0.1 M NaCN at 25oC, argon bubbling and magnetically stirring at 100 rpm. ...72 Fig. 4.1 Fe-oxides identified by SEM analysis from the received roasted gold ore sample. ...80 Fig. 4.2 Cyclic voltammetry (CV) of different electrodes; (a) Au (pure gold), (b) RGO (roasted
gold ore), (c) Mag (magnetite), (d) Hem (hematite) disc electrodes in 0.04 M NaCN solution at pH 10.5 with scan rate of 10 mV/s, argon bubbling onto the surface of electrolyte at 25 °C. ...82 Fig. 4.3 Potentiodynamic cathodic polarization of gold (Au), and roasted gold ore (RGO) with
scan rate of 0.166 mV/s at pH 10.5, 100-rpm agitation, atmospheric oxygen, 25 °C. .84 Fig. 4.4 The influence of agitation speed on the galvanic potential (a) and current (b) between
gold (Au) and roasted gold ore (RGO) electrodes, pH 10.5, 25 °C, cyanide conc. 0.01 M, 25 °C, saturated atmospheric oxygen, Au electrode surface area 0.25 cm2, RGO area 4.9 cm2. ...85
xii
Fig. 4.5 XPS surface image showing the presence of Ag on the surface of Au electrode after galvanic coupled with Au and RGO. ...86 Fig. 4.6 Galvanic couple potential and ZRA vs. time at 100 rpm agitation, pH 10.5, 0.01 M
cyanide conc., saturated atmospheric oxygen, 25 °C, (a) RGO (roasted gold ore electrode 4.9 cm2) and Mag (magnetite disc electrode 4.9 cm2); (b) RGO (roasted gold ore electrode 4.9 cm2) and Hem (hematite disc electrode 4.9 cm2). ...87 Fig. 4.7 The influence of agitation speed on the galvanic potential (a) and current (b) between
gold (Au) and magnetite electrodes, pH 10.5, 25 °C, cyanide conc. 0.01 M, 25 °C, saturated atmospheric oxygen, Au electrode surface area 0.25 cm2, Mag area 4.9 cm2. ...88 Fig. 4.8 SEM (a) and EDS (b) images of Au electrode surface after galvanic coupling with Mag
disc electrode, pH 10.5 at 100-rpm, cyanide conc. 0.01 M, 25 °C, saturated
atmospheric oxygen, Au electrode surface area 0.25 cm2, Mag area 4.9 cm2...89 Fig. 4.9 The influence of agitation speed on the galvanic potential (a) and current (b) between
gold (Au) and maghemite (Mgh) electrodes, pH 10.5, 25 °C, cyanide conc. 0.01 M, 25 °C, saturated atmospheric oxygen, Au electrode surface area 0.25 cm2, Mgh area 4.9 cm2. ...91 Fig. 4.10 The influence of agitation speed on the galvanic potential (a) and current (b) between
gold (Au) and MagHem-ES electrodes, pH 10.5, cyanide conc. 0.01 M, 25 °C, saturated atmospheric oxygen, Au electrode surface area 0.25 cm2, MagHem-ES area 4.9 cm2. ...91 Fig. 4.11 The influence of agitation speed on the galvanic potential (a) and current (b) between
gold (Au) and hematite (Hem) electrodes, pH 10.5, cyanide conc. 0.01 M, 25 °C, saturated atmospheric oxygen, Au electrode surface area 0.25 cm2, Hem area 4.9 cm2. ...92 Fig. 5.1 Schematic illustration of Scanning Reference Electrode Technique (SRET) set-up (CE:
counter electrode; RE: reference electrode; WE: working electrode). ...103 Fig. 5.2 Instantaneous measured corrosion rate (1/Rn) for roasted gold ore and pure gold
electrodes immersed in NaCN (0.04 M) solution by ENM after potentiodynamic polarization followed by potentiostatic test (2h) in absence of agitation, pH 10.5, 25 °C. ...108 Fig. 5.3 3-D SRET potential images at different immersion times in 0.04M NaCN solution at pH
10.5 and 25°C for (a) Au at 1h, (b) Au at 8 h, (c) Au at 16 h; (d) RGO at 1h, (e) RGO at 8 h and (f) RGO at 16 h. ...110
xiii
Fig. 5.4 QEMF corrosion cell vs. immersion time in 0.04M NaCN solution at pH 10.5 and 25°C for pure gold (Au) and roasted gold ore (RGO) disc electrodes. ...111 Fig. 5.5 Potentiodynamic cathodic polarization of different electrodes with scan rate of 0.166
mV/s in 0.04M NaCN electrolyte at 100 rpm agitation at atmospheric oxygen, pH 10.5, 25 °C (Au** indicates the cathodic polarization by scanning from -300 mV to Ecorr). ...112 Fig. 5.6 Potentiodynamic anodic polarization of different electrodes with scan rate of 0.166 mV/s
in 0.04M NaCN electrolyte at 100 rpm agitation, pH 10.5, 25 °C (Au: 1 cm2; other electrodes 4.9 cm2). ...113 Fig. 5.7 Effect of NaCN concentration on the polarization of RGO with scan rate of 0.166 mV/s
at pH 10.5 at 100 rpm agitation, 25 °C. ...115 Fig. 5.8 Effect of pH on the anodic polarization of RGO electrode at 0.166 mV/s scan rate in 0.04
M NaCN electrolyte at the agitation of 100 rpm, 25 °C. ...117 Fig. 5.9 Effect of agitation (1: 100 rpm; 2: 250 rpm; and 3: 400 rpm) on the anodic polarization
curve of pure gold (Au) electrode with scan rate of 0.166 mV/s in 0.04 M NaCN solution, pH 10.5, 25 °C. ...118 Fig. 5.10 Effect of agitation (100, 250 and 400 rpm) on the anodic polarization curve of RGO
with scan rate of 0.166 mV/s in 0.04 M NaCN solution, pH 10.5, 25 °C. ...120 Fig. 5.11 Effect of agitation (100, 250 and 400 rpm) on the cathodic polarization curve of RGO
with scan rate of 0.166 mV/s in 0.04 M NaCN solution, pH 10.5, 25 °C. ...122 Fig. 5.12 (a) Surface image of Au electrode after combined with RGO electrode test showing the
brownish-red colour; (b) SEM image of Au electrode surface. ...125 Fig. 6.1 Schematic illustration of one container (OC) electrochemical set-up for combined anode
electrode polarization (CAP) tests (1: Au as working electrode; 2: mineral electrode; 3: counter electrode; 4: reference electrode; 5: pH meter; 6: slurry; 7: NaCN
electrolyte; 8: magnetic bar (4 x 1 cm2)). ...135 Fig. 6.2 The influence of oxygen and cyanide on cathodic potentiodynamic polarization of pure
gold (0.25 cm2) (a) and roasted gold ore (b) electrodes (4.9 cm2) at 0.166 mV/s scan rate in 0.01 M NaCN electrolyte at pH 10.5 at 100 rpm agitation, 25 °C. ...137 Fig. 6.3 Effect of roasted gold ore (RGO) on gold dissolution either in one or two containers (a)
in the absence of slurry, (b) in the presence of slurry (35%), in 0.01 M NaCN solution, atmospheric oxygen, pH 10.5, at 100 rpm magnetic agitation at 0.166 mV/s scan rate, 25. °C ...139
xiv
Fig. 6.4 Effect of hematite (Hem) on gold dissolution either in one or two containers (a) in the absence of slurry, (b) in the presence of slurry (35%) in 0.01 M NaCN solution, atmospheric oxygen, pH 10.5, 100 rpm magnetic agitation at 0.166 mV/s scan rate, 25 °C. ...140 Fig. 6.5 Effect of maghemite (Mgh) on gold dissolution either in one or two containers (a) in the
absence of slurry, (b) in the presence of slurry (35%) in 0.01 M NaCN solution, atmospheric oxygen, pH 10.5, 100 rpm magnetic agitation at 0.166 mV/s scan rate, 25 °C. ...141 Fig. 6.6 Effect of magnetite (Mag) on gold dissolution either in one or two containers (a) in the
absence of slurry, (b) in the presence of slurry (35%), in 0.01 M NaCN solution, atmospheric oxygen, pH 10.5, 100 rpm magnetic agitation, 0.166 mV/s scan rate, 25 °C. ...143 Fig. 6.7 Anodic profile of RGO/Au combined anode polarization in two containers in the
presence of slurry in 0.01 M NaCN solution, atmospheric oxygen, pH 10.5, at 100 rpm magnetic agitation at 0.166 mV/s scan rate, 25 °C. ...144 Fig. 6.8 The influence of the treatment of tailings of first slurry test as a new feed slurry on the
dissolution behaviour of gold for RGO/Au combined anode polarization in two separate containers in 0.01 M NaCN solution, atmospheric oxygen, pH 10.5, at 100 rpm magnetic agitation at 0.166 mV/s scan rate, 25 °C. ...146 Fig. 6.9 The influence of slurry in two separated containers (TC) for RGO and Au electrode
combined polarization in 0.01 M NaCN solution, atmospheric oxygen, pH 10.5, at 100 rpm magnetic agitation at 0.166 mV/s scan rate, 25 °C. ...147 Fig. 6.10 The influence of magnetic pre-treatment on RGO and Au electrode combined
polarization in one container in 0.01 M NaCN solution, atmospheric oxygen, pH 10.5, at 100 rpm magnetic agitation at 0.166 mV/s scan rate, 25 °C. ...148 Fig. 6.11 Effect of NaCN concentration on anodic polarization of Au connected to MagHem-ES
electrode at 0.166 mV/s scan rate at 100 rpm agitation, pH 10.5, 25 °C. ...149 Fig. 6.12 (a) Scanning electron microscopy (SEM), (b) Energy-dispersive X-ray spectroscopy
(EDS) of black zone; and (c) EDS of grey zone around black one; on Au electrode after polarization test connected to MagHem-ES at 0.166 mV/s scan rate in 0.4 M NaCN solution, atmospheric oxygen, pH 10.5, at 100 rpm magnetic agitation, 25 °C. ...151 Fig. 6.13 Effect of agitation on anodic polarization of Au connected to MagHem-ES electrode in
xv
Fig. 7.1 Corrosion rate of Au in 0.01 M NaCN, with a pH of 10.5 and 100-rpm agitation at 25 °C; cathodic polarization curves in different conditions. ...167 Fig. 7.2 The influence of soluble species on the dissolution kinetics of gold (mg) after 4 h in 0.01
M NaCN, with a pH of 10.5, under 100-rpm agitation, at 25 °C by MP-AES. ...170 Fig. 7.3 SEM images of coatings on the pure Au electrode after 4 h of leaching; (a) pure Au in a
slurry of RGO (x 5000); (b), (c), and (d) pure Au in a slurry of Magnetite (x 100), (x 500); (x 10000), respectively; (e) EDS profile (after the magnetite test) showing Fe-Ox. ...172 Fig. 7.4 XPS profile of magnetite particles (survey spectrum and Au 4f/2 spectrum). ...173 Fig. 7.5 Processing route for maghemite-rich magnetic concentrates. ...174 Fig. 7.6 Atomic (%) of elements (± 5%) in the magnetic concentrate and magnetic tails by XPS.
...175 Fig. 7.7 SEM images of the magnetic concentrate (a) and magnetic tails (b). (The light-white
phase is Fe-Ox, and the grey phase is Ca and Si). ...176 Fig. 7.8 XRD profiles of the magnetic concentrate and magnetic tails (Mgh: Maghemite; Hem:
Hematite; Qtz: Quartz; Cal: Calcite; Dol: Dolomite; Gp: Gypsum). ...176 Fig. 7.9 Potentiodynamic cathodic polarization of roasted gold ore (RGO), magnetic concentrate
(Mag Conc), magnetic tailings (Mag Tails), synthetic maghemite (Synth Mgh), and pure gold (Au) electrodes with a scan rate of 0.166 mV/s in 0.01 M NaCN electrolyte saturated with atmospheric oxygen at 100-rpm agitation, a pH of 10.5, and 25 °C (Au: 0.25 cm2; other electrodes: 4.9 cm2); (a) polarization from the open circuit potential to the cathodic potential; (b) polarization from the cathodic potential to the open circuit potential...179 Fig. 7.10 The influence of oxygen concentration (atmospheric and bubbled (dotted line)) on the
potentiodynamic cathodic polarization of synthetic maghemite (Synth Mgh) (a), roasted gold ore (RGO) (b), and magnetic tails (c) electrodes from the open circuit potential to the cathode potential with a scan rate of 0.166 mV/s in 0.01 M NaCN electrolyte at 100-rpm agitation, a pH of 10.5, and 25°C. ...181 Fig. 7.11 Potentiodynamic anodic polarization of roasted gold ore (RGO), magnetic concentrate
(MagConc), Magnetic tails (Mag Tails), synthetic maghemite, and pure gold (Au) electrodes with a scan rate of 0.166 mV/s in 0.01 M NaCN electrolyte saturated with atmospheric oxygen at 100-rpm agitation, a pH of 10.5, and 25 °C (Au: 0.25 cm2; other electrodes: 4.9 cm2). ...182
xvi
Acknowledgements
First and foremost, I would like to express my sincere thanks and appreciation to my supervisor, Professor Edward Ghali, for his guidance and support. It has been an honour to be his student. I appreciated all the time he took to share his ideas with me, making my Ph.D. study enjoyable and productive. His dedication and diligence will always remain an inspiration in my future endeavours. He has always been supportive and given me the freedom to explore alternative paths during the course of my Ph.D. As a mentor, his contributions to my professional development are priceless.
I would like to acknowledge Dr. Fariba Safizadeh, Dr. Wei Zhang, and Dr. Liliana Gavril for their support, assistance, and contribution during this work. Special thanks are likewise expressed to Dr. Yeonuk Choi, of Barrick Gold Corporation, for his invaluable comments and ideas which serve as a strong link to the industrial practice. Mr. Georges Houlachi, of Hydro Québec, is gratefully acknowledged for his encouragement and professional advice for my career. I also thank Prof. Fathi Habashi for his encouragement in exploring different aspects of metallurgical subjects, and also for his help to find me this Ph.D. project.
Special thanks are extended to the Natural Sciences and Engineering Research Council of Canada (NSERC), Barrick Gold Corporation, and Hydro-Québec for their financial support through the R&D NSERC Program. Professional technical participations of Mrs. Vicky Dodier, Dr. Alain Adnot, Mr. André Ferland, Mr. Jean Frenette, Mr. Daniel Marcotte, and Mr. Christian Jalbert are gratefully acknowledged. My friends at Laval University Nabil Sorour, Chaoran Su, Ramzi Ishak, François K. Kadiavi, Jonathan F. Marcoux, and Michael Neil are gratefully appreciated for their friendships and help.
xvii
“To my mother, father, and brother, from Salihpaşalar, for strongly encouraging me to pursue my dreams in Canada’’
“There is a crack in everything, that’s how the light gets in” L. C.
xviii
Foreword
This thesis is composed of eight chapters and presented as articles in insertion form. The objectives, methodology, and experimental approach are presented in Chapter 1. Following, Chapter 2 provides a literature review to this thesis which is inspired from the review paper entitled “A review on electrochemical dissolution and passivation of gold during cyanidation in presence of sulphides and oxides’’ co-authored by Ahmet Deniz Bas, Edward Ghali, and Yeonuk Choi, and submitted to Hydrometallurgy Journal. Chapters 3, 4, 5, 6, and 7 present the results of this project in the form of scientific articles, and Chapter 8 highlights the general discussion and recommendations for future studies. This project was supervised by Prof. Edward Ghali and Dr. Yeonuk Choi.
Chapter 3:
Active and passive behaviours of gold in cyanide solutionsAuthors: Ahmet Deniz Basa*, Fariba Safizadeha, Wei Zhanga, Edward Ghalia, Yeonuk Choib
aDepartment of Mining, Metallurgical and Materials Engineering, Laval University,
Quebec, Canada, G1V 0A6
bBarrick Gold Corporation, Suite 3700, 161 Bay Street P.O. Box 212, Toronto, Ontario,
Canada, M5J 2S1
Journal: Trans. Nonferrous Met. Soc. China, 25, 10, 3442-3453. Elsevier. DOI: 10.1016/S1003-6326(15)63981-4
I did all the experimental measurements and analysis along with paper writing and presentation. The scientific revision was done by Dr. Fariba Safizadeh, Dr. Wei Zhang, Prof. Edward Ghali, and Dr. Yeonuk Choi.
The electrochemical behaviour of gold in sulphuric acid medium has also been considered as comparison to that in cyanide medium. In this regard, another article entitled ‘’Passive Behaviour of Gold in Sulphuric Acid Medium’’ co-authored by Wei Zhag, Ahmet Deniz Bas, Edward Ghali, Yeonuk Choi, has been published in Trans. Nonferrous Met. Soc.
China, Elsevier, 25, 6, 2037-2046. DOI: 10.1016/S1003-6326(15)63813-4. However, only its abstract was given in the Appendix A since this paper is considered as complimentary to Chapter 3 which is mainly presented as full manuscript on cyanide.
xix
Chapter 4:
A study of electrochemical interactions between gold and its associated oxide mineralsAuthors: Ahmet Deniz Basa*, Edward Ghalia, Yeonuk Choib
aDepartment of Mining, Metallurgical and Materials Engineering, Laval University,
Quebec, Canada, G1V 0A6
bBarrick Gold Corporation, Suite 3700, 161 Bay Street P.O. Box 212, Toronto, Ontario,
Canada, M5J 2S1
This article has been published in 54th Annual Conference of Metallurgists (COM 2015), The Metallurgy and Materials Society of CIM, The LUCY ROSATO Memorial Symposium, Toronto, Canada, August 23-26, paper no 8897.
In this work, the influence of iron oxide minerals on gold dissolution during galvanic corrosion either in one and two separate containers has been investigated. The experimental measurements and analysis along with paper writing were performed by the first author. The scientific revision was done by Prof. E. Ghali, and Dr. Y. Choi.
The electrochemical behaviour of gold in sulphuric acid medium has also been considered as compared to that in cyanide medium. In this regard, another article entitled ‘‘Electrochemical study of gold cyanidation in the presence of roasted gold ore and its associated oxide minerals’’ co-authored by Ahmet Deniz Bas, Edward Ghali, and Yeonuk Choi, and it has been published in 55th Annual Conference of Metallurgists (COM 2016), Electrometallurgy 2016 Symposium, Proceedings of XXVIII IMPC-Quebec,
Canada, September 11-15, paper no 842. However, only its abstract was given in the Appendix B since this paper is considered as complimentary to Chapter 4 which is mainly presented as full manuscript.
xx
Chapter 5:
Electrochemical dissolution of roasted gold ore in cyanide solutionsAuthors: Ahmet Deniz Basa*, Liliana Gavrila, Wei Zhanga, Edward Ghalia, Yeonuk Choib
aDepartment of Mining, Metallurgical and Materials Engineering, Laval University,
Quebec, Canada, G1V 0A6
bBarrick Gold Corporation, Suite 3700, 161 Bay Street P.O. Box 212, Toronto, Ontario,
Canada, M5J 2S1
Journal: Hydrometallurgy, 156, 188-198. DOI: 10.1016/j.hydromet.2015.07.003
In this work, the electrochemical dissolution behaviour of roasted gold ore as function of leaching parameters has been highlighted, and optimal conditions for roasted gold ore studies have also been investigated. The experimental measurements and analysis along with paper writing were performed by the first author. The manuscript was revised by Dr. L. Gavril, Dr. W. Zhang, Prof. E. Ghali, and Dr. Y. Choi.
Chapter 6:
A study of the electrochemical dissolution and passivation phenomenon of roasted gold ore in cyanide solutionsAuthors: Ahmet Deniz Basa*, Wei Zhanga, Edward Ghalia, Yeonuk Choib
aDepartment of Mining, Metallurgical and Materials Engineering, Laval University,
Quebec, Canada, G1V 0A6
bBarrick Gold Corporation, Suite 3700, 161 Bay Street P.O. Box 212, Toronto, Ontario,
Canada, M5J 2S1
Journal: Hydrometallurgy, 158, 1-9. DOI: 10.1016/j.hydromet.2015.09.020
In this work, the influence of iron oxide minerals on gold dissolution has been examined by Combined Anode Electrodes Polarization, as a new approach. The experimental measurements and analysis along with paper writing were performed by the first author. The manuscript was revised by Dr. Wei Zhang, Prof. E. Ghali, and Dr. Yeonuk Choi.
xxi
Chapter 7:
Leaching and electrochemical dissolution of gold in the presence of iron oxide minerals associated with roasted gold oreAuthors: Ahmet Deniz Basa*, Fariba Safizadeha, Edward Ghalia, Yeonuk Choib
aDepartment of Mining, Metallurgical and Materials Engineering, Laval University,
Quebec, Canada, G1V 0A6
bBarrick Gold Corporation, Suite 3700, 161 Bay Street P.O. Box 212, Toronto, Ontario,
Canada, M5J 2S1
Journal: Hydrometallurgy, 166, 143-153. DOI: 10.1016/j.hydromet.2016.10.001
In this work, the implication of electrochemical findings in conventional cyanidation has been tested by considering cathodic Tafel slope only as a new approach. The experimental measurements and analysis along with paper writing were performed by the first author. The manuscript was revised by Dr. Fariba Safizadeh, Prof. E. Ghali, and Dr. Yeonuk Choi.
Finally,
Chapter 8
provides general conclusions for this thesis as well as few recommendations for future work plan.1
Chapter 1
2 1.1 State of the Technology
It is worth mentioning that due to the rapid depletion of free-milling types of gold ores, it is accepted worldwide that there is an increasing trend for the treatment of refractory gold ores which often require oxidation, such as roasting, as a pre-treatment process prior to cyanidation. As a result, in recent years, the treatment of oxidised gold ores by electrochemical methods and conventional cyanidation is therefore becoming essential for R&D, and for the mining industry. Up to now, almost all the electrochemical studies of gold ores have been performed using sulphidic ones, and there is a paucity for the electrochemical studies of oxidised gold ores. Usually, oxide gold ores do not present any issue (easy to leach and low reagent consumption). Although many studies have been carried out on the anodic behaviour of gold using cyclic voltammetry, potentiodynamic, and ZRA (zero-resistance ammeter) mode galvanic corrosion tests, there is still a doubt on gold passive phenomenon. These advancements in the processing of gold ores have shown the importance and necessity of electrochemical characterisation studies for oxidised and more complex gold ores.
1.2 Scientific Problem and Objectives of This Project
During cyanidation of gold, in some conditions, the dissolution rate of gold could slow down which results in longer retention times and/or poor gold extractions. It is a big problem for the mining industry. In this Ph.D. project, oxidised/roasted gold ore sample from Barrick Gold Corporation (BGC) is used to examine the electrochemical dissolution of roasted gold ore. At BGC cyanidation plant, ~ 90% of gold is leached from the roasted gold ore whereas an 10% rest in the leach residue. Passivation could be responsible for this unrecovered gold. It is worth noting that passivation of gold could be due to adsorbed species, corrosion products (precipitates), and/or combinations of both mechanisms (thereof, as our hypothesis). The influence of gold carrier iron oxide minerals such as hematite (Fe2O3), magnetite (conducting mineral) (Fe3O4), and also maghemite (has the
same structure as magnetite, that is spinel ferrite and is also ferromagnetic; (γ-Fe2O3) on
gold leaching was examined in a systematic way as in freely corroding mode at open circuit potential (OCP) or in the presence of imposed potentials. Based on these statements, the
3
main objective of this project is to provide a detailed knowledge of electrochemical dissolution behaviour of roasted (oxidised) gold ores and to establish the optimal leaching conditions for roasted gold ore, as far as possible. Concurrently, providing an appropriate understanding of the passivation phenomenon of gold is one of the objectives. Hence, the questions below reflect the objectives of my Ph.D. thesis:
(i) What are the main dissolution characteristics of pure gold and gold ores? (ii) How does the passive behaviour of gold change under passive conditions? (iii) Is the passivation a surface product or an adsorbed layer or both?
(iv) What is the influence of iron oxide on gold dissolution? How do they affect galvanic interactions and passivation phenomenon of gold?
(v) What causes the slowdown of gold dissolution rate?
(vi) What are the optimal dissolution conditions for roasted gold ore(s)?
1.3 Description of the Strategy Adapted to This Ph.D. Thesis
Based on the above questions, the scientific approach of this Ph.D. thesis is shown in Fig. 1.1.
4
a) Active and passive behaviours of gold, when it is under passive conditions, have been examined as a function of leaching parameters. This would give more information about the characteristics of passivation of gold’s surface.
b) As complimentary to the conventional electrochemical methods, more recent ones have been considered to study the active and passive behaviour of gold in cyanide solutions. In this case, Electrochemical Noise Measurement (ENM) with its in-situ corrosion rate feature, and Scanning reference electrode technique (SRET), monitoring the real-time changes of anodes and cathodes, have been used. It is also important to note that, to the best of our knowledge, there is no previous work on gold leaching using these methods.
c) Electrochemical interactions between gold and its associated oxide minerals individually (hematite, magnetite, and maghemite) are examined with imposed potentials using combined anode electrodes polarization (CAP), as a new approach, as function of leaching parameters in a systematic way. In this case, gold and iron oxide electrodes are electrically connected to each other, as working electrode, and platinum is used as counter electrode.
d) Galvanic interactions and passivation phenomena without imposed potentials, as in practice, either in the absence or in the presence of slurry of roasted gold ore at Zero Resistance Ammeter (ZRA) mode are investigated.
e) Electrochemical dissolution of roasted gold ore electrode is examined as function of leaching parameters to obtain the optimal conditions for roasted gold ores. To identify the dominating effect in between galvanic interactions and passivation phenomenon on gold dissolution, one and two separate containers tests are considered. These tests have been performed for CAP and ZRA conditions. It is assumed that in two separate containers, the passivation of gold surface could be eliminated whereas both galvanic interactions and passivation phenomenon are potentially present in one container.
f) Since hematite and magnetite are the major iron oxides in roasted gold ore sample, a new electrode named “MagHem-ES”, which has equal surfaces of magnetite and hematite in
5
one electrode, is developed to examine the concurrent effects of these minerals on the dissolution rate of gold.
g) The influence of maghemite on gold dissolution is examined. Maghemite is critical due to its non-porosity, therefore the unrecovered gold is mainly associated and captured by maghemite. Additionally, its effect on gold dissolution could be different and should be evaluated when gold is in free contact with maghemite.
h) Generally, it has been accepted that the intersection of anodic and cathodic curves gives the corrosion rate of the metal. However, our preliminary results have shown that the intersection does not represent the actual leach rate of gold. Another approach close to the conventional cyanidation results should be found. Then, a new approach is proposed such as considering only cathodic Tafel slope by extrapolating to open circuit potential.
i) After the cyanidation of roasted gold ore, leach tailings are collected for further characterisation. Then, leach tailings are subjected to magnetic separation tests to have magnetic and non-magnetic parts containing gold. For a better understanding, electrochemical behaviours of these parts are evaluated by performing anodic and cathodic polarisation tests. Additionally, cathodic polarisation tests are considered both scanning from OCP to more cathodic potentials, and from more cathodic potentials to OCP for better under. Further, the influence of oxygen concentration is examined in polarisation tests. Throughout this project, XPS, and SEM-EDS are considered to detect the surface species on gold. Thus, a detailed anodic dissolution profile of roasted gold ore could be established.
1.4 Key Contributions of This Ph.D. Project
Until now, the treatment of oxidised, e.g. roasted gold ores, has received relatively less attention than the sulphidic ones (Adams, 2016). Recently, it can be admitted that the handling of oxidised gold ores is becoming more essential. Based on the open literature, it can be concluded that there is a lack on the electrochemical dissolution studies of gold dealing with the electrochemical methods. In this regard, a critical literature review on the electrochemical dissolution and passivation of gold has been submitted to Hydrometallurgy
6
Journal (Chapter 2). This review paper examines the evaluation of the electrochemical methods used in gold dissolution studies from past to present, the treatment of complex gold ores, the development of a better understanding for the concept of passivation, and commonly used terms in gold dissolution studies were considered. Several new contributions, as following, have been proposed in this project. Fig. 1.2 demonstrates the strategy adapted in this Ph.D. thesis.
During cyanidation, gold dissolution may slowdown in some conditions, and passivation of gold surface is considered one of the potential reasons for that. Prior to dealing with complex and oxidised gold ores, it is critical to revisit the pure gold studies to have a better understanding on the electrochemical behaviour of gold in cyanide solutions. In this respect, the first part of this Ph.D. thesis focuses on the dissolution and passivation characteristics of gold in pure systems. In pure gold study, dissolution behaviour of gold is examined as function of leaching parameters using potentiodynamic polarisation method. Further, three anodic potentials are imposed to investigate the passivation behaviour of gold using potentiostatic polarisation method. The results have shown that when gold is under passive conditions, increasing cyanide concentration and pH results in decreasing the current density, which suggest the partial passivation of gold surface. Surface characterisation at the offset of each test have identified the corrosion products on the surface of gold that are responsible for this passive behaviour.
Following the pure gold study, the electrochemical behaviour of roasted gold ore in cyanide solutions have been investigated. In this context, electrochemical interactions between gold and iron oxides of roasted gold ore are examined in galvanic corrosion using Zero-Resistance Ammeter (ZRA) mode. The results have shown that the galvanic current decreases in presence of magnetite whereas it increases in presence of hematite and maghemite, relatively. This suggest that hematite promotes the dissolution rate of gold, and magnetite slows down the rate.
For a better understanding, in the following part, the influence of iron oxides of roasted gold ore on the dissolution rate of gold is examined using potentiodynamic polarization
7
tests, and it was compared to that obtained in galvanic corrosion tests. The results have also showed that magnetite has a retarding effect on the dissolution rate of gold, while hematite and maghemite have positive effects. This highlights that galvanic corrosion and potentiodynamic polarization methods gave similar results. The negative effect of magnetite has also been confirmed by XPS and SEM-EDS studies.
Finally, electrochemical results have been compared to that obtained in conventional cyanidation to understand the dissolution behaviour of gold from roasted ore in industrial practice. It has been shown that considering only cathodic Tafel slope by extrapolating to open circuit potential represents better the practice leach rates of gold. The results have indicated that the dissolution rate of gold increases in the presence of hematite, and maghemite, and the rate decreases in the presence of magnetite. Generally, it can be deduced that the combination of the corrosion products and adsorbed layers could be responsible for the slowdown in gold dissolution from roasted ore, to some extent, but it is not a perfect type of passivation.
8
Chapter 2
Critical Review of Electrochemical Dissolution of Gold The importance of treatment of oxidised gold ore Passivation phenomenon of gold is still in doubt
Electrochemical methods for gold dissolution from past to present
Chapter 3
Electrochemical Behaviour of Pure Gold in Cyanide Solutions Active and passive behaviours of gold in cyanide solutions Potentiostatic studies at three anodic potentials
Application of some recent electrochemical methods
Chapter 4
A study of electrochemical interactions between gold and itsassociated oxide minerals
Galvanic corrosion to examine the influence of iron oxide minerals and soluble ions in separate containers
Either in the presence and absence of slurry
Chapter 5
Electrochemical dissolution of roasted gold ore in cyanide solutions Electrochemical behaviour of RGO as function of leaching parameters for optimal conditions
Chapter 6
A study of the electrochemical dissolution and passivationphenomenon of roasted gold ore in cyanide solutions
“Combined anode electrodes” in separate containers
Influence of different iron oxides and RGO as slurry on gold dissolution
MagHem-ES electrode for concurrent effect of iron oxides
Chapter 7
Influence of Iron Oxide Slurries on the Dissolution of Gold Electrode Cathodic Tafel slope extrapolating to OCP for leach rate estimation Magnetic separation and electrochemical behaviour of leach tailings
Chapter 8
Conclusions and Recommendations Influence of different iron oxides on gold dissolution is examined Roasted gold ore dissolution is evaluated
Passivation behaviour of gold in presence of iron oxides is concluded
9
Chapter 2
10
A review on electrochemical dissolution and passivation of gold during cyanidation in presence of sulphides and oxides
Ahmet Deniz Basa*, Edward Ghalia, Yeonuk Choib
aDepartment of Mining, Metallurgical and Materials Engineering, Laval University,
Quebec, Canada, G1V 0A6
bBarrick Gold Corporation, Suite 3700, 161 Bay Street P.O. Box 212, Toronto, Ontario,
Canada, M5J 2S1
*Corresponding author: 4186568657, Fax: 4186565343; (ahmet-deniz.bas.1@ulaval.ca)
11 Résumé
Avec l'épuisement rapide des minerais d’or libre, des minerais d'or sulfurés sont souvent oxydés avant la cyanuration à cause de caractère réfractaire. Cela se traduit par l'augmentation du traitement des minerais d'or oxydé. Ainsi, l'évaluation de la dissolution électrochimique des minerais d'or plus complexes et oxydés deviennent de plus important pour l'industrie minière et de la R&D. Dans cette étude, les réalisations passées et les développements récents en matière des méthodes électrochimiques utilisées dans la dissolution d'or et les études de la passivation d'or pur, sulfurés, et les minerais oxydées d'or sont présentés.
Aux potentiels proches du potentiel de circuit ouvert (PCO) comme dans la pratique, le ralentissement la vitesse de la dissolution d'or pourrait être à cause de la passivation, soit par des couches adsorbées ou des produits de surface, ou des combinaisons de ceux-ci. Différents termes utilisés dans les études de dissolution d'or tels que passivation, inhibition, effet retardateur, et ralentissement ont été discutées. Les développements dans les approches électrochimiques, tels que deux cellules séparés, ont été résumés. Des procédés électrochimiques, ainsi que des techniques récentes, telles que la mesure du bruit électrochimique avec sa détection in situ de la vitesse de corrosion, et la technique du balayage de l'électrode de référence sont évalués.
Dans la plupart des études antérieures de polarisation, la réaction anodique a été étudiée en absence d'oxygène, tandis que la réaction cathodique en absence de cyanure, de façon séparée, et la dissolution a été considérée comme étant l'intersection des deux courbes. Cependant, certaines découvertes récentes indiquent que cela ne représente pas la vitesse de dissolution de l'or réel dans la pratique. En outre, la direction de balayage dans des essais de polarisation cathodique, soit PCO vers les potentiels cathodiques ou le potentiel cathodique vers le PCO, est également signalé.
12 Abstract
With the rapid depletion of free-milling types of gold ores, sulphidic gold ores are often oxidised prior to cyanidation due to the refractoriness. This results in the increase in the processing of oxidised gold ores. Thus, evaluation of the electrochemical dissolution of more complex and oxidised gold ores become ever important for the mining industry and for R&D. In this study, past achievements and recent developments in terms of electrochemical methods used in gold dissolution and passivation studies of pure gold, sulphidic, and oxidised gold ores are presented.
At potentials close to open circuit potential (OCP) as in practice, slowdown in the dissolution rate of gold could be due to passivation by either adsorbed layers or surface products, or combinations thereof. Different terms such as passivation, inhibition, retarding effect, and slowdown used in gold dissolution studies have been discussed. The developments in electrochemical approaches, such as two separate containers, have been summarized. Conventional electrochemical as well as recent methods, such as electrochemical noise measurement with its in-situ detection of corrosion rate, and scanning reference electrode technique are evaluated.
In the majority of the previous polarization studies, anodic reaction was examined in absence of oxygen whereas cathodic reaction in absence of cyanide, separately, and the dissolution was considered as the intersection of both curves. However, some recent findings report that this does not represent the actual gold dissolution rate as in practice. Additionally, the direction of scanning in cathodic polarization tests, either OCP to cathodic potentials or cathodic potential to OCP, is also reported.
Keywords: Gold, Electrochemical dissolution, Inhibition, Passivation, Oxidised and Roasted Gold Ores
13 2.1 Leaching and Types of Gold Ores
Gold, from ancient times to date, has been valued by humans due to its lustrous colour and its resistance to tarnishing, and has always been considered as the metal of perfection (Habashi, 2016). From the beginning, the processing of gold has been done using different chemicals (aqua regia, halides, ferric chloride, thiourea, thiosulphate etc.), and techniques, such as gold panning, amalgamation, chlorination, cyanidation, and refining of gold (Aylmore, 2016). Among the others, cyanide, with its competency to form a strong complex with gold, is the most preferable reagent for the leaching of gold from its ores. Cyanide has a proven track record of more than 125 years of being used by far the most suitable and effective reagent for recovering of gold (Anderson, 2016; Akcil, 2014).It is also important to mention that due to the environmental issues, high gold prices, and increase in the sharing of more complex gold ores, the application of alternative lixiviants to cyanide has extensively been taken into consideration. Recently, Barrick Gold Corporation has announced the commercialisation of a thiosulphate-leaching plant at their Goldstrike operation (Choi, 2015). However, still ~ 85% of gold production worldwide is done using sodium cyanide, and it is more than 90% in U.S. (Cardarelli, 2008; Franks, 2015).
In general, gold ores are classified into two groups as free-milling and refractory type of gold ores by means of metallurgical definition. Free-milling gold ores, which are amenable to direct cyanidation (gold extraction ≥ 85-90%) without any need of chemical pre-treatment, have been treated and consumed too much in the past(Zhou and Fleming, 2007). On the other hand, refractory types of gold ores (gold extraction ≤ ~ 85-90%) often require some chemical and/or physical pre-treatment methods such as roasting (Dunne et al., 2013),bio-oxidation (BiOx)(Ciftci and Akcil, 2010),pressure-oxidation (POX)(Baron et al., 2016), ultra-fine grinding (UFG) (Celep et al., 2015)prior to cyanidation (Fig. 2.1), and also alkaline sulphide leach process (Anderson et al., 2005; Celep et al., 2011).
Refractoriness is a term generally used to express the reason(s) for low or poor gold extractions(La Brooy et al., 1994). In recent years, there has been an increasing trend on the treatment of refractory gold ores due to the rapid depletion of free-milling types of gold ores (Adams, 2016).
14
Fig. 2.1 Gold processing routes of the top 20 global gold producers in 2011 (Adams, 2016).
2.2 Electrochemical Dissolution of Gold
The commercial application of the cyanidation process was first applied by MacArthur in 1887 and about 60 years after the discovery of the process, it has been understood that the gold dissolution is an electrochemical corrosion process (Habashi, 2009). Cyanidation occurs as a result of the two redox half reactions; the oxidation of gold (Eq. 2.1), to be a single electron reaction, and the reduction of oxygen (Eq. 2.2) at alkaline pH. The mechanism of the cathodic reaction, i.e. the reduction of oxygen, has long been controversial (Marsden and House, 2006). In the potential range of the gold dissolution, the direct reduction of oxygen to hydroxyl ions does not usually take place. The reduction of oxygen has been found to follow a pathway of sequential two-electron transfer reactions involving the formation of hydrogen peroxide (Eq. 2.3) as an intermediate product (Lorösch, 2001; Evans an Lingane, 1963). The overall reaction will be described by the
Elsner’s (1846) equation (Eq. 2.4), which is stoichiometrically correct but does not completely describe the cathodic reactions associated with the dissolution.
𝐴𝑢 + 2𝐶𝑁− ↔ 𝐴𝑢(𝐶𝑁)
2
−+ 𝑒− Eq. 2.1
15
𝑂2+ 2𝐻2𝑂 + 2𝑒− ↔ 2𝑂𝐻−+ 𝐻
2𝑂2 Eq. 2.3
4𝐴𝑢 + 8𝐶𝑁−+ 𝑂2+ 𝐻2𝑂 ↔ 4𝐴𝑢(𝐶𝑁)2−+ 4𝑂𝐻− Eq. 2.4
Bodländer (1896) suggested the formation of hydrogen peroxide with an incomplete reduction of oxygen to hydroxide for the dissolution reaction of gold (Eq. 2.5). Direct reduction of hydrogen peroxide (Eq. 2.6) has been reported only a very limited extent (Kameda, 1949; Zurilla and Yeager, 1969). More details about the role of hydrogen peroxide in gold dissolution can be found in the literature, e.g. in the collection work of
Habashi (2009). Hydrogen peroxide decomposes to form oxygen (Eq. 2.7), particularly in slurries. Thus, from a stoichiometric view, the overall dissolution reaction for gold is believed to be the Elsner’s equation. The decomposition of hydrogen peroxide to elemental oxygen (Eq. 2.7) possibly takes place at elevated temperatures, and in the presence of incompatible chemical,since it is relatively unstable (Feldmann and Breuer, 2015). Oxygen was found to dissolve gold and silver much faster, i.e. 6-9 and 12 times, respectively, than that of hydrogen peroxide (Boonstra, 1943; Lund, 1951; Habashi, 1967).
2𝐴𝑢 + 4𝐶𝑁−+ 𝑂2+ 2𝐻2𝑂 ↔ 2𝐴𝑢(𝐶𝑁)2−+ 𝐻2𝑂2+ 2𝑂𝐻− Eq. 2.5
2𝐴𝑢 + 4𝐶𝑁− + 𝐻2𝑂2 ↔ 2𝐴𝑢(𝐶𝑁)2−+ 2𝑂𝐻− Eq. 2.6
𝐻2𝑂2 ↔ 𝐻2𝑂 + 0.5𝑂2 Eq. 2.7
2.3 Passivation Phenomenon and Inhibition of Gold Dissolution
In general, there are two common definitions for passivation, like the first one says that metals, which are passive, are covered by a chemisorbed film, e.g. of oxygen, hence this layer displaces the H2O molecules and slows down the rate of anodic dissolution involving
hydration of metal ions. The second approach considers that the passive film is always a diffusion-barrier layer of the reaction products, e.g. oxides, therefore corrosion rate decreases (Uhlig, 1963). Such phenomenon was first observed by M. Faraday in 1835 (Shreir et al., 1994). Crundwell (2015) identifies passivation, in terms of corrosion of metals, as the formation of a passive layer composed of metal oxides that lower the rate of dissolution by several orders of magnitude. There are some important terms in
corrosion-16
passivation studies such as the corrosion potential Ecorr, the corrosion current density icorr,
the critical potential for passivation Ecp, the critical current density for passivation icp, the
breakdown potential Eb, and the breakdown current density ib (the highest passive current
density just before or at Eb) (Uhlig, 1963; Fontana and Greene, 1978).
In the case of gold, the passivation phenomenon has been known since 1907 and Beyers (1936) quoted "Jacobson studied the anodic dissolution of gold in alkaline cyanide solution and established that gold became passive under certain conditions in commercial cyanide solutions. He assumed that the passivity is due to the formation of a film of comparatively insoluble sodium aurocyanide on the anodic gold" (Filmer, 1982). The decrease in current density indicates that the dissolution of gold has been partially blocked, suggesting the partial passivation (Kiss, 1988). Filmer (1982) stated that “All the researchers in gold leaching field have shown that oxidation initially follows normal Tafel behaviour, but passivation occurs as the potential is shifted anodically. The anodic current achieved prior to passivation is dependent on the cyanide concentration and on the concentration of the impurities in solution”. For instance; this shift in the dissolution potential of gold towards anodic potentials was reported to be up to 150 mV in the presence of pyrite slurry (Lorenzen and van Deventer, 1992a). It was proposed that the adsorption of hydroxide ions (Kirk et al., 1980) or some form of adsorbed AuCN (Nicol, 1980) on the surface of pure gold are responsible for the passivation of gold. The polymeric nature of the AuCNads to
form …-Au-CN-Au-CN-…. chain may be responsible for the retard to further dissolution of gold (Sandenbergh and Miller, 2001). Tshilombo and Sandenbergh (2001) stated that if passivation is due to the formation of a polymeric layer of AuCN that results from the lack of enough cyanide, such that insoluble AuCN rather than the much more soluble Au(CN)2
-is formed, indicates that peak current -is dependent on the cyanide concentration. The nature of anodic peak(s) and the possible reasons of passivation is still a controversial issue.
Moreover, two recent papers (Holmes and Crundwell, 2013; Crundwell, 2013) discussing
the passive phenomenon of gold have been published. Crundwell (2013) claimed that each
point on the surface is considered as both anodic site and cathodic site and concluded that there is no separation of anodic and cathodic sites on mineral surface. Habashi and Bas (2014) pointed out that certain experimental results demonstrated the existence of anodic
17
and cathodic zones during the dissolution of minerals. These studies show that examining the anodic behaviour of gold still receives much attention.
Passivation is a commonly used term to explain a phenomenon in many fields, but its meaning could potentially create a confusion according to the used area. The meaning of passivation differs from one to other; for example, it could express different meanings by hydrometallurgists and electrochemists. Sometimes, any reduction observed in gold leaching has been easily attributed to passivation without a detailed explanation, which could show the different/indecisive use of this term. In addition to passivation, there are other terms used to express the reduction in gold dissolution (rate) such as inhibition (Kasaini et al., 2008; Van Den Berg and Petersen, 2000; Alonso-Gómez and Lapidus, 2009;
Luna and Lapidus, 2000), retarding effect (Gupta and Mukherjee, 1990; Jeffrey et al., 2008), and slowdown (Yannopoulos, 1991; Yang et al., 2010a). Inhibition is mainly defined as a chemical substance which, when added in small concentrations to an environment, minimises or prevents corrosion (Papavinasam, 2011; Riggs, 1973).
2.4 Electrochemical Methods Used in Gold Dissolution Studies
It has been known that gold cyanidation is an electrochemical reaction (Thompson, 1947), so the process can readily be studied using electrochemical techniques. Hence, electrochemical characterisation of gold could potentially provide significant information such as corrosion/dissolution current and potential. With the aid of polarization curves, the active and passive behaviours of gold specimen could also be obtained.
In complementary to the conventional electrochemical methods, such as cyclic voltammetry (CV), linear polarization (LP), galvanostatic, potentiostatic, and potentiodynamic polarization, and more recent electrochemical techniques such as electrochemical noise measurement (ENM), and scanning reference electrode techniques (SRET) have also been employed in gold dissolution studies (Table 2.1). The summary of the electrochemical methods used in gold dissolution studies as function of parameters such as cyanide solutions, pH, and agitation is given in Table 2.1.
18
Table 2.1 A brief summary of the electrochemical methods used for gold cyanidation
(continue on the next page).
Reference CN concentration (M)
pH Agitation (rpm)
Method
Mills, 1951 0.38 M KCN alkaline 400-1200 Anodic and cathodic
polarization Kudryk and Kellogg, 1954 7.67 x 10⁻⁴-10-2 M KCN 10.5-11 300 Potentiodynamic Cathro, 1963; Cathro and Koch,
1964a,b 0.008, 0.023, 0.038, 0.077 M KCN N2 bubbling 11.2, 12, 12.8 600 Potentiodynamic, Potentiostatic, Galvanostatic Mrkusic and Paynter, 1970 0.076 M KCN alkaline 400 Potentiodynamic Potentiostatic Kirk et al., 1978 0.05, 0.1, 0.2 KCN (+ 0.1 M KOH) N2 bubbling
alkaline with and without
Potentiodynamic
Pan and Wan, 1979 0.2, 0.5, 1 KCN N2 bubbling 5, 8.1, 12.8 n.m. Potentiodynamic
Kirk and Foulkes, 1980
0.1 - 0.2 KCN alkaline with and without
Potentiodynamic, Potentiostatic
Thurgood et al., 1981
0.1 M KCN alkaline with and without
Potentiodynamic, Potentiostatic
Filmer, 1982 0.2 M NaCN 12.4 500 Potentiodynamic
Dorin and Woods, 1991
0.02 M NaCN 10 4 s-1 Linear polarization
van Deventer et al., 1990
0.003 M KCN 10.3 100 Galvanic corrosion in one and two cells
Lorenzen and van Deventer, 1992a
0.003 M KCN 10.2 100 Galvanic corrosion
Guan and Han, 1994 0.001, 0.002, 0.005, 0.01, 0.02 M NaCN 10.5, 11, 12, 12.7 450 Potentiodynamic Mughogho and Crundwell, 1996 0.003 M KCN 10-13 1000 Cyclic voltammetry Guzman et al., 1999 0.01, 0.02 M NaCN 10-12.8 400 Potentiodynamic Tshilombo, 2000; Tshilombo and Sandenbergh, 2001 0.005, 0.015, 0.025 NaCN 11 225, 450, 900 Potentiodynamic
Lin and Chen, 2001
0.1, 0.2 NaCN 10.56 500 CV
Jeffrey and Ritchie, 2001
0.02 NaCN 10 300 Potentiodynamic
Reyez-Cruz et. al., 2002
19 Wadsworth and Zhu, 2003 0.01 M NaCN 10.5 300 Potentiodynamic Potentiostatic, CV Cerovic et al., 2005 0.02 M CN- 11 n.m. Potentiodynamic
May et al., 2005 0.006 M NaCN 11 magnetic
agitation Potentiodynamic Aghamirian and Yen, 2005 0.05, 0.025, 0.01, 0.005 M NaCN 10.5 n.m. Potentiodynamic Galvanodyanmic, Galvanic corrosion (ZRA)
Dai and Jeffrey, 2006
5 mM NaCN alkaline 300 Linear sweep voltammetry Tan et al., 2006 0.0037, 0.0075, 0.015 KCN 10.5, 11.5 300 Potentiodynamic Qian et al., 2010 0.005,0.002,0.01,0.02, 0.05, 0.1 M NaCN 11 400 Potentiodynamic
Azizi et al., 2010 10 mM CN 11 500 Linear Polarization,
ZRA Azizi et al., 2011, 2012a and 2012b 30 mM NaCN 11 500 Packed-bed electrochemical reactor, ZRA
Dai and Breuer, 2013
15 mM NaCN 10.6 300 Linear sweep voltammetry
Bas et al., 2015a, 2015b, 2015c, 2015d, 2016a, 2016b 0.01-0.04 M NaCN 10.5 100-400 Potentiodynamic, Potentiostatic, ENM, LP, SRET, ZRA, CV( no agitation) (not mentioned: n.m.) 2.4.1 Potentiodynamic polarization
Potentiodynamic polarization is one of the most preferred methods used to determine the active/passive characteristics of a given metal-solution system, corrosion rate (current density), and Tafel curves (Fig. 2.2). The polarization diagram for a passivable system with the anodic and cathodic branches is shown in Fig. 2.3. For the anodic curve, potential scan typically starts at Ecorr (the open circuit potential) and scanning in a positive direction, and
usually to a potential positive enough to oxidise the test solution. The scan rate is typically 0.1 to 5 mV/s and depends on the system. The most reliable data is generally acquired at slow scan rates (Thompson and Syrett, 1992).
20
Fig. 2.2Cathodic and anodic Tafel polarization diagram (ASTM G3-89, 2006).
Fig. 2.3 Hypothetical polarization diagram for a passivable system with anodic and cathodic branches (ASTM G3-89, 2006).