Animals 2021, 11, 506. https://doi.org/10.3390/ani11020506 www.mdpi.com/journal/animals
Article
Comparison of Fecal Microbiota of Horses Suffering from
Atypical Myopathy and Healthy Co-Grazers
Christina Wimmer-Scherr 1,2, Bernard Taminiau 2,3, Benoît Renaud 2,4, Gunther van Loon 5, Katrien Palmers 6, Dominique Votion 2, Hélène Amory 1,2, Georges Daube 2,3 and Carla Cesarini 1,2,*
1 Equine Clinical Department, Faculty of Veterinary Medicine, Bât. B41, University of Liège,
4000 Liège 1 (Sart Tilman), Belgium; cwscherr@uliege.be (C.W.-S.); helene.amory@uliege.be (H.A.)
2 Fundamental and Applied Research for Animals & Health (FARAH), Faculty of Veterinary Medicine,
University of Liège, 4000 Liège 1 (Sart Tilman), Belgium; bernard.taminiau@uliege.be (B.T.); benoit.renaud@uliege.be (B.R.); dominique.votion@uliege.be (D.V.); georges.daube@uliege.be (G.D.)
3 Department of Food Sciences–Microbiology, Faculty of Veterinary Medicine, University of Liege, Avenue de
Cureghem 10, Bât. B43b, 4000 Liège, Belgium
4 Department of Functional Sciences, Pharmacology and Toxicology, Faculty of Veterinary Medicine,
Bât. B41, University of Liège, 4000 Liège 1 (Sart Tilman), Belgium
5 Large Animal Internal Medicine, Gent University, 9820 Gent, Belgium; gunther.vanloon@ugent.be 6 De Morette Equine Clinic, 1730 Asse, Belgium; katrien.palmers@demorette.be
* Correspondence: ccesarini@uliege.be
Simple Summary: Equine atypical myopathy is a muscular disease caused by a plant intoxication,
which seems to affect only certain horses sharing a pasture, and the role of the intestinal bacteria (microbiota) in this selective impairment is still poorly understood. The aim of this study was to describe and compare fecal microbiota of horses suffering from atypical myopathy and healthy co-grazers. We concluded that fecal microbiota of horses suffering from atypical myopathy is different from their co-grazers and changes are more severe in horses that do not survive the disease. Under-standing those changes may help in developing therapeutic and/or preventive strategies for horses at risk for atypical myopathy.
Abstract: Equine atypical myopathy (AM) is caused by hypoglycin A (HGA) and
methylenecyclo-propylglycine (MCPG) intoxication resulting from the ingestion of seeds or seedlings of some Acer tree species. Interestingly, not all horses pasturing in the same toxic environment develop signs of the dis-ease. In other species, it has been shown that the intestinal microbiota has an impact on digestion, metabolism, immune stimulation and protection from disease. The objective of this study was to char-acterize and compare fecal microbiota of horses suffering from AM and healthy co-grazers. Further-more, potential differences in fecal microbiota regarding the outcome of diseased animals were as-sessed. This prospective observational study included 59 horses with AM (29 survivors and 30 non-survivors) referred to three Belgian equine hospitals and 26 clinically healthy co-grazers simultane-ously sharing contaminated pastures during spring and autumn outbreak periods. Fresh fecal samples (rectal or within 30min of defecation) were obtained from all horses and bacterial taxonomy profiling obtained by 16S amplicon sequencing was used to identify differentially distributed bacterial taxa be-tween AM-affected horses and healthy co-grazers. Fecal microbial diversity and evenness were signif-icantly (p < 0.001) higher in AM-affected horses as compared with their non-affected co-grazers. The relative abundance of families Ruminococcaceae, Christensenellaceae and Akkermansiaceae were higher (p ≤ 0.001) whereas those of the Lachnospiraceae (p = 0.0053), Bacteroidales (p < 0.0001) and Clostridiales (p = 0.0402) were lower in horses with AM, especially in those with a poor prognosis. While significant shifts were observed, it is still unclear whether they result from the disease or might be involved in the onset of disease pathogenesis.
Keywords: equine; fecal; intestinal; microbiome; rhabdomyolysis; intoxication; hypoglycin A;
MCPA-CoA; Ruminococcaceae; Lachnospiraceae
Citation: Wimmer-Scherr, C.; Taminiau, B.; Renaud, B.; van Loon, G.; Palmers, K.; Votion, D.; Amory, H.; Daube, G.; Cesarini, C. Comparison of Fecal Microbiota of Horses Suffering from Atypical Myopathy and Healthy Co-Grazers.
Animals 2021, 11, 506. https://doi.org/
10.3390/ani11020506 Received: 5 January 2021 Accepted: 11 February 2021 Published: 15 February 2021 Publisher’s Note: MDPI stays neu-tral with regard to jurisdictional claims in published maps and insti-tutional affiliations.
Copyright: © 2021 by the authors. Licensee MDPI, Basel, Switzerland. This article is an open access article distributed under the terms and con-ditions of the Creative Commons At-tribution (CC BY) license (http://cre-ativecommons.org/licenses/by/4.0/).
1. Introduction
Outbreaks of equine atypical myopathy (AM) have occurred recurrently in Europe since the mid-1990s with more than 2500 cases reported in the last 10 years, mostly from central European countries [1,2]. The disease typically affects horses kept on pasture dur-ing sprdur-ing/autumn, causdur-ing a non-exercise-induced acute rhabdomyolytic syndrome, af-fecting mainly postural and respiratory muscles and myocardium [2,3]. Clinical disease has been associated with hypoglycin A (HGA) intoxication resulting from the ingestion of seeds or seedlings of some Acer tree species [4] in Europe, mainly Acer pseudoplatanus (syc-amore maple) [5]. Recently, it has been shown that methylenecyclopropylglycine (MCPG) is also involved in the development of the disease [6]. The clinical picture is characterized by the sudden onset of stiffness, muscular weakness, tachycardia and myoglobinuria, pro-gressing in many cases to recumbency, respiratory difficulties and death [7,8] Despite the discovery of its etiology, there is still no cure for AM and symptomatic therapy is often unsuccessful [7–9]. Horses and ponies of any age and breed can be affected, and the re-ported mortality rate ranges from 43% to 97% [7,10].
It is the general consensus that intestinal absorption of the protoxins HGA and MCPG and their subsequent transformation to toxic metabolites are needed to develop AM, lead-ing to rhabdomyolysis and, in many cases, even death [11]. Interestlead-ingly, and for a reason still unknown, not all horses pasturing in the same contaminated environment develop clinical signs of the disease. Published data show that HGA can be detected in the blood of clinically healthy horses pasturing in at-risk fields [5,12]. Although incidence of clinical disease has been linked to specific factors such as age, body condition, feeding and pasture management, the exact reason protecting certain horses from developing clinical signs remains largely unknown [5,12].
Studies in humans and animals have shown that intestinal microbiota has an impact on digestion, metabolism, immune stimulation and protection from pathogens and dis-ease [13–15]. Research in human medicine increasingly confirms a link between dysbiosis of the gut microbiota and the pathogenesis not only of intestinal, but also of extra-intesti-nal, diseases [16]. Similarly, when compared with healthy or control horses, differences in the intestinal microbiome have been confirmed for various common equine illnesses, such as equine metabolic syndrome, carbohydrate-induced laminitis, colic, colitis and equine grass sickness. However, the significance of these findings is yet unclear [17–22]. To date, no published studies have investigated the potential role of intestinal microbiota in equine AM.
A wide range of bacteria, including gut microbiota fermenters, are able to metabolize peptides and amino acids to use them for protein synthesis or the generation of metabolic energy [23,24]. Bacteria may also synthesize amino acids required for protein biosynthesis, creating a bilateral exchange between the gut microbiota and the host [25]. Branched-chain amino acids are metabolized in humans and in bacteria through the combined action of two enzymes, branched-chain amino acid aminotransferase (BCAT) and branched-chain oxoacid dehydrogenase (BCAD). Metabolism of MCPG and HGA to their active metabo-lites MCPF-CoA and MCPA-CoA is accomplished by the same two-step enzymatic system [24,26]. Specific intestinal bacteria containing the aforementioned enzymes could poten-tially contribute to the way HGA and MCPG are absorbed or metabolized in horses graz-ing contaminated pastures.
Our research hypothesis was that horses suffering from AM would have a different intestinal microbiota compared to their asymptomatic co-grazers. Horses showing clinical signs of AM could have a specific intestinal microbiome that contributes to or protects them from the development of disease. Decoding pathways of intoxication and/or identi-fying protective mechanisms against developing clinical disease could help in improving prevention and treatment of this devastating pathology. The objective of this study was to characterize and compare fecal microbiota of horses with AM and their healthy co-grazers. Furthermore, potential differences in fecal microbiota regarding the outcome of diseased animals were assessed.
2. Materials and Methods
2.1. Study Design and Sample Collection
A prospective clinical study was conducted from autumn 2016 till spring 2019. The studied population included horses diagnosed with AM in three Belgian equine referral hospitals (i.e., Clinique Vétérinaire Universitaire de Liège, Faculty of Veterinary Medicine Ghent University, Dierenkliniek de Morette) during the study period. Whenever it was possible, for each sick horse, one or more healthy co-grazers were included in the study. Information about diet was collected retrospectively from the clinical records of hospital-ized animals.
A fresh fecal sample was obtained from each horse involved in the study. Sick horses were sampled at the time of admission to the clinic. Co-grazers were sampled at home, within 24 h since the first affected horse in the pasture showed clinical signs of AM. The 24 h limit was set in order to avoid the potential effect of management changes (i.e., die-tary changes, being retired from pasture) implemented by the owner after confirmation of AM diagnosis to prevent disease in co-grazers. Fecal samples were collected in all cases directly from the rectal ampulla or from a pile of recently passed feces (< 30min). The core of a fecal ball was sampled in order to avoid external bacterial contamination [27] and immediately placed in a conservation milieu (Stool DNA stabilizer, PSP® Spin Stool DNA
Plus Kit 00310, Invitek, Berlin, Germany) and stored at −20 °C until total bacterial DNA extraction.
2.2. Inclusion Criteria and Group Definition
Three separate groups were defined for the purpose of this study, referred to as atyp-ical myopathy non-survivors (AM-NS), atypatyp-ical myopathy survivors (AM-S) and healthy co-grazers (CG).
Diagnosis of AM was made based on:
• a tentative diagnosis of AM based on the algorithm proposed by van Galen et al. (2012) [7], i.e., a compatible history (non-exercise-induced acute rhabdomyolysis syn-drome in a horse kept at pasture) and clinical signs highly suggestive of AM (i.e., acute onset of muscle weakness, stiffness and/or pigmenturia) during spring/au-tumn,
• elevated serum creatinine kinase activity, presence of HGA and MCPA-carnitine in serum and/or modified acylcarnitine profile compatible with the diagnosis of AM, when available [28,29].
Survivors were discharged from the clinic after a variable hospitalization period, whereas non-survivors died naturally from the disease during hospitalization or had to be euthanized due to significant clinical deterioration, continuous or unmanageable pain, prognostic or economic reasons.
For the purpose of this study, a healthy co-grazer was defined as a horse:
• grazing in a pasture where a case of AM had been diagnosed in the previous 24 h. • having a normal clinical and dynamic examination at walk (no signs of AM or other
obvious disease) at the time of sampling.
2.3. Bacterial DNA Extraction and High-Throughput Sequencing
Total bacterial DNA was extracted from the stool samples with the PSP Spin Stool DNA Plus Kit 00310 (Invitek, Berlin, Germany), following the manufacturer’s recommen-dations.
PCR amplification of the 16S rDNA V1–V3 hypervariable region and library prepa-ration were performed with the following primers (with Illumina overhand adapters),
forward (50-GAGAGTTTGATYMTGGCTCAG-30) and reverse (50-AC-CGCGGCTGCTGGCAC-30). Each PCR product was purified with the Agencourt AM-Pure XP bead kit (Beckman Coulter, Pasadena, CA, USA) and submitted to a second PCR round for indexing, using Nextera XT index primers 1 and 2.After purification, PCR prod-ucts were quantified using the Quant-IT PicoGreen (ThermoFisher Scientific; Waltham, MA, USA) and diluted to 10 ng/µL. A final quantification of each library was performed using the KAPA SYBR® FAST qPCR Kit (KapaBiosystems; Wilmington, MA, USA) before
normalization, pooling and sequencing on a MiSeq sequencer using V3 reagents (Illu-mina; San Diego, CA, USA). Positive controls using DNA from 20 defined bacterial species and negative controls (from extraction and PCR steps) were included in the sequencing run [30].
Raw amplicon sequencing libraries were submitted to the NCBI database under bi-oproject number PRJNA682516.
2.4. Sequence Analysis and 16S rDNA Profiling
Sequence read processing was performed as previously described [30] using the MOTHUR software package v141.1 [31] and VSEARCH algorithm for chimera detection [32]. A clustering distance of 0.03 was used for operational taxonomic unit (OTU) genera-tion. 16S reference alignment and taxonomical assignment from phylum to genus were done with MOTHUR and were based upon the SILVA database (v1.32) of full-length 16S rDNA sequences [33].
Subsample datasets with 8994 cleaned reads per sample were obtained and used to evaluate ecological indicators (Good’s coverage, Chao richness index, reciprocal Simpson microbial diversity, and Simpson derived evenness of the samples) and β-diversity (using a distance Bray–Curtis dissimilarity matrix) using MOTHUR. When assessing the ecology of a community (e.g., microbial), α-diversity measures the diversity within the community as opposed to β-diversity which measures diversity between communities (or the same community at different time points) [34]. Richness is a measure of the number of species in the community and evenness expresses how evenly the individuals in the community are distributed over the different species (e.g., presence of predominant species) [35]. The Good’s coverage estimates what percentage of the total species of a community is repre-sented in a sample.
2.5. Data Analysis
Differences between groups (AM-NS, AM-S, CG) for the different ecological indices of the microbial population were assessed with a non-parametric Kruskal–Wallis test fol-lowed by paired post hoc tests corrected with a two-stage linear step-up procedure of Benjamini, Krieger and Yekutieli using PRISM 7 (Graphpad Software; San Diego, CA, USA). Differences were considered significant for a q-Value or a p-Value < 0.05.
β-diversity was visualized with a Bray–Curtis dissimilarity matrix-based non-para-metric dimensional scaling (NMDS) model using vegan pro-ject.org/web/packages/vegan/index.html) and vegan3d packages (https://cran.r-project.org/web/packages/vegan3d/index.html) in R. Sample clustering and beta-disper-sion were respectively assessed in a Bray–Curtis dissimilarity matrix with analysis of mo-lecular variance (AMOVA) and homogeneity of momo-lecular variance (HOMOVA) tests us-ing MOTHUR (usus-ing 10,000 iterations on the subsampled table). AMOVA determines whether the genetic diversity within two or more communities is greater than their pooled genetic diversity, and HOMOVA determines whether the amount of genetic diversity in each community is significantly different [36].
Finally, significant differential bacterial population abundance between groups was performed with two-way ANOVA with a Benjamini–Hochberg false discovery rate cor-rection using the population subsampled table where null median populations were re-moved.
3. Results
3.1. Animals
A total of 85 horses were included in the study. These included 59 horses diagnosed with AM, of which 29 were survivors (AM-S) and 30 were non-survivors (AM-NS), and 26 co-grazers (CG).
The AM-S group included 13 mares, 10 geldings and 6 stallions of a wide variety of breeds (7 Warmbloods, 4 ponies, 3 Haflingers, 3 Arabians, 2 Standardbreds and 10 horses from other breeds) with a median age of 6.9 years (range 0.4 to 25 years).
The AM-NS group included 13 mares, 13 geldings and 4 stallions of different breeds (including 10 Warmbloods, 5 ponies, 2 Andalusians, 2 Friesians and 11 horses from other breeds) with a median age of 7.5 years (range 0.5 to 22 years). From the 30 non-survivors, 6 died naturally from the disease and 23 were euthanized. Information about the cause of death was missing for one horse.
Concurrently, feces of 26 co-grazers were collected. The co-grazer group included 9 mares, 4 geldings and one stallion. Different breeds were represented, including 4 Arabi-ans, 4 Warmbloods, 3 ponies and 11 horses from other breeds. The median age of this group was 8.1 years (range 0.6 to 25 years).
Diet
All horses included in the present study had access to pasture, including 35 horses that were living 24 h a day on pasture. Twenty-one horses (14 AM-NS, 7 AM-S) were eating 100% roughage (pasture with or without hay supplement), whereas 11 received some kind of sweet feed supplement on top of roughage or pasture (6 AM-NS, 4 AM-S and 1 CG). Unfortunately, information about diet was unavailable or poorly specified (i.e., lacking amount or type of hay or sweet feed) for 53 of the 85 horses included in this study (10 AM-NS, 18 AM-S and 25 CG).
3.2. Analysis of Microbial Population
From 12,025,466 raw sequencing reads, 10,225,098 and 8,353,193 reads were obtained, respectively, after the cleaning process and chimera removal, with a final median read length of 492 nucleotides. Eight thousand nine hundred and ninety-four reads per sample were retained as a subsampling process to proceed with OTU binning (0.03 cut-off) for a total of 23,406 OTUs regrouped into 583 populations at the genus level. Mean Good’s cov-erage at the genus level was 99.6%, with no statistical difference between groups.
3.3. α-Diversity and β-Diversity Analysis
Microbial population ecological indices of fecal samples were assessed at the genus level and are shown in Figure 1.
Results of the Kruskal–Wallis test yielded significant global differences between groups for bacterial alpha-diversity and evenness but not for richness, meaning that the number of bacterial genera present in the feces was not significantly different between groups.
According to results of the paired post hoc test, diversity was significantly higher in horses with AM (survivors and non-survivors) than in CG (q-Value < 0.001). No significant differences were found between survivors and non-survivors (q-Value = 0.969).
Similarly, genus evenness was found to be significantly higher in horses with AM (sur-vivors and non-sur(sur-vivors) than in CG (q-Value < 0.0001). This means that the distribution of bacterial genera (relative abundance) in the feces of horses with AM is more uniform than in the feces of CG, where there is a more marked predominance of certain genera. No sig-nificant differences were found between survivors and non-survivors (q-Value = 0.616).
Figure 1. Bacterial intrinsic diversity deduced from inverse Simpson index (A). Bacterial genus richness deduced from
Chao1 index (B). Bacterial genus evenness deduced from Simpson index (C). Data are scatter dot plots at the genus level for individual horses in the three defined groups with the mean and standard deviation. Data with different superscript letters are significantly different at q < 0.05 (Kruskal–Wallis).
β-diversity of the fecal microbial profile was visualized using an NMDS model (three dimensions, stress 0.092) (Figure 2).Group clustering testing (AMOVA) revealed signifi-cant differences between CG and horses diagnosed with AM (p-Value < 0.00001). No sig-nificant differences were found between survivors and non-survivors (p-Value = 0.2074). HOMOVA testing yielded significant results, indicating that the amount of population homogeneity in the fecal microbiota was significantly different between CG and horses diagnosed with AM (CG vs. AM-S p-Value < 0.00002, CG vs. AM-NS p-Value = 0.0001). No significant differences were found between survivors and non-survivors (p-Value = 0.8098).
Figure 2. Nonmetric dimensional scaling with three axes of the three horses groups (co-grazers:
CG, atypical myopathy Scheme 0.
3.4. Composition of Fecal Microbiota
A total of 13 different phyla were identified in the feces, the most abundant being Firmicutes and Bacteroidetes. The distribution of the main families and genera and their relative abundance in the three groups of horses is depicted in Figure 3.
At a family level, the most abundant families observed were Ruminococcaceae, Lach-nospiraceae, Clostridiales_fa, Bacteria_fa, Bacteroidales_fa, Rikenellaceae, Christensenel-laceae, WCHB1-41_fa, Prevotellaceae and p251-o5.
At a genus level, the most abundant defined genera observed were
Lachnospi-raceae_ge, Ruminococcaceae_ge, Clostridiales_ge, Bacteria_ge, Bacteroidales_ge, Rikenel-laceae_RC9_gut_group, Ruminococcaceae_UCG-010, Christensenellaceae_R-7_group, WCHB1-41_ge, Ruminococcaceae_NK4A214_group, p-251-o5_ge and Ruminococcus_1.
Figure 3. Changes in bacterial populations in the fecal content, assessed by 16S V1-V3 profiling. The bar chart depicts the
relative abundance of the bacterial families (A) and bacterial genera (B) accounting for more than 1% of the total abun-dance in the feces. Co-grazers (CG) were compared to horses diagnosed with atypical myopathy (AM) with different outcomes (survivors, S, and non-survivors, NS).
3.5. Statistical Differences in Fecal Microbiota Composition
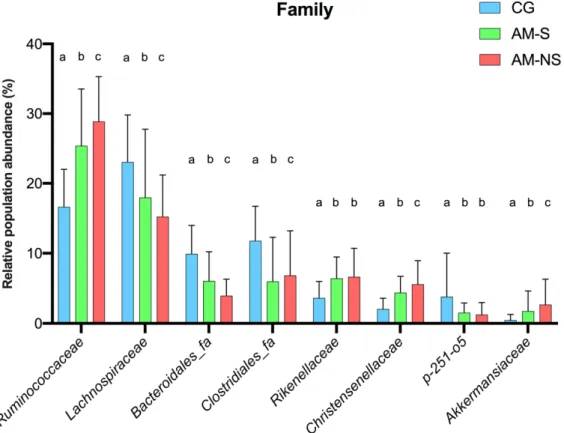
According to global ANOVA results, the relative abundance of eight families differed significantly between horses diagnosed with AM compared to CG: Ruminococcaceae (p < 0.0001), Lachnospiraceae (p = 0.0053), Clostridiales_fa (p = 0.0402), Bacteroidales_fa (p < 0.0001), Rikenellaceae (p = 0.0062), Christensenellaceae (p < 0.0001), p-251-o5 (p = 0.0203) and Akkermansiaceae (p = 0.0016). A comparison of the relative abundance of these fam-ilies between the different groups is shown in Figure 4 and Table 1.
Relative abundances of Ruminococcaceae, Lachnospiraceae, Bacteroidales_fa Clos-tridiales_fa, Christensenellaceae and Akkermansiaceae were significantly different be-tween CG and horses diagnosed with AM, as well as bebe-tween AM survivors and non-survivors (p < 0.05 for all comparisons). Interestingly, the relative abundance of each fam-ily increased (Ruminococcaceae, Christensenellaceae, Akkermansiaceae) or decreased (Lachnospiraceae, Bacteroidales_fa, Clostridiales_fa) gradually from CG to non-surviving horses suffering from AM (Figure 4).
Relative abundances of Rikenellaceae and p-251-o5 were lower in CG compared to horses diagnosed with AM (q-Value < 0.0001), but no differences were found between AM survivors and non-survivors. Rikenellaceae were less abundant in CG compared to horses with AM (p < 0.0001), whereas p-251-o5 were more abundant in CG compared to horses with AM (p < 0.0001).
Figure 4. Changes in bacterial family populations in the feces, assessed by 16S V1-V3 profiling and
expressed as relative population abundance. Bar plot shows mean value with standard deviation of selected families whose relative abundance is significantly different between the groups (two-way ANOVA with Benjamini–Hochberg false discovery rate correction). Data with different su-perscript letters are significantly different at q < 0.05. Corresponding global p-Values and q-Values can be found in Table 1. CG: Co-grazers, AM-S: Atypical myopathy survivors, AM-NS: Atypical myopathy non-survivors.
Table 1. q-Values corresponding to comparisons between groups (two-way ANOVA with
Benja-mini–Hochberg false discovery rate correction) of the eight families depicted in Figure 4. CG: Co-grazers, AM-S: Atypical myopathy survivors, AM-NS: Atypical myopathy non-survivors.
Family Global p-Values
(corrected) CG vs. AM-S CG vs. AM-NS S vs. AM-NS Ruminococcaceae <0.0001 <0.0001 <0.0001 <0.0001 Lachnospiraceae 0.0053 <0.0001 <0.0001 <0.0001 Bacteroidales_fa <0.0001 <0.0001 <0.0001 <0.0001 Clostridiales_fa 0.0402 <0.0001 <0.0001 0.0331 Rikenellaceae 0.0062 <0.0001 <0.0001 0.2263 Christensenellaceae <0.0001 <0.0001 <0.0001 0.0176 p-251-o5 0.0203 <0.0001 <0.0001 0.2147 Akkermansiaceae 0.0016 0.0067 <0.0001 0.0249
Bold values represent q-Value < 0.05.
At a genus level, ANOVA global results showed that the relative abundance of 11 genera differed significantly between horses diagnosed with AM compared to those of the CG group: Lachnospiraceae_ge (p = 0.0009), Bacteroidales_ge (p = 0.0001),
Christensenel-laceae_R-7_group (p = 0.0002), Ruminococcaceae_NK4A214_group (p < 0.0001), Ruminococ-cus_1 (p = 0.0080), Akkermansia (p = 0.0017), Ruminococcaceae_UCG-002 (p = 0.0010), Rikenel-laceae_RC9_gut_group (p = 0.0075), Ruminococcaceae_UCG-010 (p = 0.0011), p-251-o5_ge (p =
0.0278), Bacteroidia_ge (p = 0.0026). A comparison of the relative abundance of these genera between the different groups is shown in Figure S1 and Table S1 (Supplementary Data).
Relative abundances of Lachnospiraceae_ge and Bacteroidales_ge were higher in CG compared to diseased horses, whereas Christensenellaceae_R-7_group,
Ruminococca-ceae_NK4A214_group, Ruminococcus_1, Akkermansia and Ruminococcaceae_UCG-002 were
lower in CG than in horses diagnosed with AM (p < 0.05 for all comparisons). Relative abundances of Lachnospiraceae_ge, Bacteroidales_ge and Ruminococcus_1 were higher in AM-S compared to AM-NAM-S, whereas Christensenellaceae_R-7_group,
Ruminococca-ceae_NK4A214_group, Akkermansia and Ruminococcaceae_UCG-002 were lower in AM
sur-vivors compared to non-sursur-vivors (p < 0.05 for all comparisons). Similarly to results at the family level, the relative abundance of most of those genera increased
(Christensenel-laceae_R-7_group, Ruminococcaceae_NK4A214_group, Akkermansia and Ruminococca-ceae_UCG-002) or decreased (Lachnospiraceae_ge, Bacteroidales_ge) gradually from CG to
non-surviving horses suffering from AM (Figure S1 in Supplementary Data).
Relative abundances of Rikenellaceae_RC9_gut_grou, Ruminococcaceae_UCG-010 and
p-251-o5_ge were significantly different between CG and horses diagnosed with AM (p <
0.05 for all comparisons), but no differences were found between AM survivors and non-survivors. Rikenellaceae_RC9_gut_grou and Ruminococcaceae_UCG-010 were significantly less abundant in CG in regard to horses with AM, whereas p-251-o5_ge were significantly more abundant in CG in regard to horses with AM (p < 0.05 for all comparisons).
4. Discussion
This study demonstrates significant differences in the structure and composition of fecal microbiota in horses with AM in regard to their healthy co-grazers. Diversity was significantly higher in horses with AM (survivors and non-survivors) and relative abun-dances of certain bacterial families were significantly higher (Ruminococcaceae, Chris-tensenellaceae, Rikenellaceae and Akkermansiaceae) or lower (Lachnospiraceae, Clostrid-iales_fa, Bacteroidales_fa, p-251-o5) than in co-grazers. Interestingly, most of these bacte-rial shifts were significantly more pronounced in non-survivors.
When interpreting microbiome changes associated with a specific disease, two hy-potheses arise: changes can be either a trigger or a consequence of the disease. A specific microbiome (or its metabolome) can be a predisposing/protecting factor for the disease, providing each individual with a major or minor susceptibility to the disease. On the other hand, the disease process itself can induce more or less profound changes in the microbi-ome of an individual. Untangling the cause–consequence relationship between the intes-tinal microbiome and AM in horses might aid in developing therapeutic and/or preven-tive strategies for at-risk horses.
4.1. Differences in Community Structure between CG and Horses with AM
Fecal bacterial richness did not appear to be affected by clinical disease in the present study, but diversity and evenness were significantly higher in horses with AM than in CG.
Diseases characterized by bacterial dysbiosis in horses, such as colitis, have been as-sociated with lower diversity, lower richness and lower evenness in fecal microbiota in regard to healthy horses [37,38]. Changes in fecal bacterial diversity have also been ob-served to be associated with other equine disorders, such as equine metabolic syndrome (EMS). Horses with EMS showed lower fecal microbial diversity when compared to con-trols in one study [19], whereas horses suffering from naturally occurring chronic lamini-tis showed higher fecal microbial diversity compared to non-laminitic control horses [39]. In vitro and in vivo studies have demonstrated a causative link of carbohydrate-induced laminitis and alterations in the gut microbiome [18,40–42], however, the relevance of fecal bacterial diversity changes concerning horses with EMS or AM remains to be determined. Similarly to humans [43], one study reported a reduction in fecal microbial diversity in aged animals (19 to 25 years old) in regard to adult horses (5 to 12 years old), although
no significant differences in specific bacterial populations were found [44]. In the present study, the median and range of age of the three groups of horses compared were quite similar, so a bias of age affecting the results is unlikely.
Taking into account that horses diagnosed with AM were treated in referral hospi-tals, and most co-grazers were sampled at the barn, transport to the hospital could have interfered with disease-associated results. A recent study found that transportation of healthy horses to a hospital facility resulted in an increase in richness and Shannon diver-sity index which normalized within 24 h [45]. On the contrary, a previous study did not find any effect of transport on alpha-diversity indices in adult horses after 1h of transport (richness, diversity, evenness) [46]. In the present study, the vast majority of diseased horses had a transport time to the hospital ranging from 30 min to 2 h.
This is, to our knowledge, the first study assessing microbiota in horses with AM [7,47]. The interpretation of increased diversity and evenness in the AM group is not clear to date. The effect of HGA or MCPG on fecal microbiota has never been studied in the equine species, so it remains unknown if protoxins (or their toxic metabolites) could alter the structure or composition of fecal microbiota in horses ingesting them.
4.2. Differences in Community Composition Between CG and Horses with AM
The predominant phyla in the three groups of this study were Firmicutes and Bac-teroidetes. Bacterial shifts observed between horses suffering from AM and healthy co-grazers affected mainly families and genera included in the core equine intestinal micro-biota [17,48–50]. The term “core micromicro-biota” refers to the key bacterial populations which are present in most individuals, probably playing essential roles and defining what is con-sidered as a “healthy microbiota” [51].
Lachnospiraceae and Ruminococcaceae are members of the Firmicutes phylum and constitute two of the main families of active bacteria present in the distal gut of both hu-mans and horses [52,53]. Both families play important roles in gastrointestinal health: they are cellulolytic, fibrolytic bacteria, and major producers of short-chain fatty acids [51]. Some of the species in these families produce butyrate, which has been related to a healthy colonic mucosa [54]. Several studies have shown consistently lower relative abundances of Lachnospiraceae and Ruminococcaceae families in humans and animals with gastroin-testinal disease [13,17,37].
Evidence in human and equine medicine shows that diet, particularly dietary carbo-hydrates, can influence the composition and stability of the gut microbiome [44,55–58]. A study found that the relative abundances of Lachnospiraceae and Bacteroidetes were sig-nificantly greater and Ruminococcaceae sigsig-nificantly lower in concentrate-fed horses compared with grass-fed horses [59]. All horses included in the present study had access to pasture, including 35 horses that were living 24 h a day on pasture. Twenty-one horses were eating 100% roughage (pasture with or without hay supplement), whereas 11 re-ceived some kind of sweet feed supplement on top of roughage or pasture. Unfortunately, information about diet was unavailable or poorly specified (i.e., lacking amount or type of hay or sweet feed) for 53 of the 85 horses included in this study, which makes it difficult to interpret and discuss the results in relation to diet. However, as the CG horses were kept on the same pastures as the AM-affected horses, they most likely received the same diet as the diseased horses, as grazing horses are very rarely fed individually.
The Lachnospiraceae family is the main component of a select core bacterial commu-nity which is found in all horses regardless of age or diet, and some authors suggest that it could explain why horses are especially susceptible to metabolic dysfunction [44]. Mem-bers of this family seem to play a protective role against disease in humans and animals. It has been suggested that the indigenous microbiota could inhibit the colonization of pathogenic bacteria by several mechanisms, including the production of metabolites such as short-chain fatty acids, bacteriocins or other antimicrobial compounds, as well as com-peting for limiting nutrients (nutrient niche hypothesis) [60]. Many members of the family Lachnospiraceae are relevant for the growth of other microbes and host epithelial cells
due to their production of butyric acid. Based on this ability, Lachnospiraceae have been associated with protection from colon cancer in humans by activating the activating pro-tein 1 (AP-1) signaling pathway in human epithelial cells [61–63]. This pathway, among others, is involved in cellular growth control, and therefore regulates cell life or death in connection with extracellular stimuli [64]. If the same mechanism happens in equine in-testinal epithelial cells, a decrease in Lachnospiraceae might impact their proliferation and likely affect the mucosal barrier function, making it easier for undesired gut contents, like toxins, to trespass into the circulation. However, more studies are needed to confirm this link, especially in horses. As horses with AM seem to have a decrease in the relative abun-dance of Lachnospiraceae, it can be hypothesized that the aforementioned protective roles of this family are diminished in horses suffering from the disease, which could potentially favor disease progress. Further investigation of this link might aid in discovering preven-tative or treatment strategies against AM.
The family Christensenellaceae, within the bacterial phylum Firmicutes, has gained increasing recognition in recent years due to its strong link to human body condition (BC), as shown in multiple studies investigating different populations. An inverse relationship between host body mass index (BMI) and the relative abundance of Christenellaceae has been demonstrated in humans, and an adaptation of the relative abundance of this family has been observed in fecal microbiota when obese individuals are losing weight [65–67]. Interestingly, a previous study demonstrated that lean horses were more prone to devel-oping clinical signs of AM [3]. However, to the authors’ knowledge, a correlation between BC and the relative abundance of Christenellaceae has not yet been demonstrated in horses, but it could be interesting to evaluate. Body condition was not adequately refer-enced for all horses included in this study but available information from hospital files revealed an average BC for most diseased horses (4–5/9 Henneke BC score), with no cases of extreme obesity or emaciation.
Evidence concerning the relation between the microbiota composition and BC in horses is conflicting to date [44,68,69]. Similarly to the present results, a study in horses with EMS found an increase in the family Akkermansiaceae (phylum Verrucomicrobia) in regard to control horses [19]. The genus Akkermansia, a group of mucolytic mucosa-associated bacteria, has received special attention in the literature as a biomarker for a healthy intestine as its relative abundance is inversely correlated to human intestinal dis-ease, such as inflammatory bowel disdis-ease, Crohn’s disdis-ease, ulcerative colitis and appen-dicitis, but also extra-intestinal issues such as obesity and autism in children [70–75]. In-terestingly, those bacteria seem to thrive following decreased intestinal nutrient availabil-ity, as seen in intestinal contents of human patients after gastric bypass surgery or the cecum of hamsters that are fasted [73,76]. Oral administration of Akkermansia spp. has been shown to improve glucose tolerance in obese mice [77]. Such effects could be interesting in a situation of impaired lipid metabolism but preserved glycolytic pathways, as is the case for AM-affected horses [78].
Whether these bacterial shifts observed in horses with AM when compared to co-grazers are a consequence of the intoxication or occurred prior to ingestion of the protoxin remains to be determined. Prospective studies following exposure to the toxin and its con-sequences on fecal microbiota in horses grazing in at-risk pastures could help to answer that question.
4.3. Association with Outcome in Horses with AM
Most bacterial shifts observed in this study between horses suffering from AM and healthy co-grazers were significantly more pronounced in non-survivors than in survi-vors. This gradual increase/decrease in certain bacterial populations in the feces of horses with AM associated with severity of the disease could suggest a dysbiosis that worsens as the disease progresses. The significance of this finding is unclear, and the nature of this correlation remains to be determined. but may be related to the amount of toxin ingested, which could be higher in non-survivors. Because the study was conducted in naturally
occurring cases of AM, the exact amount of HGA and MCPG ingested by each horse re-mains undetermined, and this factor might have influenced morbidity and mortality. However, the serum acylcarnitine profile (Table S2) of non-surviving horses in this study showed more severe changes than in survivors, suggesting worse metabolic imbalances in horses with a poor outcome. The serum acylcarnitine profile has been shown to be a good predictor for survival in horses with AM [29].
Considering the potential of some bacteria to metabolize amino acids, another hy-pothesis could be that intestinal microbiota might contribute to the conversion of HGA into MCPA-CoA, accelerating the intoxication process. A wide range of bacteria, includ-ing the genera Fusobacterium, Bacteroides, Propionibacterium, Actinomyces, Peptococcus,
Strep-tococcus, Ruminococcus, Megasphaera and even Enterobacteria (Escherichia coli, Klebsiella sp., Streptococcus sp.), have been reported as being responsible for amino acid metabolism in
the gut [24,79]. Whether the significantly increased relative abundance of Ruminococca-ceae observed in this study in horses suffering from AM is related to this latter hypothesis remains to be determined and deserves further study.
4.4. Limitations
This study has certain limitations. Single samples, in general, provide more limited information than a multiple sample follow-up. The results are based on fecal microbiota, which is acceptable to represent the distal part of the equine digestive system, but cannot be used to predict microbiota of the proximal digestive tract [48,80]. Whether the micro-biota of the proximal intestinal tract is altered in horses with AM and how this affects progression of the disease remain to be studied. Furthermore, only the bacterial popula-tions in the feces were analyzed, leaving out the small but significant groups of eukary-otes, archaea, viruses and fungi that are equally present in the gastrointestinal tract [81].
Dietary management is known to affect the composition of fecal microbiota and diet was not homogeneous in this study (i.e., some horses received sweet feed supplement whereas other received only roughage). Unfortunately, a lot of detail on dietary data was missing, which made it difficult to analyze, interpret and discuss the results in regard to diet groups. It should be noted that not all horses included in the study had a correspond-ing co-grazer in the CG group. Some horses were livcorrespond-ing alone and no companions were available, sometimes all horses in the same pasture were sick or management of co-grazers from a sick case had already been modified by the owner (e.g., removal from pasture, dietary supplementation) before the 24 h window.
Some of the horses in our study were humanely euthanized rather than dying natu-rally from the disease, which might have created a bias in the AM-NS group and therefore influenced our results regarding disease outcome. On the other hand, the severity of ical signs in horses that were euthanized was clearly more pronounced compared to clin-ical signs of survivors, which in most cases ultimately led to the decision to euthanize the animal.
Finally, diseased horses included in this study were referred cases and sometimes the field practitioner had administered some medication prior to referral (i.e., charcoal or paraffin oil, non-steroidal anti-inflammatory drugs and/or vitamins) which could have influenced the results of this study. Fecal sampling in sick horses was performed on ad-mission to the hospital, and in most cases within the first 24 h of clinical manifestation of the disease. In consequence, it seems very unlikely that any treatment administered by the veterinarian may have influenced the composition of fecal microbiota in these horses. 5. Conclusions
This study demonstrates significant differences in the structure and composition of the fecal microbiota of AM-affected horses when compared to their non-affected co-graz-ers. The families Ruminococcaceae, Christensenellaceae and Akkermansiaceae increased, whereas the Lachnospiraceae, Bacteroidales and Clostridiales decreased in horses with AM, especially in those with a poor prognosis. Further studies are needed to determine if
those changes precede the disease or are a consequence of the intoxication. Either way, the findings of this study constitute a first step in understanding the possible role of in-testinal microbiota in AM and may open new fields for the prevention and treatment of this devastating disease.
Supplementary Materials: The following are available online at
www.mdpi.com/2076-2615/11/2/506/s1. Figure S1: Changes in bacterial genus populations in the feces assessed by 16S V1-V3 profiling and expressed as relative population abundance, Table S1: q-Values corresponding to comparisons between groups (two-way ANOVA with Benjamini–Hochberg false discovery rate cor-rection) of the 11 genera depicted in Figure S1. Table S2: Serum acylcarnitine concentrations from horses with AM included in this study.
Author Contributions: Conceptualization, B.T., D.V. and C.C.; Data curation, C.W.-S., B.R., G.v.L.,
K.P. and C.C.; Formal analysis, C.W.-S. and B.T.; Funding acquisition, H.A., G.D. and C.C.; Investi-gation, C.W.-S., G.v.L., K.P. and C.C.; Resources, B.R., K.P. and C.C.; Visualization, C.W.-S., B.T. and C.C.; Writing—original draft, C.W.-S., B.T. and C.C.; Writing—review and editing, C.W.-S., B.T., B.R., G.v.L., K.P., D.V., H.A., G.D. and C.C. All authors have read and agreed to the pub-lished version of the manuscript.
Funding: The costs associated with the collection of field samples and blood test analysis required
for AM diagnosis were supported by the Wallonian Public Service of Agriculture (Service public de Wallonie; Belgique). Microbiota analyses were supported by “Les Fonds Spéciaux pour la Re-cherche (FSR)” of Liege University (Belgium).
Institutional Review Board Statement: Ethical review and approval were waived for this study due
to use of clinical data from medical records or obtained with non-invasive procedures.
Data Availability Statement: Publicly available datasets were analyzed in this study. This data can
be found here: NCBI database, bioproject number PRJNA682516.
Acknowledgments: The authors want to thank Simona Cerri for her collaboration in the initial
steps of this project, as well as Jochen Maes, Charlotte Roose, Caroline Ribonet and Laurence Léfère for their contributions to sampling and collecting case information. The sequencing libraries were sequenced at the GIGA Genomics-Proteomics facility by Papa Abdoulaye Fall.
Conflicts of Interest: The authors declare no conflict of interest. References
1. Votion, D.-M.; François, A.-C.; Kruse, C.; Renaud, B.; Farinelle, A.; Bouquieaux, M.-C.; Marcillaud-Pitel, C.; Gustin, P. Answers to the Frequently Asked Questions Regarding Horse Feeding and Management Practices to Reduce the Risk of Atypical Myo-pathy. Animals 2020, 10, 365.
2. Votion, D.-M.; Serteyn, D. Equine Atypical Myopathy: A Review. Vet. J. 2008, 178, 185–190.
3. Votion, D.-M.; Linden, A.; Delguste, C.; Amory, H.; Thiry, E.; Engels, P.; van Galen, G.; Navet, R.; Sluse, F.; Serteyn, D.; et al. Atypical Myopathy in Grazing Horses: A First Exploratory Data Analysis. Vet. J. 2009, 180, 77–87.
4. Unger, L.; Nicholson, A.; Jewitt, E.M.; Gerber, V.; Hegeman, A.; Sweetman, L.; Valberg, S. Hypoglycin A Concentrations in Seeds of Acer Pseudoplatanus Trees Growing on Atypical Myopathy-Affected and Control Pastures. J. Vet. Intern. Med. 2014,
28, 1289–1293.
5. Baise, E.; Habyarimana, J.A.; Amory, H.; Boemer, F.; Douny, C.; Gustin, P.; Marcillaud-Pitel, C.; Patarin, F.; Weber, M.; Votion, D.-M. Samaras and Seedlings of Acer Pseudoplatanus Are Potential Sources of Hypoglycin A Intoxication in Atypical Myopa-thy without Necessarily Inducing Clinical Signs. Equine Vet. J. 2016, 48, 414–417.
6. Bochnia, M.; Sander, J.; Ziegler, J.; Terhardt, M.; Sander, S.; Janzen, N.; Cavalleri, J.-M.; Zuraw, A.; Wensch-Dorendorf, M.; Zeyner, A. Detection of MCPG Metabolites in Horses with Atypical Myopathy. PLoS ONE 2019, 14, e0211698.
7. Van Galen, G.; Marcillaud Pitel, C.; Saegerman, C.; Patarin, F.; Amory, H.; Baily, J.D.; Cassart, D.; Gerber, V.; Hahn, C.; Harris, P.; et al. European Outbreaks of Atypical Myopathy in Grazing Equids (2006–2009): Spatiotemporal Distribution, History and Clinical Features: Outbreaks of Atypical Myopathy: Spatiotemporal Distribution, History and Clinical Features. Equine Vet. J.
2012, 44, 614–620.
8. González-Medina, S.; Ireland, J.L.; Piercy, R.J.; Newton, J.R.; Votion, D.M. Equine Atypical Myopathy in the UK: Epidemiolog-ical Characteristics of Cases Reported from 2011 to 2015 and Factors Associated with Survival. Equine Vet. J. 2017, 49, 746–752. 9. Fabius, L.S.; Westermann, C.M. Evidence-Based Therapy for Atypical Myopathy in Horses. Equine Vet. Educ. 2018, 30, 616–622. 10. Dunkel, B.; Ryan, A.; Haggett, E.; Knowles, E.J. Atypical Myopathy in the South-East of England: Clinicopathological Data and
11. Krägeloh, T.; Cavalleri, J.M.V.; Ziegler, J.; Sander, J.; Terhardt, M.; Breves, G.; Cehak, A. Identification of Hypoglycin A Binding Adsorbents as Potential Preventive Measures in Co-Grazers of Atypical Myopathy Affected Horses. Equine Vet. J. 2018, 50, 220– 227.
12. Bochnia, M.; Ziegler, J.; Sander, J.; Uhlig, A.; Schaefer, S.; Vollstedt, S.; Glatter, M.; Abel, S.; Recknagel, S.; Schusser, G.F.; et al. Hypoglycin A Content in Blood and Urine Discriminates Horses with Atypical Myopathy from Clinically Normal Horses Graz-ing on the Same Pasture. PLoS ONE 2015, 10, e0136785.
13. Venable, E.B.; Bland, S.D.; McPherson, J.L.; Francis, J. Role of the Gut Microbiota in Equine Health and Disease. Anim. Front.
2016, 6, 43–49.
14. Jandhyala, S.M.; Talukdar, R.; Subramanyam, C.; Vuyyuru, H.; Sasikala, M.; Reddy, D.N. Role of the Normal Gut Microbiota.
World J. of Gastroenterol.: WJG 2015, 21, 8787.
15. Kamada, N.; Seo, S.-U.; Chen, G.Y.; Núñez, G. Role of the Gut Microbiota in Immunity and Inflammatory Disease. Nat. Rev.
Immunol. 2013, 13, 321–335.
16. Carding, S.; Verbeke, K.; Vipond, D.T.; Corfe, B.M.; Owen, L.J. Dysbiosis of the Gut Microbiota in Disease. Microb. Ecol. Health
Dis. 2015, 26, 26191.
17. Costa, M.C.; Arroyo, L.G.; Allen-Vercoe, E.; Stämpfli, H.R.; Kim, P.T.; Sturgeon, A.; Weese, J.S. Comparison of the Fecal Micro-biota of Healthy Horses and Horses with Colitis by High Throughput Sequencing of the V3-V5 Region of the 16S RRNA Gene.
PLoS ONE 2012, 7, e41484.
18. Milinovich, G.J.; Klieve, A.V.; Pollitt, C.C.; Trott, D.J. Microbial Events in the Hindgut During Carbohydrate-Induced Equine Laminitis. Vet. Clin. North. Am.: Equine Pract. 2010, 26, 79–94.
19. Elzinga, S.E.; Weese, J.S.; Adams, A.A. Comparison of the Fecal Microbiota in Horses With Equine Metabolic Syndrome and Metabolically Normal Controls Fed a Similar All-Forage Diet. J. Equine Vet. Sci. 2016, 44, 9–16.
20. Jevit, M.J. Microflora of the Equine Gut and Its Ramifications on the Development of Laminitis; A Comparison of Fecal and Cecal Diversity and Illumina and Roche 454 Sequencers. 2016.
21. Leng, J.; Proudman, C.; Darby, A.; Blow, F.; Townsend, N.; Miller, A.; Swann, J. Exploration of the Fecal Microbiota and Bi-omarker Discovery in Equine Grass Sickness. J. Proteome. Res. 2018, 17, 1120.
22. Stewart, H.L.; Southwood, L.L.; Indugu, N.; Vecchiarelli, B.; Engiles, J.B.; Pitta, D. Differences in the Equine Faecal Microbiota between Horses Presenting to a Tertiary Referral Hospital for Colic Compared with an Elective Surgical Procedure. Equine Vet.
J. 2019, 51, 336–342.
23. Dai, Z.-L.; Zhang, J.; Wu, G.; Zhu, W.-Y. Utilization of Amino Acids by Bacteria from the Pig Small Intestine. Amino acids 2010,
39, 1201–1215.
24. Dai, Z.-L.; Wu, G.; Zhu, W.-Y. Amino Acid Metabolism in Intestinal Bacteria: Links between Gut Ecology and Host Health.
Front. Biosci 2011, 16, 1768–86.
25. Davila, A.-M.; Blachier, F.; Gotteland, M.; Andriamihaja, M.; Benetti, P.-H.; Sanz, Y.; Tomé, D. Re-Print of “Intestinal Luminal Nitrogen Metabolism: Role of the Gut Microbiota and Consequences for the Host.” Pharmacol. Res. 2013, 69, 114–126.
26. Melde, K.; Jackson, S.; Bartlett, K.; Sherratt, H.S.A.; Ghisla, S. Metabolic Consequences of Methylenecyclopropylglycine Poison-ing in Rats. Biochem. J. 1991, 274, 395–400.
27. Stewart, H.L.; Pitta, D.; Indugu, N.; Vecchiarelli, B.; Engiles, J.B.; Southwood, L.L. Characterization of the Fecal Microbiota of Healthy Horses. Am. J. Vet. Res. 2018, 79, 811–819.
28. Westermann, C.M.; Dorland, L.; Votion, D.M.; de Sain-van der Velden, M.G.M.; Wijnberg, I.D.; Wanders, R.J.A.; Spliet, W.G.M.; Testerink, N.; Berger, R.; Ruiter, J.P.N.; et al. Acquired Multiple Acyl-CoA Dehydrogenase Deficiency in 10 Horses with Atypical Myopathy. Neuromuscul. Disord. 2008, 18, 355–364.
29. Boemer, F.; Detilleux, J.; Cello, C.; Amory, H.; Marcillaud-Pitel, C.; Richard, E.; van Galen, G.; van Loon, G.; Lefère, L.; Votion, D.-M. Acylcarnitines Profile Best Predicts Survival in Horses with Atypical Myopathy. PLoS ONE 2017, 12, e0182761.
30. Cerri, S.; Taminiau, B.; Lusancay, A.H.; Lecoq, L.; Amory, H.; Daube, G.; Cesarini, C. Effect of Oral Administration of Omepra-zole on the Microbiota of the Gastric Glandular Mucosa and Feces of Healthy Horses. J. Vet. Intern. Med. 2020, 34, 2727–2737. 31. Schloss, P.D.; Westcott, S.L.; Ryabin, T.; Hall, J.R.; Hartmann, M.; Hollister, E.B.; Lesniewski, R.A.; Oakley, B.B.; Parks, D.H.;
Robinson, C.J.; et al. Introducing Mothur: Open-Source, Platform-Independent, Community-Supported Software for Describing and Comparing Microbial Communities. AEM 2009, 75, 7537–7541.
32. Rognes, T.; Flouri, T.; Nichols, B.; Quince, C.; Mahé, F. VSEARCH: A Versatile Open Source Tool for Metagenomics. PeerJ 2016,
4, e2584.
33. SILVA Ribosomal RNA Gene Database Project: Improved Data Processing and Web-Based Tools | Nucleic Acids Research | Oxford Academic Available online: https://academic.oup.com/nar/article/41/D1/D590/1069277, (accessed on 11 December 2020). 34. Morris, E.K.; Caruso, T.; Buscot, F.; Fischer, M.; Hancock, C.; Maier, T.S.; Meiners, T.; Müller, C.; Obermaier, E.; Prati, D.
Choos-ing and UsChoos-ing Diversity Indices: Insights for Ecological Applications from the German Biodiversity Exploratories. Ecol. and Evol.
2014, 4, 3514–3524.
35. Chao, A. A New Statistical Approach for Assessing Compositional Similarity Based on Incidence and Abundance Data. Ecol.
Lett. 2005, 8, 148–159.
36. Excoffier, L.; Smouse, P.E.; Quattro, J.M. Analysis of Molecular Variance Inferred from Metric Distances among DNA Haplo-types: Application to Human Mitochondrial DNA Restriction Data. Genetics 1992, 131, 479–491.
37. Schoster, A.; Staempfli, H.R.; Guardabassi, L.G.; Jalali, M.; Weese, J.S. Comparison of the Fecal Bacterial Microbiota of Healthy and Diarrheic Foals at Two and Four Weeks of Life. BMC Vet. Res. 2017, 13, 144.
38. Rodriguez, C.; Taminiau, B.; Brévers, B.; Avesani, V.; Van Broeck, J.; Leroux, A.; Gallot, M.; Bruwier, A.; Amory, H.; Delmée, M. Faecal Microbiota Characterisation of Horses Using 16 Rdna Barcoded Pyrosequencing, and Carriage Rate of Clostridium difficile at Hospital Admission. BMC Microbiol. 2015, 15, 181.
39. Steelman, S.M.; Chowdhary, B.P.; Dowd, S.; Suchodolski, J.; Janečka, J.E. Pyrosequencing of 16S RRNA Genes in Fecal Samples Reveals High Diversity of Hindgut Microflora in Horses and Potential Links to Chronic Laminitis. BMC Vet. Res. 2012, 8, 231. 40. Bailey, S.R.; Adair, H.S.; Reinemeyer, C.R.; Morgan, S.J.; Brooks, A.C.; Longhofer, S.L.; Elliott, J. Plasma Concentrations of
En-dotoxin and Platelet Activation in the Developmental Stage of Oligofructose-Induced Laminitis. Vet. Immunol. and Immunopathol.
2009, 129, 167–173.
41. Tuniyazi, M.; He, J.; Guo, J.; Li, S.; Zhang, N.; Hu, X.; Fu, Y. Changes of Microbial and Metabolome of the Equine Hindgut during Oligofructose-Induced Laminitis. BMC Vet. Res. 2021, 17, 11.
42. Milinovich, G.J.; Trott, D.J.; Burrell, P.C.; Croser, E.L.; Al Jassim, R.A.; Morton, J.M.; Van Eps, A.W.; Pollitt, C.C. Fluorescence in Situ Hybridization Analysis of Hindgut Bacteria Associated with the Development of Equine Laminitis. Environ. Microbiol.
2007, 9, 2090–2100.
43. Woodmansey, E.J. Intestinal Bacteria and Ageing. J. Appl. Microbiol. 2007, 102, 1178–1186.
44. Dougal, K.; de la Fuente, G.; Harris, P.A.; Girdwood, S.E.; Pinloche, E.; Geor, R.J.; Nielsen, B.D.; Schott, H.C.; Elzinga, S.; New-bold, C.J. Characterisation of the Faecal Bacterial Community in Adult and Elderly Horses Fed a High Fibre, High Oil or High Starch Diet Using 454 Pyrosequencing. PLoS ONE 2014, 9, e87424.
45. Theelen M, Wagenaar M, Sloet van Oldruitenborgh- Oosterbaan MM, Rossen JWA, Schaafstra FJ, Van Doorn DA, Zomer AL Short–and Long-Term Effect of Hospitalization and Oral Trimethoprim-Sulfadiazine Administration on the Equine Faecal Mi-crobiome. Proceedings of the ECEIM Online Congress 2020, 20 November 2020.
46. Schoster, A.; Mosing, M.; Jalali, M.; Staempfli, H.R.; Weese, J.S. Effects of Transport, Fasting and Anaesthesia on the Faecal Microbiota of Healthy Adult Horses. Equine Vet. J. 2016, 48, 595–602.
47. Brandt, K.; Hinrichs, U.; Glitz, F.; Landes, E.; Schulze, C.; Deegen, E.; Pohlenz, J.; Coenen, M. Atypische Myoglobinurie Der Weidepferde. Pferdeheilkunde 1997, 13, 27–34.
48. Julliand, V.; Grimm, P. HORSE SPECIES SYMPOSIUM: The Microbiome of the Horse Hindgut: History and Current Knowledge1. J. Anim. Sci. 2016, 94, 2262–2274.
49. Li, Y.; Zhang, K.; Liu, Y.; Li, K.; Hu, D.; Wronski, T. Community Composition and Diversity of Intestinal Microbiota in Captive and Reintroduced Przewalski’s Horse (Equus Ferus Przewalskii). Front. Microbiol. 2019, 10, 1821.
50. Edwards, J.E.; Shetty, S.A.; van den Berg, P.; Burden, F.; van Doorn, D.A.; Pellikaan, W.F.; Dijkstra, J.; Smidt, H. Multi-Kingdom Characterization of the Core Equine Fecal Microbiota Based on Multiple Equine (Sub) Species. Anim. Microbiome 2020, 2, 1–16. 51. Kauter, A.; Epping, L.; Semmler, T.; Antao, E.-M.; Kannapin, D.; Stoeckle, S.D.; Gehlen, H.; Lübke-Becker, A.; Günther, S.;
Wieler, L.H. The Gut Microbiome of Horses: Current Research on Equine Enteral Microbiota and Future Perspectives. Anim.
Microbiome 2019, 1, 14.
52. Peris-Bondia, F.; Latorre, A.; Artacho, A.; Moya, A.; D’Auria, G. The Active Human Gut Microbiota Differs from the Total Microbiota. PLoS ONE 2011, 6, e22448.
53. Costa, M.C.; Silva, G.; Ramos, R.V.; Staempfli, H.R.; Arroyo, L.G.; Kim, P.; Weese, J.S. Characterization and Comparison of the Bacterial Microbiota in Different Gastrointestinal Tract Compartments in Horses. The Vet. J. 2015, 205, 74–80.
54. Roediger, W.E.W. The Colonic Epithelium in Ulcerative Colitis: An Energy-Deficiency Disease? The Lancet 1980, 316, 712–715. 55. Conlon, M.A.; Bird, A.R. The Impact of Diet and Lifestyle on Gut Microbiota and Human Health. Nutrients 2014, 7, 17–44. 56. Cockburn, D.W.; Koropatkin, N.M. Polysaccharide Degradation by the Intestinal Microbiota and Its Influence on Human Health
and Disease. J. Mol. Biol. 2016, 428, 3230–3252,.
57. Fava, F.; Gitau, R.; Griffin, B.A.; Gibson, G.R.; Tuohy, K.M.; Lovegrove, J.A. The Type and Quantity of Dietary Fat and Carbo-hydrate Alter Faecal Microbiome and Short-Chain Fatty Acid Excretion in a Metabolic Syndrome ‘at-Risk’ Population. Int J.
Obes. 2013, 37, 216–223.
58. Ferrario, C.; Statello, R.; Carnevali, L.; Mancabelli, L.; Milani, C.; Mangifesta, M.; Duranti, S.; Lugli, G.A.; Jimenez, B.; Lodge, S.; et al. How to Feed the Mammalian Gut Microbiota: Bacterial and Metabolic Modulation by Dietary Fibers. Front. Microbiol. 2017,
8.
59. Daly, K.; Proudman, C.J.; Duncan, S.H.; Flint, H.J.; Dyer, J.; Shirazi-Beechey, S.P. Alterations in Microbiota and Fermentation Products in Equine Large Intestine in Response to Dietary Variation and Intestinal Disease. Br. J. Nutr. 2012, 107, 989–995. 60. Britton, R.A.; Young, V.B. Interaction between the Intestinal Microbiota and Host in Clostridium Difficile Colonization
Re-sistance. Trends in Microbiol. 2012, 20, 313–319.
61. Meehan, C.J.; Beiko, R.G. A Phylogenomic View of Ecological Specialization in the Lachnospiraceae, a Family of Digestive Tract-Associated Bacteria. Genome Biol. Evol. 2014, 6, 703–713.
62. Mandal, M.; Olson, D.J.; Sharma, T.; Vadlamudi, R.K.; Kumar, R. Butyric Acid Induces Apoptosis by Up-Regulating Bax Ex-pression via Stimulation of the c-Jun N-Terminal Kinase/Activation Protein-1 Pathway in Human Colon Cancer Cells.
63. Nepelska, M.; Cultrone, A.; Béguet-Crespel, F.; Le Roux, K.; Doré, J.; Arulampalam, V.; Blottière, H.M. Butyrate Produced by Commensal Bacteria Potentiates Phorbol Esters Induced AP-1 Response in Human Intestinal Epithelial Cells. PLoS ONE 2012,
7, e52869.
64. Hess, J. AP-1 Subunits: Quarrel and Harmony among Siblings. J. Cell Sci. 2004, 117, 5965–5973.
65. Waters, J.L.; Ley, R.E. The Human Gut Bacteria Christensenellaceae Are Widespread, Heritable, and Associated with Health.
BMC Biol. 2019, 17, 83.
66. Alemán, J.O.; Bokulich, N.A.; Swann, J.R.; Walker, J.M.; De Rosa, J.C.; Battaglia, T.; Costabile, A.; Pechlivanis, A.; Liang, Y.; Breslow, J.L.; et al. Fecal Microbiota and Bile Acid Interactions with Systemic and Adipose Tissue Metabolism in Diet-Induced Weight Loss of Obese Postmenopausal Women. J. Transl. Med. 2018, 16, 244.
67. Goodrich, J.K.; Waters, J.L.; Poole, A.C.; Sutter, J.L.; Koren, O.; Blekhman, R.; Beaumont, M.; Van Treuren, W.; Knight, R.; Bell, J.T.; et al. Human Genetics Shape the Gut Microbiome. Cell 2014, 159, 789–799.
68. Dougal, K.; Harris, P.A.; Girdwood, S.E.; Creevey, C.J.; Curtis, G.C.; Barfoot, C.F.; Argo, C.M.; Newbold, C.J. Changes in the Total Fecal Bacterial Population in Individual Horses Maintained on a Restricted Diet Over 6 Weeks. Front. Microbiol. 2017, 8. 69. Biddle, A.S.; Tomb, J.-F.; Fan, Z. Microbiome and Blood Analyte Differences Point to Community and Metabolic Signatures in
Lean and Obese Horses. Front. Vet. Sci. 2018, 5.
70. Belzer, C.; Vos, W.M. de Microbes inside—from Diversity to Function: The Case of Akkermansia. ISME J. 2012, 6, 1449–1458. 71. Swidsinski, A.; Dorffel, Y.; Loening-Baucke, V.; Theissig, F.; Ruckert, J.C.; Ismail, M.; Rau, W.A.; Gaschler, D.; Weizenegger, M.;
Kuhn, S.; et al. Acute Appendicitis Is Characterised by Local Invasion with Fusobacterium Nucleatum/Necrophorum. Gut 2011,
60, 34–40.
72. Swidsinski, A.; Loening-Baucke, V.; Herber, A. Mucosal Flora in Crohn’s Disease and Ulcerative Colitis—an Overview. J.
Phys-iol. Pharmacol. 2009, 60 Suppl. 6, 61–71.
73. Zhang, H.; DiBaise, J.K.; Zuccolo, A.; Kudrna, D.; Braidotti, M.; Yu, Y.; Parameswaran, P.; Crowell, M.D.; Wing, R.; Rittmann, B.E. Human Gut Microbiota in Obesity and after Gastric Bypass. Proc. Natl. Acad. of Sci. 2009, 106, 2365–2370.
74. Png, C.W.; Lindén, S.K.; Gilshenan, K.S.; Zoetendal, E.G.; McSweeney, C.S.; Sly, L.I.; McGuckin, M.A.; Florin, T.H.J. Mucolytic Bacteria With Increased Prevalence in IBD Mucosa Augment In Vitro Utilization of Mucin by Other Bacteria: Am. J. Gastroenterol
2010, 105, 2420–2428.
75. Wang, L.; Christophersen, C.T.; Sorich, M.J.; Gerber, J.P.; Angley, M.T.; Conlon, M.A. Low Relative Abundances of the Muco-lytic Bacterium Akkermansia Muciniphila and Bifidobacterium Spp. in Feces of Children with Autism. Appl. Environ. Microbiol.
2011, 77, 6718–6721.
76. Sonoyama, K.; Fujiwara, R.; Takemura, N.; Ogasawara, T.; Watanabe, J.; Ito, H.; Morita, T. Response of Gut Microbiota to Fasting and Hibernation in Syrian Hamsters. AEM 2009, 75, 6451–6456.
77. Shin, N.-R.; Lee, J.-C.; Lee, H.-Y.; Kim, M.-S.; Whon, T.W.; Lee, M.-S.; Bae, J.-W. An Increase in the Akkermansia Spp. Population Induced by Metformin Treatment Improves Glucose Homeostasis in Diet-Induced Obese Mice. Gut 2014, 63, 727–735.
78. Votion, D.-M. The Story of Equine Atypical Myopathy: A Review from the Beginning to a Possible End. Int. Sch. Res. Not. 2012,
2012, 1–14.
79. Dai, Z.-L.; Li, X.-L.; Xi, P.-B.; Zhang, J.; Wu, G.; Zhu, W.-Y. Metabolism of Select Amino Acids in Bacteria from the Pig Small Intestine. Amino acids 2012, 42, 1597–1608.
80. Dougal, K.; Harris, P.A.; Edwards, A.; Pachebat, J.A.; Blackmore, T.M.; Worgan, H.J.; Newbold, C.J. A Comparison of the Mi-crobiome and the Metabolome of Different Regions of the Equine Hindgut. FEMS Microbiol. Ecol. 2012, 82, 642–652.
81. Arumugam, M.; Raes, J.; Pelletier, E.; Le Paslier, D.; Yamada, T.; Mende, D.R.; Fernandes, G.R.; Tap, J.; Bruls, T.; Batto, J.-M.; et al. Enterotypes of the Human Gut Microbiome. Nature 2011, 473, 174–180.