Detection of the inner debris disk of Vega with
CHARA/FLUOR
Olivier Absil
a, Emmanuel Di Folco
b, Antoine M´erand
c,f, Jean-Charles Augereau
d, Vincent
Coud´e du Foresto
c, Jason P. Aufdenberg
e, Pierre Kervella
c, Stephen T. Ridgway
e,
Theo A. ten Brummelaar
f, Harold A. McAlister
fa
Institut d’Astrophysique et de G´eophysique, 17 All´ee du Six Aoˆut, B-4000 Li`ege, Belgium;
bObservatoire de Gen`eve, 51 chemin des Maillettes, CH-1290 Sauverny, Switzerland;
cLESIA, Observatoire de Paris-Meudon, 5 place Jules Janssen, F-92195 Meudon, France;
dLaboratoire d’Astrophysique de l’Observatoire de Grenoble, BP 53, F-38041 Grenoble, France;
e
National Optical Astronomical Observatory, 950 North Cherry Avenue, Tucson, AZ 85719;
fCHARA, Georgia State University, PO Box 3969, Atlanta, GA 30302-3965
ABSTRACT
Using the FLUOR beam-combiner installed at the CHARA Array (Mt Wilson, CA), we have obtained high-precision visibility measurements of Vega, one of the prototypic debris-disk stars, known to be surrounded by a large amount of cold dust in a ring-like structure at 80–100 AU. The combination of short and long baselines has allowed us to separately resolve the stellar photosphere and the close environment of the star (< 8 AU). Our observations show a significant deficit in square visibility at short baselines with respect to the expected visibility of a simple UD stellar model (∆V2 ' 2%), suggesting the presence of an extended source of emission around
Vega. The sparse (u, v) plane coverage does not allow the discrimination between a point source and an extended circumstellar emission as the source of the extended emission. However, we show that the presence of a point-like source within the FLUOR field-of-view (100 in radius, i.e., 7.8 AU at the distance of Vega) is highly unlikely.
The excess emission is most likely due to the presence of hot circumstellar dust in the inner part of Vega’s debris disk, with a flux ratio of 1.29 ± 0.19% between the integrated dust emission and the stellar photosphere. Complementing this result with archival photometric data in the near- and mid-infrared and taking into account a realistic photospheric model for the rapidly rotating Vega, we derive the expected physical properties of the circumstellar dust by modelling its Spectral Energy Distribution. The inferred properties suggest that the Vega system could be currently undergoing major dynamical perturbations.
Keywords: Stars: individual: Vega, Circumstellar matter, Techniques: interferometric
1. INTRODUCTION
Vega (HD 172167, A0V, 7.76 pc) is probably one of the most important stars in astrophysics, as it has been used as a photometric standard for more than a century. With the advent of infrared space-based telescopes, it was discovered to have a large infrared excess beyond 12 µm with respect to its expected photospheric flux.1 This
excess was identified as the thermal emission from a circumstellar disk of cool dust located at about 85 AU from Vega. The same phenomenon was subsequently discovered around about 10% of nearby main sequence stars. Since then, great attention has been paid to Vega and other Vega-like stars. They have been imaged from the millimetric domain down to the visible, revealing circumstellar dust arranged in various shapes. For instance, Vega is known to be surrounded by a smooth annular structure similar to the solar Kuiper Belt, containing about 3 × 10⁻³M
⊕ of dust grains,2 which also shows some clumpy components.3
However, due to the limitation in angular resolution of current telescopes, very little is known about the innermost part of these debris disks, which could potentially harbour warm dust (≥ 300 K) heated by the star. Such warm dust would have a signature in the near- and mid-infrared that only photometric studies have
Further author information: (Send correspondence to O.A.) O.A.: E-mail: absil@astro.ulg.ac.be, Telephone: +32-4-366.97.66
attempted to detect until recently. However, Vega’s near-infrared (K, L, M ) flux was shown to be consistent with other A-type stars to within standard photometric precision of 2 − 5%.4 In the N band, the best constraint
on the thermal emission from warm dust has been obtained by nulling interferometry, with no resolved emission above 2.1% of the level of stellar photospheric emission at separations larger than 0.8 AU.5At longer wavelengths,
the recent measurements obtained with Spitzer in the far-infrared6 have not allowed for an investigation of the
inner part of Vega’s disk because of the limited resolution (47 AU at the distance of Vega) and because hot dust is not expected to contribute significantly to the far-infrared flux.
In this paper, we use infrared stellar interferometry to investigate the inner part of Vega’s debris disk. Such an attempt had already been made by Ciardi et al.,7who observed Vega with the PTI interferometer on a 110 m
long baseline in dispersed mode. The poor spatial frequency coverage of their observations did not allow clear conclusions, although a simple model of a star and a uniform dust disk with a 3 − 6% flux ratio was proposed to explain the observations. A more thorough study of Vega-type stars was performed with the VLTI by Di Folco et al.,8 using short and long baselines to separately resolve the two components of the system (stellar photosphere
at long baselines and circumstellar emission at short baselines). Unfortunately, the visibility precision and the available baselines at the VLTI only allowed upper limits to be inferred on the flux of the inner disks. In order to better constrain the near-infrared brightness of Vega’s disk, we have used the same method at the CHARA Array9with an optimised set of baselines.
2. OBSERVATIONS AND DATA REDUCTION
Interferometric observations were obtained in the infrared K band (1.94 − 2.34 µm) with FLUOR, the Fiber Linked Unit for Optical Recombination,10 using the S1–S2 and E2–W2 baselines of the CHARA Array, 34 and
156 metres respectively. Observations took place during Spring 2005, on May 21st and May 22nd for E2–W2, and between June 13th and June 15th for S1–S2 (see Figure 1, or Absil et al.11 for a full description of the data
set). The FLUOR field-of-view, limited by the use of single-mode fibers, has a Gaussian shape resulting from the overlap integral of the turbulent stellar image with the fundamental mode of the fiber. Under typical seeing conditions, it has a radius of 100(distance at which the coupling efficiency falls to 3% of its on-axis value).
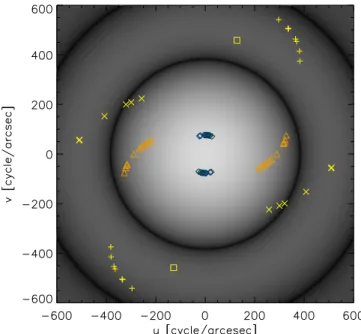
Figure 1. Sampling of the (u, v)-plane for our CHARA/FLUOR observations, overlaid on a model for Vega’s two-dimensional monochromatic Fourier appearance. The diamonds correspond to the S1–S2 baseline and the triangles to the E2–W2 baseline. The other symbols are associated to longer baselines, which have been used to derive the limb-darkening profile of Vega12and are not discussed here.
The FLUOR Data Reduction Software13 was used to extract the squared modulus of the coherence factor
between the two independent apertures. The interferometric transfer function of the instrument was estimated by observing calibrators before and after each Vega data point. All calibrator stars (Table 1) were chosen from a catalogue developed for this specific purpose.14 Calibrators chosen in this study are all K giants, whereas Vega
is an A0 dwarf. The spectral type difference is properly taken into account in the Data Reduction Software, even though it has no significant influence on the final result. The efficiency of CHARA/FLUOR was consistent between all calibrators and stable night after night to around 85%. Data that share a calibrator are affected by a common systematic error due to the uncertainty of the a priori angular diameter of this calibrator. In order to interpret our data properly, we used a specific formalism15 tailored to propagate these correlations into the
model fitting process. All diameters are derived from the visibility data points using a full model of the FLUOR instrument including the spectral bandwidth effects.
Table 1. Calibrators with spectral type, K magnitude, limb-darkened disk (LD) angular diameter in K band (in mil-liarcsec) and baseline.14
S. type K mag LD diam. (mas) Baseline HD 159501 K1 III 3.14 1.200 ± 0.014 E2–W2 HD 163770 K1 IIa 1.03 3.150 ± 0.034 S1–S2 HD 165683 K0 III 2.9 1.152 ± 0.014 E2–W2 HD 168775 K2 IIIab 1.74 2.280 ± 0.025 S1–S2 HD 173780 K2 III 2.0 1.950 ± 0.021 E2–W2 HD 176527 K2 III 2.04 1.765 ± 0.024 E2–W2 HD 176670 K2.5 III 1.6 2.410 ± 0.026 S1–S2
3. DATA ANALYSIS
3.1. Stellar diameter
The measurements obtained with the E2–W2 baseline are particularly appropriate for a precise diameter de-termination, because they provide good spatial frequency coverage of the end of the first lobe of the visibility curve (see Figure 1). We have fitted a uniform stellar disk model to our E2–W2 data, assuming that Vega’s photospheric intensity I(φ, λ) equals the Planck function with an effective temperature of 9550 K for all angles
φ (Figure 2). The best-fit diameter is θUD= 3.218 ± 0.005 mas for an effective wavelength of 2.118 µm, which
significantly revises the previous estimate (θUD= 3.24 ± 0.01 mas) obtained by Ciardi et al.7 in the same wave
band∗. The quality of the fit is quite good (χ2
r = 1.29). Unlike in the PTI data of Ciardi et al.,7 we do not
see any obvious trend in the residuals of the fit, except for three points at projected baselines between 140 and 150 m which are slightly above the fit (by ∼1.5σ). Figure 4 compares our observations with the previous measurements at PTI. It shows a significant discrepancy not only between the CHARA/FLUOR and the PTI data, but also between the 1999 and 2000 PTI data. Our observations do not support the scenario of Ciardi et al.,7 who proposed a uniform dust ring with a 3 − 6% integrated flux relative to the Vega photosphere in K band
to account for the trend that they observed in the residuals of the fit obtained with a simple limb-darkened disk (LD) stellar model.
Note that fitting an LD stellar model to our data would only marginally improve the fit (see Table 2), as the shape of the first-lobe visibility curve is not very sensitive to limb darkening. Moreover, the actual limb-darkening parameter may be significantly larger than standard tabulated values because Vega is a fast rotating star viewed nearly pole-on for which the equatorial darkening biases the limb profile.16 Complementary observations to our
data set, obtained by Aufdenberg et al.12 at ∼250 m baselines (see Figure 1), confirm this fact and lead to an
accurate estimation of the K-band limb profile, which mostly affects visibilities beyond the first null and will not be discussed here.
∗The K-band diameter proposed by Ciardi et al.7 was computed with the assumption of a flat spectrum for the Vega intensity. This explains a large part of the discrepancy with our new value.
Figure 2. Fit of a uniform stellar disk model to the E2–W2 data. The quality of the fit is satisfactory (reduced χ2 of 1.29), with small residuals that do not display any obvious trend except for a small underestimation of the actual data for baselines between 140 and 150 m.
3.2. Visibility deficit at short baselines
With this precise diameter estimation, we can now have a look at the short-baseline data. In fact, these points do not significantly contribute to the UD fit because of the low spatial frequencies they sample. Including all the data points in the fitting procedure gives a best-fit diameter θUD = 3.217 ± 0.013 mas, but with a poor
χ2
r = 3.36. We show the reason for this poor reduced χ2 in Figure 3, where the S1–S2 data points are plotted
as a function of the projected baseline’s orientation together with the best UD fit (solid line). The observations are consistently below the fit, with a ∆V2= 1.88 ± 0.34%.
Systematic errors in the estimation of the calibrator diameters or limb-darkened profiles are possible sources of bias in interferometric observations. In order to explain the measured visibility deficit in the S1–S2 data, the diameters of the three short-baseline calibrators (Table 1) should have been underestimated by 0.26, 0.35 and 0.33 mas respectively, which represent about 10 times the estimated error on their diameters. We have made sure that such improbable errors were not present in our calibration procedure by cross-calibrating the three calibrators. No significant departure from the expected LD diameters was measured, and the calibrated visibilities of Vega do not depend on the chosen calibrator. Therefore, it appears extremely unlikely that the calibration process may have induced the observed visibility deficit.
A limb-darkened stellar model for Vega will not reconcile the best-fit stellar model with the S1–S2 data points (see Table 2), because low spatial frequencies are not sensitive to limb darkening. One may think of stellar asymmetry as a possible reason for the visibility deficit at short baselines, since the position angles of the short and long baselines are almost perpendicular (see Figure 1). However, an oblateness ratio of 1.07 for Vega would be needed to explain the deficit, which would strongly contradict recent interferometric studies.12, 16
Other stellar features such as spots would not explain this deficit either as they can only appear in the second and higher lobes of the visibility function. In fact, a natural explanation to the observed visibility deficit would be the presence of an extended source of emission in the interferometric field-of-view (e.g. disk or companion), which would be resolved with the S1–S2 baseline (i.e., incoherent emission).
In order to assess the amount of incoherent emission needed to explain the observed visibility deficit, we have added a diffuse emission, uniformly distributed in the CHARA/FLUOR field-of-view, to our UD stellar model. Fitting this new model to the complete data set gives the following final result: θUD= 3.202 ± 0.005 mas,
Figure 3. The data obtained with the S1–S2 baseline (∼34 m) are displayed as a function of the projected baseline’s position angle together with the best UD fit computed over the whole data set (3.217 mas). The data points are significantly below the best UD fit, with a mean visibility deficit ∆V2' 2%. The addition of a uniform diffuse source of emission in the FLUOR field-of-view reconciles the best fit with the data (dotted line). Note that there is no obvious dependence of the data points with respect to position angle, which would be indicative of an asymmetric extended emission.
Figure 4. Comparison of our E2-W2 data (black dots) with the observations of Ciardi et al.7 obtained at PTI (triangles: data acquired in 1999, squares: data acquired in 2000). The data are displayed as a function of spatial frequency, taking an equivalent wavelength of 2.145 µm for the FLUOR instrument (computed for a flat stellar spectrum as in the study of Ciardi et al.7). The 1σ errors on the PTI data are shown at the bottom of the figure for the sake of clarity.
K-band flux ratio = 1.29±0.19%, with a significantly decreased χ2
r= 1.10 (instead of 3.36). This result is almost
independent of the extended source morphology, as the spatial frequency coverage of our interferometric data is too scarce to constrain its spatial distribution. The extended structure, detected with very good confidence (almost 7σ), would thus have a relative flux contribution of 1.29% with respect to the Vega photosphere in
K band when integrated over the whole field-of-view (7.8 AU in radius). Such an excess does not contradict
photometric measurements in the K band, which have typical accuracies of 2 − 3%. The result of the fit is displayed in Figure 3 (dotted line) and Figure 4 (solid line), as well as in Figure 5 for a realistic debris disk model (see Section 4.2), which gives the same best-fit parameters.
Table 2. Influence of the limb-darkening parameter α on the best-fit diameter and the associated reduced χ2 using the whole data set, assuming a brightness distribution I(µ) = µαwith µ = cos θ the cosine of the azimuth of a surface element of the star.17 The visibility deficit measured at short baselines (S1–S2) with respect to the best-fit model is given in the last column, showing a weak dependence on the limb-darkening model.
Best-fit χ2
r ∆V2
α θLD (mas) (all data) (S1–S2)
0.0 3.217 ± 0.013 3.36 1.88% 0.1 3.264 ± 0.013 3.14 1.83% 0.2 3.310 ± 0.012 2.96 1.78% 0.3 3.356 ± 0.012 2.82 1.73% 0.4 3.402 ± 0.011 2.71 1.67% 0.5 3.447 ± 0.011 2.64 1.62% 0.6 3.491 ± 0.011 2.61 1.58% 0.7 3.536 ± 0.012 2.60 1.53% 0.8 3.579 ± 0.012 2.62 1.49% 0.9 3.623 ± 0.012 2.66 1.44%
4. DISCUSSION
In this section, we discuss the possible sources of incoherent flux around Vega that could account for the visibility deficit observed at short baselines.
4.1. Point source
Regardless of the bound or unbound character of the companion, there are essentially two regimes to be considered when computing the visibility of a binary system, depending on whether the fringe packet associated with the companion falls into the FLUOR observation window or not. The observation window is defined as the total optical path LOPD scanned by the FLUOR dither mirror, which is used to temporally record the fringes. The
secondary fringe packet lies outside the observation window if |B α cos θ| > LOPD/2, where B is the baseline
length, α the angular separation of the binary system, θ the angle between the baseline and the orientation of the binary system, and LOPD = 102 µm. In that case, e.g. for an angular separation larger than 350 mas at a
baseline of 34 m, the flux from the secondary will contribute incoherently and will lead to the same signature as a diffuse emission in the FLUOR field-of-view. A binary star with a separation ranging between 350 and 1000 mas could therefore reproduce the observed visibilities. On the other hand, if the secondary fringe packet is inside the observation window, it will lead either to a visibility modulation of twice the flux ratio as a function of baseline azimuth if the fringe packets are superposed, or to an enhancement of the measured visibility if the fringe packets are separated. Even if such behaviour does not seem compatible with the observed visibilities, our sparse (u, v) plane coverage cannot definitely rule out a solution with a close companion.
The presence of a point source located within the FLUOR field-of-view could thus possibly explain our observations. The minimum K-band flux ratio between the point source and Vega is 1.29 ± 0.19%, valid for a very close companion (≤ 50 mas). Because of the Gaussian shape of the off-axis transmission, the companion
would have a larger flux if located farther away from the star. For instance, the flux should be increased by 10% at 100 mas, by 50% at 200 mas and by 3000% at 500 mas from the star in order to reproduce the observed visibility deficit. Based on a minimum K-band flux ratio of 1.29 ± 0.19% and a K magnitude of 0.02 for Vega, we deduce an upper limit of K = 4.74 ± 0.17 for a companion.
4.1.1. Field star
Although Vega is known to be surrounded by a number of faint objects (V > 9) with low proper motion since the beginning of the 20th century, these objects are far enough from Vega (at least 10) so that they do not interfere
with our measurements. In the infrared, neither adaptive optics studies18, 19 nor the 2MASS survey identified
any K < 5 object within 10of Vega. In fact, the local density of such objects is about 5 × 10⁻⁴per square arcmin
according to the 2MASS survey, so that the probability to find a K < 5 source within 100of Vega is smaller than
4.3 × 10⁻⁷.
4.1.2. Physical companion
At the distance of Vega, the putative companion would have a maximum absolute magnitude MK= 5.15 ± 0.17.
Assuming this companion to be a star of the same age as Vega itself, comprised between 267 and 383 Myr,20we
deduce the range of effective temperature and mass for the companion using the evolutionary models of Baraffe et al.:21 T
eff = 3890 ± 70 K and M = 0.60 ± 0.025 M¯. This roughly corresponds to an M0V star. Due
to the high contrast and small angular separation with Vega, this companion would have remained undetected in adaptive optics images or high resolution visible spectra of Vega. Indirect methods are in fact much more appropriate to detect this kind of companion.
Astrometric measurements of Vega with Hipparcos did not detect the presence of any companion, with an astrometric precision of 0.5 mas. With a mass ratio of 4.2 between Vega (2.5M¯) and its putative M0V
companion (0.6M¯), a 3σ astrometric stability of 1.5 mas implies that the orbital semi-major axis of the
putative companion cannot be larger than 6.3 mas† (= 0.05 AU = 4R
?) with a 99% confidence assuming a
circular orbit, which is anticipated for such a small separation. Such a close companion, which could also fit the interferometric data, would have an appreciable signature in radial velocity measurements, unless the binary system is seen almost exactly pole-on. Precise measurements recently obtained with the ELODIE spectrometer have shown a relative stability of Vega’s radial velocity over several months, with amplitudes lower than 100 m/s and a precision of order of 30 m/s each (F. Galland, private communication). Assuming that the orbital plane of the M0V companion is perpendicular to Vega’s rotation axis, inclined by 5.3◦ with respect to the line-of-sight,12
the companion should be farther than 80 AU from Vega to be compatible with the measured radial velocity stability. In fact, for an M0V companion at 0.05 AU from Vega not to display any radial velocity signature at the 100 m/s level, its orbital inclination needs to coincide with the plane of the sky to within ±0.13◦. Even if such
an inclination is possible, the probability for the system to be so close to pole-on is very low (it ranges between about 6 × 10⁻⁴ and 10−6 depending on the assumptions on the statistical distribution of low-mass companion
orbital planes). In conclusion, even though the presence of an M0V companion close to Vega could explain the interferometric data, there is strong evidence that such a companion does not exist.
4.2. Circumstellar material
Circumstellar disks around MS stars are understood to be composed of second-generation dust grains originating from collisions between small bodies (asteroids) or from the evaporation of comets. They are assumed to be continuously replenished since dust grains have a limited lifetime (< 10 Myr) due to radiation pressure, Poynting-Robertson (P-R) drag and collisional destruction. Several studies have shown Vega to harbour a cold circumstellar dust ring ∼85 AU in radius.2, 3 Su et al.6 interpret the extended dust emission (up to 600 AU, i.e., 7700) recently
detected with the Spitzer Space Telescope as the signature of dust grains being expelled by radiation pressure from the Vega system as a result of a recent collision in the main planetesimal ring and subsequent collisional cascade. Even if the presence of dust in the inner part of the disk has not been detected yet due to instrumental limitations, an equivalent to the solar zodiacal cloud is expected to be found around Vega. The thermal and
†The astrometric signature of a low-mass companion is given by the ratio between the orbital semi-major axis and the mass ratio.
scattered emissions from warm grains surrounding Vega could thus be a natural explanation to the visibility deficit observed at short baselines, provided that a sufficient quantity of dust is present within 8 AU from the star.
4.2.1. Physical properties of the dust grains
Based on our estimation of the K-band contrast between the star and the disk (1.29 ± 0.19%), let us try to evaluate the main physical properties of the dust grains in the inner debris disk. Table 3 gives the photometric constraints on the near- and mid-infrared excess flux around Vega currently available in the literature. Photo-metric constraints at wavelengths longer than 12 µm are not appropriate for our purpose as they are mostly sensitive to the cold outer disk (the inner disk is not supposed to produce a significant photometric contribution in the far-infrared). The large error bars on the photometric measurements take into account both the actual error on photometric measurements and the estimated accuracy of photospheric models for Vega, to which the measurements are compared. Our study is compatible with previous near-infrared measurements but provides a much stronger constraint on the inner disk, because interferometry spatially resolves the disk from the stellar photosphere and focuses on the inner part of the disk thanks to the small field-of-view. Nulling interferometry at the MMT with the BLINC instrument also provides a valuable constraint on the mid-infrared excess.5 The
sinusoidal transmission map of this nulling interferometer restricts however the observation to the part of the disk located farther than about 125 mas (∼ 1 AU) from the star. This explains why the result of this study is significantly below the estimated mid-infrared photometric excesses, as it is not sensitive to hot grains in the innermost part of the disk.
Table 3. Available constraints on the near- and mid-infrared excess around Vega. The photometric data have been compared to the most recent Kurucz photospheric model of Vega,22which has a typical uncertainty of 2% in the infrared (this uncertainty has been added to the estimated errors on the measurements). Note that the interferometric data from FLUOR and BLINC only sample a specific part of the inner disk, while the photometric studies include Vega’s entire environment.
Wavelength Excess Instruments 1.26 µm 2.4 ± 2.9% Catalina,23 UKIRT24 1.60 µm −2.4 ± 3.6% Catalina23 2.12 µm 1.29 ± 0.19% CHARA/FLUOR 2.20 µm 4.1 ± 3.0% Catalina,23 UKIRT24 3.54 µm 3.1 ± 3.0% Catalina,23 UKIRT24 4.80 µm 7.1 ± 5.1% Catalina,23 UKIRT24 10 µm 6 ± 4.5% Various25 10.6 µm 0.2 ± 0.7% MMT/BLINC5 12 µm 1.2 ± 5% IRAS1, 26
We have tried to reproduce the Spectral Energy Distribution (SED) of the infrared excess as listed in Table 3 with the debris disk model developed by Augereau et al.27 For that purpose, we have taken for Vega the
photospheric model proposed by Aufdenberg et al.12 and we have assumed that the plane of the circumstellar
disk coincides with the equatorial plane of Vega. Because the photospheric temperature is about 2250 K lower at the equator than at the pole in this model, the total luminosity of Vega as seen from the equatorial plane (28L¯) is about twice smaller than the pole-on luminosity seen by an Earth-based observer (57L¯). Various
grain compositions and size distributions were used in the disk model, as well as various radial density profiles, assuming no azimuthal dependence. For each model, a χ2 map is computed for all possible values of a
min
(minimum grain size) and r0(inner radius where the disk is artificially truncated), adjusting the surface density
at r0 by a least-squares method. The most constraining observations in this process are the two interferometric
measurements at 2.12 and 10.6 µm, so that the fitting procedure mainly boils down to adjusting the near-infrared flux without producing a too strong 10.6 µm emission feature. Comparison of χ2values allowed us to infer most
• Size distribution: The inner disk seems to be mainly composed of hot (∼1500 K) and small (< 1 µm)
dust grains, which emit mostly in the near-infrared. Although larger grains (≥ 10 µm) cannot be ruled out as the main source of the excess, such grains generally produce too large a mid-infrared flux as they emit more efficiently in this wavelength range. This suggests a steep size distribution with a small minimum grain size (amin≤ 0.5 µm, assuming compact grains). For instance, we find that a size distribution similar
to that of cometary grains provides a good fit to the SED, as well as the interstellar size distribution.28
Both have power-law exponents of −3.5 or steeper. On the contrary, the size distribution of interplanetary dust particles does not provide a good reproduction of the disk’s SED, so that the grain size distribution is most probably different from that of the solar zodiacal disk.28
• Composition: Large amounts of highly refractive grains, such as graphites or amorphous carbons, are
most probably present in the inner disk. This is required in order to explain the lack of significant silicate emission features around 10 µm,29which are especially prominent for small grains. Silicate grains can still
be present in the disk, but with a maximum volume ratio of ∼70%. This is another difference from the solar zodiacal cloud, which is thought to contain about 90% of silicate grains.28 Such a mixing ratio would
only be possible around Vega if the grains were sufficiently big (amin≥ 10 µm), so that the silicate emission
feature around 10 µm would not be too prominent.
• Density profile: The inner radius r0 of the dusty disk is estimated to be between 0.12 and 0.2 AU.
Assuming a sublimation temperature of 1700 K, dust grains larger than 0.5 µm would survive at such distances while smaller grains, which are hotter, sublimate farther from the star (e.g. at ∼0.4 AU for a 0.1 µm grain). A steep power-law for the radial surface density distribution has also been inferred from our investigations. A power-law exponent of −4 or steeper provides a good fit to the SED, as it reduces the amount of dust in the regions farther than 1 AU and thereby explains the non-detection with MMT/BLINC reported by Liu et al.5 In contrast, the solar zodiacal disk has a flat surface density power-law with an
exponent around −0.34.
Using these most probable parameters for the inner disk and a mixed composition of 50% amorphous carbons30
and 50% glassy olivines (MgFeSiO4),31we have obtained a relatively good fit to the SED as illustrated in Figure 5,
where we see that the thermal emission from the hot grains supersedes the contribution from scattered light at wavelengths longer than 1.3 µm. Based on our model and assuming a size distribution dn(a) ∝ a−3.7da with
amin= 0.1 µm and amax= 1500 µm, we can deduce estimations for the dust mass in the inner 10 AU of the disk
(Mdust ∼ 6 × 10⁻⁸M⊕, equivalent to the mass of an asteroid about 60 km in diameter) and for the apparent
bolometric luminosity ratio between the inner disk and the star (Ldisk/L? ∼ 5 × 10⁻⁴). Because of the high
temperature of the grains, the luminosity of the inner disk is more than one order of magnitude larger than the luminosity of the outer disk, even though it is almost 105times less massive than the outer disk.
4.2.2. A possible scenario for the presence of hot dust
Three main scenarios may explain the presence of small dust grains so close to Vega. As in the case of the solar zodiacal cloud, they could be produced locally, e.g. by collisions between larger bodies arranged in a structure similar to the solar asteroidal belt. Another local source of small grains is the evaporation of comets originating from the reservoir of small bodies at ∼85 AU from Vega or from an inner population of icy bodies as in the case of β Pic.32 Finally, dust grains produced by collisions in the outer disk could drift towards the inner region
because of P-R drag. However, this latter scenario cannot be connected to the recent collision(s) in the outer disk suggested by Su et al.,6 because of the long timescale of P-R drag (2 × 10⁷ yr).33 Moreover, due to the
much shorter collisional timescale (5 × 10⁵ yr in the outer disk), this process is not very efficient and is therefore
unlikely to produce the observed amount of dust in Vega’s inner system. Our observations cannot discriminate between the two remaining scenarios, even though a cometary origin is favoured by the steep size distribution of dust grains28 and by the small inner disk radius.
Due to radiation pressure, small grains will not survive in the Vega inner disk more than a few years before being ejected toward cooler regions. Larger grains would survive somewhat longer, but not more than a few tens of years due to the high collision rate in the inner disk. A large dust production rate (∼ 10−8M
⊕/yr) is thus
Figure 5. Our debris disk model fits both the interferometric data obtained with CHARA/FLUOR (left) and the various constraints on the SED from archival photometric and interferometric data listed in Table 3 (right). The model used here27 has a size distribution dn(a) ∝ a−3.7da with limiting grain sizes a
min = 0.1 µm and amax = 1500 µm, a surface density power-law Σ(r) ∝ r−4with an inner radius r
0= 0.12 AU, and assumes a disk composed of 50% amorphous carbon and 50% glassy olivine (see text). The solid and dotted lines in the right-hand side plot represent the total emission from the disk on a 8 AU field-of-view, respectively without and with the spatial filtering of interferometric studies, while the dashed line takes only the thermal emission into account. The pole-on and equatorial photospheric SEDs, taken from Aufdenberg et al.,12 are represented as a dashed-dotted lines for comparison (the upper curve is the pole-on SED). The pole-on luminosity, which is twice larger than the equatorial luminosity, has been used to compute the apparent luminosity ratio between the disk and the star (Ldisk/L?). The actual luminosity ratio, which represents the capacity of the debris disk to reprocess the stellar light, is in fact a factor two larger as it should be computed with the equatorial luminosity (seen by the disk).
Vega system. An attractive scenario would be an equivalent to the Late Heavy Bombardment that happened in the solar system in the 700 Myr following the formation of the planets,34 i.e., at a period compatible with
the age of Vega (∼350 Myr). Such a bombardment, most probably triggered by the outward migration of giant planets,35 could explain the presence of small grains around Vega both in its outer disk, due to an enhanced
collision rate in this part of the disk, and in its inner disk, due to the high number of comets sent toward the star by gravitational interaction with the migrating planets. Although the presence of giant planets around Vega has not been confirmed yet, Wyatt36 has suggested that the outward migration of a Neptune-sized body from
40 to 65 AU could explain the observed clumpy structure in Vega’s outer disk. Note that the estimated dust production rate roughly corresponds to the ongoing evaporation of 10 comets similar to Hale-Bopp in the Vega inner disk. This figure seems to be compatible with the estimated bombardment rate both in the early solar system34 and currently ongoing around β Pic.32
5. CONCLUSION
In this paper, we have presented high precision visibility measurements of Vega obtained at the CHARA Array with the FLUOR beam-combiner. The presence of a significant deficit of visibility at short baselines with respect to a simple uniform disk stellar model led us to the conclusion that an additional source of K-band emission is present in the FLUOR field-of-view centred around Vega (100in radius), with an estimated excess of 1.29 ± 0.19%
relative to the photospheric emission. Among the possible sources for this excess emission, the presence of dust grains in the close vicinity of Vega, heated by the star and radiating mostly in the near-infrared, is proposed as the most probable one. Vega, a prototypical debris-disk star surrounded by a large quantity of dust at about 85 AU, was already suspected by several authors to harbour warm dust grains arranged in an inner circumstellar disk. Previous studies were however limited to a precision of a few percent on the total infrared flux of the Vega system and therefore did not provide a precise estimation of the excess emission associated with the inner disk.
Thanks to our precise determination of the integrated K-band emission emanating from the inner 8 AU of the Vega debris disk, we were able to infer some physical properties of the dust, which is suspected to be mainly composed of sub-micronic highly refractive grains mainly concentrated in the first AU around Vega and heated up to 1700 K. An estimated dust mass of 6 × 10⁻⁸M
⊕ and an apparent fractional luminosity of ∼ 5 × 10⁻⁴ are
derived from our best-fit model. We propose that a major dynamical event, similar to the solar system Late Heavy Bombardment, might be the cause for the presence of small dust grains in the inner disk of Vega.
ACKNOWLEDGMENTS
We thank P.J. Goldfinger and G. Romano for their assistance with the operation of CHARA and FLUOR respectively. The CHARA Array is operated by the Center for High Angular Resolution Astronomy with support from Georgia State University and the National Science Foundation, the W.M. Keck Foundation and the David and Lucile Packard Foundation. This research has made use of NASA’s Astrophysics Data System and of the SIMBAD database, operated at CDS (Strasbourg, France).
REFERENCES
1. H. Aumann, C. Beichman, F. Gillett, T. de Jong, J. Houck, F. Low, G. Neugebauer, R. Walker, and P. Wesselius, “Discovery of a shell around Alpha Lyrae,” ApJ 278, pp. L23–L27, 1984.
2. W. S. Holland, J. S. Greaves, B. Zuckerman, R. A. Webb, C. McCarthy, I. M. Coulson, D. M. Walther, W. R. F. Dent, W. K. Gear, and I. Robson, “Submillimetre images of dusty debris around nearby stars.,”
Nature 392, pp. 788–790, 1998.
3. D. J. Wilner, M. J. Holman, M. J. Kuchner, and P. T. P. Ho, “Structure in the Dusty Debris around Vega,”
ApJ 569, pp. L115–L119, 2002.
4. S. K. Leggett, M. Bartholomew, C. M. Mountain, and M. J. Selby, “Narrowband 1-5-MICRON Photometry of A-Type Stars,” MNRAS 223, pp. 443–+, 1986.
5. W. M. Liu, P. M. Hinz, W. F. Hoffmann, G. Brusa, F. Wildi, D. Miller, M. Lloyd-Hart, M. A. Kenworthy, P. C. McGuire, and J. R. P. Angel, “Adaptive Optics Nulling Interferometric Constraints on the Mid-Infrared Exozodiacal Dust Emission around Vega,” ApJ 610, pp. L125–L128, 2004.
6. K. Y. L. Su, G. H. Rieke, K. A. Misselt, J. A. Stansberry, A. Moro-Martin, K. R. Stapelfeldt, M. W. Werner, D. E. Trilling, G. J. Bendo, K. D. Gordon, D. C. Hines, M. C. Wyatt, W. S. Holland, M. Marengo, S. T. Megeath, and G. G. Fazio, “The Vega Debris Disk: A Surprise from Spitzer,” ApJ 628, pp. 487–500, 2005. 7. D. Ciardi, G. van Belle, R. Akeson, R. Thompson, and E. Lada, “On the near-infrared size of Vega,”
ApJ 559, pp. 1147–1154, 2001.
8. E. Di Folco, F. Th´evenin, P. Kervella, A. Domiciano de Souza, V. Coud´e du Foresto, D. S´egransan, and P. Morel, “VLTI near-IR interferometric observations of Vega-like stars,” A&A 426, pp. 601–617, 2004. 9. T. A. ten Brummelaar, H. A. McAlister, S. T. Ridgway, W. G. Bagnuolo, N. H. Turner, L. Sturmann,
J. Sturmann, D. H. Berger, C. E. Ogden, R. Cadman, W. I. Hartkopf, C. H. Hopper, and M. A. Shure, “First Results from the CHARA Array. II. A Description of the Instrument,” ApJ 628, pp. 453–465, 2005. 10. V. Coud´e du Foresto, P. J. Bord´e, A. M´erand, C. Baudouin, A. Remond, G. S. Perrin, S. T. Ridgway, T. A. ten Brummelaar, and H. A. McAlister, “FLUOR fibered beam combiner at the CHARA array,” in
Interferometry in Optical Astronomy II, W. Traub, ed., Proc. SPIE 4838, pp. 280–285, 2003.
11. O. Absil, E. Di Folco, A. M´erand, J.-C. Augereau, V. Coud´e du Foresto, J. A. Aufdenberg, P. Kervella, S. T. Ridgway, D. H. Berger, T. A. ten Brummelaar, J. Sturmann, L. Sturmann, N. H. Turner, and H. A. McAlister, “Circumstellar material in the Vega inner system revealed by CHARA/FLUOR,” A&A , 2006. In press.
12. J. A. Aufdenberg, A. M´erand, V. Coud´e du Foresto, O. Absil, E. di Folco, P. Kervella, S. T. Ridgway, D. H. Berger, T. A. ten Brummelaar, H. A. McAlister, J. Sturmann, L. Sturmann, and N. H. Turner, “First Results from the CHARA Array VII: Limb-Darkening Observations of Vega Consistent with a Pole-on, Rapidly Rotating Star,” ApJ , 2006. In press.
13. P. Kervella, D. S´egransan, and V. Coud´e du Foresto, “Data reduction methods for single-mode optical interferometry. Application to the VLTI two-telescopes beam combiner VINCI,” A&A 425, pp. 1161–1174, 2004.
14. A. M´erand, P. Bord´e, and V. Coud´e du Foresto, “A catalog of bright calibrator stars for 200-m baseline near-infrared stellar interferometry,” A&A 433, pp. 1155–1162, 2005.
15. G. Perrin, “The calibration of interferometric visibilities obtained with single-mode optical interferometers. Computation of error bars and correlations,” A&A 400, pp. 1173–1181, 2003.
16. D. M. Peterson, C. A. Hummel, T. A. Pauls, J. T. Armstrong, J. A. Benson, G. C. Gilbreath, R. B. Hindsley, D. J. Hutter, K. J. Johnston, D. Mozurkewich, and H. R. Schmitt, “Vega is a rapidly rotating star,” Nature 440, pp. 896–899, 2006.
17. D. Hestroffer, “Centre to limb darkening of stars. new model and application to stellar interferometry.,”
A&A 327, pp. 199–206, 1997.
18. B. A. Macintosh, E. E. Becklin, D. Kaisler, Q. Konopacky, and B. Zuckerman, “Deep Keck Adaptive Optics Searches for Extrasolar Planets in the Dust of ² Eridani and Vega,” ApJ 594, pp. 538–544, 2003.
19. S. A. Metchev, L. A. Hillenbrand, and R. J. White, “Adaptive Optics Observations of Vega: Eight Detected Sources and Upper Limits to Planetary-Mass Companions,” ApJ 582, pp. 1102–1108, 2003.
20. I. Song, J.-P. Caillault, D. Barrado y Navascu´es, and J. R. Stauffer, “Ages of A-Type Vega-like Stars from uvbyβ Photometry,” ApJ 546, pp. 352–357, 2001.
21. I. Baraffe, G. Chabrier, F. Allard, and P. H. Hauschildt, “Evolutionary models for solar metallicity low-mass stars: mass-magnitude relationships and color-magnitude diagrams,” A&A 337, pp. 403–412, 1998. 22. R. C. Bohlin and R. L. Gilliland, “Hubble Space Telescope Absolute Spectrophotometry of Vega from the
Far-Ultraviolet to the Infrared,” AJ 127, pp. 3508–3515, 2004.
23. H. Campins, G. H. Rieke, and M. J. Lebofsky, “Absolute calibration of photometry at 1 through 5 microns,”
AJ 90, pp. 896–899, 1985.
24. D. E. Blackwell, S. K. Leggett, A. D. Petford, C. M. Mountain, and M. J. Selby, “Absolute calibration of the infrared flux from VEGA at 1.24, 2.20, 3.76 and 4.6 microns by comparison with a standard furnace,”
MNRAS 205, pp. 897–905, 1983.
25. G. H. Rieke, M. J. Lebofsky, and F. J. Low, “An absolute photometric system at 10 and 20 microns,” AJ 90, pp. 900–906, 1985.
26. M. Cohen, R. G. Walker, M. J. Barlow, and J. R. Deacon, “Spectral irradiance calibration in the infrared. I - Ground-based and IRAS broadband calibrations,” AJ 104, pp. 1650–1657, 1992.
27. J.-C. Augereau, A. M. Lagrange, D. Mouillet, J. C. B. Papaloizou, and P. A. Grorod, “On the HR 4796 A circumstellar disk,” A&A 348, pp. 557–569, 1999.
28. W. T. Reach, P. Morris, F. Boulanger, and K. Okumura, “The mid-infrared spectrum of the zodiacal and exozodiacal light,” Icarus 164, pp. 384–403, 2003.
29. E. Gaidos and C. Koresko, “A survey of 10-µm silicate emission from dust around young sun-like stars,”
New Astronomy 9, pp. 33–42, 2004.
30. V. G. Zubko, V. Mennella, L. Colangeli, and E. Bussoletti, “Optical constants of cosmic carbon ana-logue grains - I. Simulation of clustering by a modified continuous distribution of ellipsoids,” MNRAS 282, pp. 1321–1329, 1996.
31. J. Dorschner, B. Begemann, T. Henning, C. Jaeger, and H. Mutschke, “Steps toward interstellar silicate mineralogy. II. Study of Mg-Fe-silicate glasses of variable composition.,” A&A 300, pp. 503–520, 1995. 32. H. Beust and A. Morbidelli, “Falling Evaporating Bodies as a Clue to Outline the Structure of the β Pictoris
Young Planetary System,” Icarus 143, pp. 170–188, Jan. 2000.
33. W. R. F. Dent, H. J. Walker, W. S. Holland, and J. S. Greaves, “Models of the dust structures around Vega-excess stars,” MNRAS 314, pp. 702–712, 2000.
34. W. K. Hartmann, G. Ryder, L. Dones, and D. Grinspoon, “The Time-Dependent Intense Bombardment of the Primordial Earth/Moon System,” in Origin of the Earth and Moon, R. M. Canup and K. Righter, eds., pp. 493–512, Tucson, Univ. of Arizona Press., 2000.
35. R. Gomes, H. F. Levison, K. Tsiganis, and A. Morbidelli, “Origin of the cataclysmic Late Heavy Bombard-ment period of the terrestrial planets,” Nature 435, pp. 466–469, 2005.
36. M. C. Wyatt, “Resonant Trapping of Planetesimals by Planet Migration: Debris Disk Clumps and Vega’s Similarity to the Solar System,” ApJ 598, pp. 1321–1340, 2003.