pyActigraphy: open-source python package for
actigraphy data visualisation and analysis
Gr´egory Hammada,∗, Mathilde Reyta,b, Nikita Beliya, Marion Bailleta,
Michele Deantonia, Alexia Lesoinnea, Vincenzo Mutoa, Christina Schmidta,b aGIGA-CRC In vivo Imaging, University of Li`ege, Li`ege, Belgium
bPsychology and Neurosciences of Cognition, Faculty of Psychology, University of Li`ege, Li`ege, Belgium
Abstract
Over the past 40 years, actigraphy has been used to study rest-activity
patterns in circadian rhythm and sleep research. Furthermore,
consider-ing its simplicity of use, there is a growconsider-ing interest in the analysis of large population-based samples, using actigraphy. Here, we introduce pyActigra-phy , a comprehensive toolbox for data visualization and analysis includ-ing multiple sleep detection algorithms and rest-activity rhythm variables. This open-source python package implements methods to read multiple data formats, quantify various properties of rest-activity rhythms, visualize sleep agendas, automatically detect rest periods and perform more advanced signal processing analyses. The development of this package aims to pave the way towards the establishment of a comprehensive open-source software suite, supported by a community of both developers and researchers, that would provide all the necessary tools for in-depth and large scale actigraphy data analyses.
Keywords: actigraphy, sleep, circadian rhythm, rest, activity, open-source, python
∗Corresponding author.
Email addresses: [email protected] (Gr´egory Hammad),
[email protected] (Mathilde Reyt), [email protected] (Nikita Beliy), [email protected] (Marion Baillet), [email protected] (Michele Deantoni), [email protected] (Alexia Lesoinne), [email protected] (Vincenzo Muto), [email protected] (Christina Schmidt)
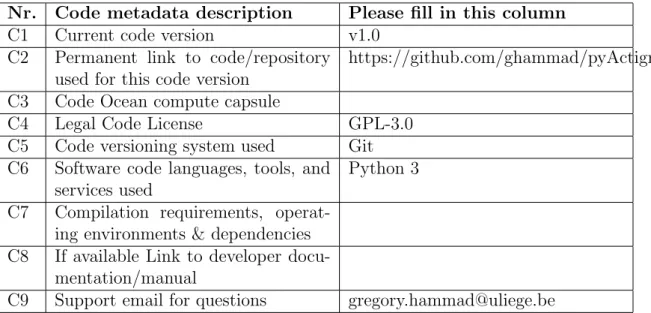
Required Metadata Current code version
Nr. Code metadata description Please fill in this column
C1 Current code version v1.0
C2 Permanent link to code/repository
used for this code version
https://github.com/ghammad/pyActigraphy
C3 Code Ocean compute capsule
C4 Legal Code License GPL-3.0
C5 Code versioning system used Git
C6 Software code languages, tools, and
services used
Python 3
C7 Compilation requirements,
operat-ing environments & dependencies
C8 If available Link to developer
docu-mentation/manual
C9 Support email for questions [email protected]
Table 1: Code metadata (mandatory)
1. Motivation and significance
1
Actigraphy consists in continuous movement recordings, using small
watch-2
like accelerometers that are usually worn on the wrist or on the chest. As
3
recordings can last several days or weeks, this technique is an adequate tool
4
for in-situ assessments of the locomotor activity and the study of rhythmic
5
rest-activity patterns. Consequently, it has been used in the field of sleep
6
and circadian rhythm research [1] to assess night-to-night variability in
esti-7
mated sleep parameters as well as rest-activity rhythm integrity. For
exam-8
ple, intradaily variability has been associated with both cognitive and brain
9
ageing [2, 3], while sleep fragmentation, as quantified by probability
tran-10
sitions from rest to activity during night-time, has been linked to cognitive
11
performances [4] as well as to increased risks for Alzheimer’s disease [5].
12
However, the generalization of the findings made by this technic remains
13
difficult; researchers either develop specific, often closed-source, data
process-14
ing pipeline and/or analysis scripts, which are time-consuming, error prone
15
and make the reproducibility of the analyses difficult, or they rely on
com-16
mercial toolboxes that are not only costly but also act as black boxes. In
17
addition, cumbersome manual data preprocessing, such as cleaning,
ham-18
pers large scale analyses, which are mandatory for reliable and generalizable
19
results.
In 2012, the UK Biobank decided to add 7-day actimetry-derived
phys-21
ical activity data collection. However, only a reduced set of sleep estimates
22
has been extracted yet from this dataset to identify different rest-activity
23
phenotypes and link them to pathology of genetic background (e.g. [6, 7]).
24
We thus argue that there is a need for a comprehensive and open-source
25
toolbox for actigraphy data analysis. This motivated the development of the
26
pyActigraphy package.
27
2. Software description and documentation
28
The pyActigraphy package is written in Python 3 (Python Software
Foun-29
dation, https://www.python.org/) and is available from the Python Package
30
Index (PyPI) repository. Its source code is hosted by Github and the
Zen-31
odo platform [8]. The online documentation of the pyActigraphy package
32
contains a detailed description of the attributes and methods of its various
33
modules and is meant to be used as complementary material of the current
34
paper. In addition, more than a dozen of tutorials are made available online
35
(https://ghammad.github.io/pyActigraphy/tutorials.html) to illustrate how
36
to use the multiple features of the package, described in this paper. These
37
tutorials are based on example data files that are provided with the package
38
itself.
39
2.1. Reading native actigraphy files
40
The pyActigraphy package provides a unified way to read several
actigra-41
phy file formats. Currently, it supports files from:
42
• wGT3X-BT, Actigraph (.agd file format only);
43
• Actiwatch 4 and MotionWatch 8, CamNtech;
44
• ActTrust 2, Condor Instruments;
45
• Daqtometer, Daqtix;
46
• Actiwatch 2 and Actiwatch Spectrum Plus, Philips Respironics.
47
For each file format, a dedicated class has been implemented to extract the
48
corresponding actigraphy data, as well as the associated meta-data. These
49
classes inherit from a base class implementing the various functionalities of
50
the pyActigraphy package. In addition, the package allows users to read
51
actigraphy recordings, either individually, for visual inspection for example,
52
or by batch, for analysis purposes.
2.2. Masking and cleaning data
54
Before analysing the data, spurious periods of inactivity, where the
acti-55
graph was most likely removed by the participant, need to be discarded from
56
the activity recordings. The pyActigraphy package implements a method to
57
automatically mask continuous periods of total inactivity. User-defined
pe-58
riods of masking can also be specified, either manually or in a specific file.
59
In addition to temporary actigraph removals, another usual source of
artifi-60
cial inactivities arises when the recordings start before and/or end after the
61
actigraph is actually worn by the participant. Upon reading an actigraphy
62
file, the pyActigraphy package allows users to discard such inactivity
peri-63
ods by specifying a start and a stop timestamp. The data collected outside
64
this time range are not analysed. These timestamps can also be specified
65
by batch by using a simple log file where each line should correspond to the
66
participant’s identification. This file is then processed to automatically apply
67
such boundaries to the corresponding actigraphy file read by the package.
68
2.3. Activity profile and onset/offset times
69
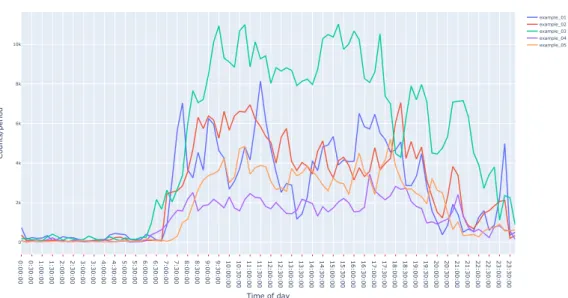
In circadian rhythm and sleep research, profile plots of the mean daily
70
activity of actigraphy recording provides a visual tool to assess the overall
71
rest-activity pattern, as well as recurrent behaviours such as naps. This
pro-72
file is obtained by averaging consecutive data points that are 24h apart, over
73
the consecutive days contained in the recording. The pyActigraphy package
74
provides methods to construct this profile (Fig 1). In addition, it provides
75
two methods to calculate and anchor these 24-hour profiles to the average
76
activity onset and offset times of a given individual in order to ease group
av-77
eraging. These activity onset and offset times are defined as the time points
78
where the relative difference between the mean activity before and after this
79
time point is maximal and minimal, respectively.
80
2.4. Visualization of sleep agenda
81
In both sleep research and medicine, a sleep diary is usually given with
82
an actimeter to allow participants to report sleep episodes (duration and
83
timing) as well as the subjective assessment of sleep quality for example. It
84
allows comparisons between data recorded by an actigraph and the subjective
85
perception of the individual wearing the device. In medical fields, sleep
86
diaries are commonly recommended in order to help doctors in the diagnosis
87
and treatment of sleep-wake disorders. The pyActigraphy package allows
88
users to visualize and analyse sleep diaries, encoded as .ods or .csv files. Each
89
row of these files indicates a new event, characterized by a type, a start time
90
and an end time. A summary function provides descriptive statistics (mean,
91
std, quantiles, ...) for each type of events. For convenience and considering
0:00:00 0:30:00 1:00:00 1:30:00 2:00:00 2:30:00 3:00:00 3:30:00 4:00:00 4:30:00 5:00:00 5:30:00 6:00:00 6:30:00 7:00:00 7:30:00 8:00:00 8:30:00 9:00:00 9:30:00 10:00:00 10:30:00 11:00:00 11:30:00 12:00:00 12:30:00 13:00:00 13:30:00 14:00:00 14:30:00 15:00:00 15:30:00 16:00:00 16:30:00 17:00:00 17:30:00 18:00:00 18:30:00 19:00:00 19:30:00 20:00:00 20:30:00 21:00:00 21:30:00 22:00:00 22:30:00 23:00:00 23:30:00 0 2k 4k 6k 8k 10k example_01 example_02 example_03 example_04 example_05 Daily activity profile Time of day Counts/period
Figure 1: Vizualisation example of average daily profiles obtained with pyActigraphy using example files included in the package.
the current interests of the researchers involved in the development of the
93
package, four types (active, nap, night, no-wear) are implemented by default
94
when a sleep diary is read. However, the pyActigraphy package allows users
95
to remove or customize these types and add new ones. As shown in Fig. 2,
96
the visualization of the sleep diary is allowed through the use of the python
97
plotting library “plotly” [9]. Each event found in the sleep diary is associated
98
with a plotly “shape” object that can be overlaid with the actigraphy data
99
in order to visually assess the adequacy between the subjective reports and
100
their objective counterparts.
101
2.5. Rest-activity rhythm variables
102
Non-parametric rest-activity variables can easily be calculated with the
103
pyActigraphy package. The list of such variables includes:
104
• the interdaily stability (IS) and the intradaily variability (IV) [10],
105
which quantify the day-to-day variance and the activity fragmentation,
106
respectively;
107
• the relative amplitude (RA) [11], which measures the relative difference
108
between the mean activity during the 10 most active hours (M10) and
109
the 5 least active ones (L5).
110
In addition, pyActigraphy implements the mean IS and IV variables, namely
111
ISm and IVm [12], obtained by averaging IS or IV values calculated with
12:00
Jan 24, 191818:00 00:00Jan 25, 191806:00 12:00 18:00 00:00Jan 26, 191806:00 12:00 18:00 00:00Jan 27, 191806:00 12:00 18:00 00:00Jan 28, 191806:00 12:00 18:00 00:00Jan 29, 191806:00 12:00 18:00 00:00Jan 30, 191806:00 12:00 18:00 00:00Jan 31, 191806:00 12:00
0 500 1000 1500 2000 2500 Actigraphy data Date time Counts/period
Figure 2: Vizualisation example of actigraphy data, overlaid with periods (green: nap, grey: night, red: device not worn) reported in the sleep diary example file included in the package.
data resampled at different frequencies. Finally, the pyActigraphy package
113
allows users to calculate the values of the IS(m), IV(m) and RA variables for
114
consecutive, non-overlapping time periods of user-defined lengths. Upon
call-115
ing the corresponding function, users can specify the resampling frequency, if
116
the data must be binarized before calculation, as well as the threshold used
117
to binarize the data.
118
2.6. Fragmentation of rest-activity patterns
119
The pyActigraphy package implements rest-activity state transition
prob-120
abilities, kRAand kAR [13]. These variables quantify the fragmentation of the 121
rest-activity pattern fragmentation; based on a probabilistic state transition
122
model, where epochs with no activity are associated to a “rest” state (R) and
123
to an “active” state (A) otherwise, the kRA variable is associated with the 124
probability to transition from a sustained “rest” state to an “active” state
125
and the kAR variable is associated with the probability to transition from a 126
sustained “active” state to a “rest” state. The pyActigraphy package allows
127
users to restrict the computation of the kRA and kAR variables to specific 128
period of the day. For example, to target sleep periods, users may specify
129
the activity offset and onset times (see section 2.3), as derived from
indi-130
vidual activity profiles, as time boundaries. In the case of the kRA variable, 131
this would provide a quantification of the sleep fragmentation, adapted to a
subject’s specific rest periods.
133
2.7. Rest-activity period detection
134
The pyActigraphy package implements several rest-activity detection
al-135
gorithms, which can be classified into two broad classes:
136
• Epoch-by-epoch rest/activity scoring algorithms: Cole-Kripke’s [14],
137
Oakley’s [15], Sadeh’s [16] and Scripps’ [17] algorithms. The idea
un-138
derlying these algorithms is to convolve the signal contained in a sliding
139
window with a pre-defined kernel. Most algorithms use gaussian-like
140
kernels. If the resulting value is higher than a certain threshold, then
141
the epoch under consideration, usually the one located at the centre of
142
the sliding window, is classified as active and as rest, otherwise.
Fi-143
nally, the window is shifted forward by one epoch and the classification
144
procedure is repeated.
145
• Detection of consolidated periods of similar activity patterns:
Cre-146
spo’s [18] and Roenneberg’s [19] algorithms. These two algorithms are
147
fundamentally different from the epoch-by-epoch scoring algorithm as
148
they intend to detect, at once, consolidated periods of rest. One
ad-149
vantage of this class of algorithms is that it provides a start and a stop
150
time for each period classified as rest.
151
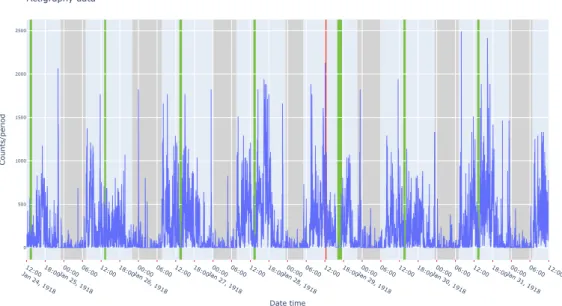
As illustrated in Fig. 3, these algorithms have been implemented to return a
152
binary time series: 0 being rest or activity depending on the definition made
153
in the original article describing the detection algorithm.
154
Based on the aforementioned algorithms, the pyActigraphy package
al-155
lows also the computation of a sleep regularity profile which quantifies the
156
probability for the participant to be in the same state (rest or active) at
157
any daytime point on a day-by-day basis. From this 24h profile, the sleep
158
regularity index (SRI) [20, 21] can be calculated as the product of theses
159
probabilities over all the time bins.
160
Finally, using the detection algorithms of the latter class, the
pyActig-161
raphy package allows the computation of the sleep midpoint as described
162
in [21].
163
2.8. Advanced signal processing
164
The pyActigraphy package makes available additional functions for more
165
advanced analyses of actigraphy recordings:
12:00
Jan 24, 1918Jan 25, 191800:00 12:00 Jan 26, 191800:00 12:00 Jan 27, 191800:00 12:00 Jan 28, 191800:00 12:00 Jan 29, 191800:00 12:00 Jan 30, 191800:00 12:00 Jan 31, 191800:00 12:00
0 500 1000 1500 2000 2500 0 1 Data Roenneberg Roenneberg (Thr:0.25) Actigraphy data Date time Counts/period Classification
Figure 3: Vizualisation example of actigraphy data, overlaid with periods scored as “ac-tive” (0) or “rest” (1) by Roennberg’s algorithm [19] for two different settings (full line: default parameter values, dash line: with a threshold set at 0.25 of the activity trend).
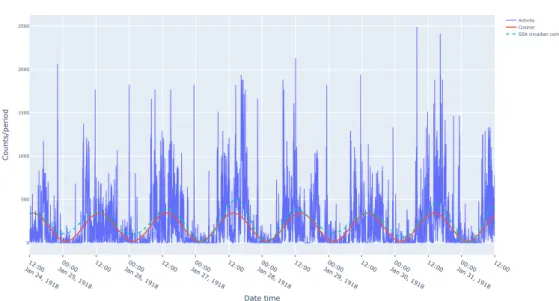
• Cosinor [22]: the idea of a Cosinor analysis is to estimate some key parameters of the actigraphy count series by fitting these data with a (co)sine curve:
Y (t) = M + A ∗ cos(2π
T ∗ t + φ)
where M is the MESOR (Midline Statistic Of Rhythm), A is the
ampli-167
tude of the oscillations, T is the period and φ is the acrophase. The fit
168
procedure provides estimates of these parameters which can then help
169
to characterize the 24h rest-activity rhythm of an individual.
170
• Detrented Fluctuation Analysis (DFA) [23, 24]: human activity
ex-171
hibits a temporal organization characterised by scale-invariant (fractal)
172
patterns over time scales ranging from minutes to 24 hours. This
orga-173
nization has been shown to be degraded with aging and dementia [25].
174
The DFA method allows the quantification of this scale-invariance and
175
comprises four steps:
176
1. Signal integration and mean subtraction
177
2. Signal segmentation
178
3. Local detrending of each segment
179
4. Computation of the q-th order fluctuations
All these steps have been implemented in the DFA class of
pyActigra-181
phy .
182
• Functional linear modelling (FLM) [26]: it consists in converting
dis-183
crete measures to a function or a set of functions that can be used for
184
further analysis. In most cases, the smoothness of the resulting function
185
is under control, which ensures the derivability of this function. Three
186
techniques are available in pyActigraphy to convert the actigraphy data
187 to a functional form: 188 – Fourier expansion 189 – B-spline interpolation 190 – Smoothing 191
In the context of actigraphy, functional linear modelling and analysis
192
have been successfully applied to link sleep apnea and obesity to specific
193
circadian activity patterns [27].
194
• Locomotor inactivity during sleep (LIDS) [28]: the analysis of the
lo-195
comotor activity during sleep revealed a rhythmicity that mimics the
196
ultradian dynamic of sleep. This type of analysis opens new
opportu-197
nities to study, in situ, sleep dynamics at a large scale and over large
198
individual time periods. The LIDS class implements all the necessary
199
functions to perform the analysis of the LIDS oscillations:
200
– sleep bout filtering
201
– non-linear conversion of activity to inactivity
202
– extraction of the characteristic features of the LIDS oscillations
203
via a cosine fit
204
• Singular spectrum analysis (SSA) [29, 30]: this technic allows the
de-205
composition of a time series into additive components and the
quantifi-206
cation of their respective partial variance. In the context of actigraphy,
207
SSA can be used to extract the signal trend as well as circadian and
208
ultradian components separately. The latter is relevant in human sleep
209
research because sleep is not only alternating with wakefulness over the
210
24-hour cycle, but also exhibits an ultradian modulation, as mentioned
211
previously. For example, a SSA analysis has been used to reveal
al-212
terations of the ultradian rhythms in insomnia [31]. All the necessary
213
steps for the SSA and related functions, namely the embedding, the
214
singular value decomposition, the eigentriple grouping and the
diago-215
nal averaging, are implemented in the SSA class. Since the subsequent
calculations can be computationally intensive, the class
implementa-217
tion uses the open-source compiler Numba [32] for a direct translation
218
of the functions to machine code and therefore improve their execution
219
speed by several orders of magnitudes.
220
2.9. Online documentation and tutorials
221
The online documentation of the pyActigraphy package contains
instruc-222
tions to install the package, as well as informations about the authors and
223
the code license. It also contains a detailed description of the attributes and
224
methods available in the pyActigraphy package, which is generated
automat-225
ically from source code annotations. In order to keep the documentation up
226
to date with the latest developments of the package, the documentation is
227
automatically generated anew and made available online for each new
re-228
lease. Finally, the online documentation offers several tutorials, illustrating
229
the various functionalities of the package. These tutorials are generated from
230
Jupyter notebooks [33] that are included in the pyActigraphy package itself,
231
so that they can be used by any user to reproduce and practice the various
232
functionalities of the pyActigraphy package in an interactive and user-friendly
233
environment. As input data, the tutorials use real example data files that
234
are included in the package for illustration and testing purposes. In total, 13
235
examples are included.
236
3. Illustrative Examples
237
As mentioned in section 2.9, the functionalities of the pyActigraphy
pack-238
age are illustrated in several notebooks that act as tutorials and are part of
239
the online documentation. Nonetheless, this section provides two examples
240
on how to read and analyse actigraphy files.
241
3.1. Basic example
242
The source code in Listing 1 is used to read multiple actigraphy files
243
at once and calculate the rest-activity variables mentioned in sections 2.5
244
and 2.6. In this example, the results are simply printed but can be reused
245
for further analyses.
246
Listing 1: Basic example #Import p a c k a g e s 247 import pyActigraphy , o s 248 #D e f i n e p a t h t o e x a m p l e f i l e s 249 #( i n c l u d e d i n t h e p y A c t i g r a p h y p a c k a g e ) 250 f p a t h = o s . path . j o i n ( 251
o s . path . dirname ( p y A c t i g r a p h y . f i l e ) , ’ t e s t s / d a t a / ’ 252 ) 253 254 #Read a l l A c t i w a t c h 4 ( CamNtech ) f i l e s i n t h e t e s t d i r e c t o r y : 255 raw = p y A c t i g r a p h y . i o . r e a d r a w ( 256 f p a t h+ ’ e x a m p l e 0 [ 0 − 9 ] .AWD’ , 257 r e a d e r t y p e= ’AWD’ 258 ) 259 260
#Most f u n c t i o n s can b e a c c e s s e d t h r o u g h t h i s ” raw ” o b j e c t .
261 262
#Ex : c a l c u l a t e non−p a r a m e t r i c r e s t −a c t i v i t y v a r i a b l e s
263 I S s = raw . I S ( ) 264 IVs = raw . IV ( ) 265 266 #Ex : c a l c u l a t e t h e p r o b a b i l i t y t o t r a n s i t i o n 267 #from R e s t t o A c t i v e 268
kRAs = raw . kRA( 0 )
269 270 #P r i n t t h e r e s u l t s f o r a l l f i l e s 271 print ( ’ S u b j e c t ID ; I S ; IV ; kRA ’ ) 272 f o r k in myIS . k e y s ( ) : 273 print ( ’ {} ; { : . 2 f } ; { : . 2 f } ; { : . 2 f } ’ . format ( 274 k , I S s [ k ] , IVs [ k ] , kRAs [ k ] ) 275 ) 276 3.2. Advanced example 277
In Listing 2, a more complex example is provided. It illustrates how to fit
278
actigraphy data with a cosinor model (section 2.8). In addition, the data are
279
decomposed into several components via singular spectrum analysis (SSA)
280
and the component whose pseudo-period is close to 24h is extracted.
281
Listing 2: Advanced example #Import p a c k a g e s
282
import pyActigraphy , o s
283
from p y A c t i g r a p h y . a n a l y s i s import C o s i n o r , SSA
284 #D e f i n e p a t h t o an e x a m p l e f i l e 285 #( i n c l u d e d i n t h e p y A c t i g r a p h y p a c k a g e ) 286 f p a t h = o s . path . j o i n ( 287 o s . path . dirname ( p y A c t i g r a p h y . f i l e ) , ’ t e s t s / d a t a / ’ 288 ) 289
290 #Read a l l A c t i w a t c h 4 ( CamNtech ) f i l e s 291 #i n t h e t e s t d i r e c t o r y : 292 raw = p y A c t i g r a p h y . i o . r e a d r a w a w d ( f p a t h+ ’ e x a m p l e 0 1 .AWD’ ) 293 294 #I n i t i a l i z e a C o s i n o r model o b j e c t . 295 myCosinor = C o s i n o r ( ) 296 # and f i t i t t o t h e d a t a 297
r e s u l t s = myCosinor . f i t ( raw , v e r b o s e=True )
298 #I n s p e c t r e s u l t s 299 r e s u l t s . params . p r e t t y p r i n t ( ) 300 # C o s i n o r model w i t h p a r a m e t e r s s e t t o t h e i r e s t i m a t e d v a l u e s 301 c o s i n o r f i t = c o s i n o r . b e s t f i t ( raw , r e s u l t s . params ) 302 303 #I n i t i a l i z e a SSA o b j e c t w i t h t h e ‘ raw ’ o b j e c t 304
mySSA = SSA ( raw . data , w i n d o w l e n g t h= ’ 24h ’ )
305 # and f i t i t t o t h e d a t a 306 mySSA . f i t ( ) 307 #I n s p e c t t h e s i n g u l a r v a l u e s 308 mySSA . l a m b d a s 309 #C a l c u l a t e t h e w e i g h t e d c o r r e l a t i o n m a t r i x 310 #f o r t h e f i r s t 10 components 311 w c o r r m a t = mySSA . w c o r r e l a t i o n m a t r i x ( 1 0 ) 312 313 #Based on t h e r e s u l t s o f t h e w e i g h t e d c o r r e l a t i o n m a t r i x , 314 #i t i s s t r a i g h t f o r w a r d t o r e a l i z e t h a t 315
#t h e f i r s t and s e c o n d SSA components
316
# ( X t i l d e ) a r e s t r o n g l y c o r r e l a t e d and need t o b e merged .
317
c i r c = mySSA . X t i l d e ( [ 1 , 2 ] )
318
The result of the Cosinor model, as well the circadian SSA component
319
extracted from the data can then be used for further analyses or simply
320
plotted for visual inspection (Fig. 4).
321
More generally, complete informations on each function can accessed
322
through the usual python “help” command or through the online
documen-323
tation.
324
4. Impact
325
Even though actigraphy has been used in the field of sleep and
chronobi-326
ology research for the past 40 years, there is, to our knowledge, no
compre-327
hensive open-source analysis package for actigraphy data that would allow
12:00
Jan 24, 1918Jan 25, 191800:00 12:00 Jan 26, 191800:00 12:00 Jan 27, 191800:00 12:00 Jan 28, 191800:00 12:00 Jan 29, 191800:00 12:00 Jan 30, 191800:00 12:00 Jan 31, 191800:00 12:00
0 500 1000 1500 2000 2500 Activity Cosinor SSA circadian component Actigraphy data Date time Counts/period
Figure 4: Vizualisation example.
users to read various data format, perform the necessary data cleaning as
329
well as some more advanced data analysis within a single framework. This
330
is all the more necessary as it would improve the reproducibility of research
331
outcomes by limiting the proliferation of private analysis codes [35]. It would
332
also allow users to perform more complex analyses and therefore make
op-333
timal use of actigraphy data that are often part of costly multi-modal data
334
acquisition protocols. Such analysis package would also help to reduce error
335
rates by alleviating the burden of manual data processing that hampers the
336
processing of large-scale actigraphy datasets. The emergence of nation-wide
337
biobanks, which would be crucial for understanding public health issues such
338
as the impact of daylight time saving changes or chronic sleep deprivation,
339
should be matched by the emergence of appropriate analysis tools. Besides,
340
facilitating the access to such analysis tools for actigraphy data would
ben-341
efit other fields of neuroscience. For example, there are evidence for a link
342
between human brain structure and the locomotor activity, whether it is the
343
total amount of activity [36, 37], the sleep fragmentation [38] or the integrity
344
of the circadian rhythmicity [3, 39]. Human brain functions are also
modu-345
lated by circadian and/or seasonal rhythmicity [40, 41]. Therefore, a precise
346
assessment of rhythmicity, as allowed by actigraphy, is crucial for functional
347
brain imaging and cognitive studies too. This is one of many examples that
348
emphasize the benefit of extending the use of actigraphy outside the field of
349
sleep and circadian research.
5. Conclusions
351
We present the pyActigraphy toolbox, an open-source python package
352
for actigraphy data visualisation and analysis which offers functionalities to
353
automatise data pre-processing, read large file batches and implement various
354
metrics and techniques for the analysis of actigraphy data. By developing
355
the pyActigraphy package, we not only hope to facilitate data analysis but
356
also foster research using actimetry and drive a community effort to improve
357
this open-source package and develop new variables and algorithms.
358
6. Conflict of Interest
359
We wish to confirm that there are no known conflicts of interest associated
360
with this publication and there has been no significant financial support for
361
this work that could have influenced its outcome.
362
Acknowledgements
363
The development of the pyActigraphy toolbox is part of the CogNap
364
project that has received funding from the European Research Council (ERC)
365
under the European Union’s Horizon 2020 research and innovation
pro-366
gramme (Grant agreement No. 757763). This work was also supported
367
by the Fonds de la Recherche Scientifique - FNRS under Grant n T.0220.20.
368
CS is a research associate and MD is a FRIA grantee of the Fonds de la
369
Recherche Scientifique FNRS, Belgium.
370
GH would like to warmly thank A. Lim and E. Winnebeck for having
371
shared both insights and their code for the state transition probability and
372
the LIDS analyses, respectively. GH would also like to thank A. Aubin and B.
373
Leroy, who participated in the implementation of the pyActigraphy package
374
during their summer internship at the GIGA-CRC in vivo imaging laboratory
375
in 2018 and 2019, respectively.
376
7. References
377
[1] S. Ancoli-Israel, R. Cole, C. Alessi, M. Chambers, W. Moorcroft, C. P.
378
Pollak, The Role of Actigraphy in the Study of Sleep and Circadian
379
Rhythms, Sleep 26 (3) (2003) 342–392. doi:10.1093/sleep/26.3.342.
380
URL https://academic.oup.com/sleep/article-lookup/doi/10.1093/sleep/26.3.342
381
[2] J. M. Oosterman, E. J. W. van Someren, R. L. C. Vogels, B. Van
382
Harten, E. J. A. Scherder, Fragmentation of the rest-activity rhythm
383
correlates with age-related cognitive deficits., Journal of sleep research
18 (1) (2009) 129–35. doi:10.1111/j.1365-2869.2008.00704.x. 385 URL http://doi.wiley.com/10.1111/j.1365-2869.2008.00704.x 386 http://www.ncbi.nlm.nih.gov/pubmed/19250179 387
[3] E. J. Van Someren, J. M. Oosterman, B. Van Harten, R. L. Vogels, A. A.
388
Gouw, H. C. Weinstein, A. Poggesi, P. Scheltens, E. J. Scherder,
Me-389
dial temporal lobe atrophy relates more strongly to sleep-wake rhythm
390
fragmentation than to age or any other known risk, Neurobiology of
391
Learning and Memory (2018) 0–1doi:10.1016/j.nlm.2018.05.017.
392
URL https://doi.org/10.1016/j.nlm.2018.05.017
393
[4] A. S. Lim, L. Yu, M. D. Costa, S. E. Leurgans, A. S. Buchman,
394
D. A. Bennett, C. B. Saper, Increased Fragmentation of Rest-Activity
395
Patterns Is Associated With a Characteristic Pattern of
Cogni-396
tive Impairment in Older Individuals, Sleep 35 (5) (2012) 633–640.
397
doi:10.5665/sleep.1820.
398
URL https://academic.oup.com/sleep/article-lookup/doi/10.5665/sleep.1820
399
[5] A. S. Lim, M. Kowgier, L. Yu, A. S. Buchman, D. A. Bennett, Sleep
400
Fragmentation and the Risk of Incident Alzheimer’s Disease and
401
Cognitive Decline in Older Persons, Sleep 36 (7) (2013) 1027–1032.
402
doi:10.5665/sleep.2802.
403
URL https://academic.oup.com/sleep/article/36/7/1027/2453864
404
[6] A. Ferguson, L. M. Lyall, J. Ward, R. J. Strawbridge, B. Cullen,
405
N. Graham, C. L. Niedzwiedz, K. J. Johnston, D. MacKay, S. M. Biello,
406
J. P. Pell, J. Cavanagh, A. M. McIntosh, A. Doherty, M. E. Bailey,
407
D. M. Lyall, C. A. Wyse, D. J. Smith, Genome-Wide Association Study
408
of Circadian Rhythmicity in 71,500 UK Biobank Participants and
409
Polygenic Association with Mood Instability, EBioMedicine 35 (2018)
410 279–287. doi:10.1016/j.ebiom.2018.08.004. 411 URL https://doi.org/10.1016/j.ebiom.2018.08.004 412 https://linkinghub.elsevier.com/retrieve/pii/S2352396418302925 413
[7] S. E. Jones, V. T. van Hees, D. R. Mazzotti, P. Marques-Vidal, S. Sabia,
414
A. van der Spek, H. S. Dashti, J. Engmann, D. Kocevska, J. Tyrrell,
415
R. N. Beaumont, M. Hillsdon, K. S. Ruth, M. A. Tuke, H. Yaghootkar,
416
S. A. Sharp, Y. Ji, J. W. Harrison, R. M. Freathy, A. Murray, A. I. Luik,
417
N. Amin, J. M. Lane, R. Saxena, M. K. Rutter, H. Tiemeier, Z. Kutalik,
418
M. Kumari, T. M. Frayling, M. N. Weedon, P. R. Gehrman, A. R. Wood,
419
Genetic studies of accelerometer-based sleep measures yield new insights
420
into human sleep behaviour, Nature Communications 10 (1) (2019) 1585.
doi:10.1038/s41467-019-09576-1.
422
URL http://www.nature.com/articles/s41467-019-09576-1
423
[8] G. Hammad, M. Reyt, C. Schmidt, pyActigraphy: Open-source python
424
package for actigraphy data visualization and analysis (Aug. 2019).
425
doi:10.5281/zenodo.3379063.
426
URL https://doi.org/10.5281/zenodo.3379063
427
[9] P. T. Inc., Collaborative data science (2015).
428
URL https://plot.ly
429
[10] W. Witting, I. Kwa, P. Eikelenboom, M. Mirmiran, D. Swaab,
Alter-430
ations in the circadian rest-activity rhythm in aging and Alzheimer’s
431
disease, Biological Psychiatry 27 (6) (1990) 563–572.
doi:10.1016/0006-432
3223(90)90523-5.
433
URL http://linkinghub.elsevier.com/retrieve/pii/0006322390905235
434
[11] E. J. Van Someren, C. Lijzenga, M. Mirmiran, D. F. Swaab, Long-Term
435
Fitness Training Improves the Circadian Rest-Activity Rhythm in
436
Healthy Elderly Males, Journal of Biological Rhythms 12 (2) (1997)
437
146–156. doi:10.1177/074873049701200206.
438
URL http://journals.sagepub.com/doi/10.1177/074873049701200206
439
[12] B. S. Gon¸calves, P. R. Cavalcanti, G. R. Tavares, T. F. Campos,
440
J. F. Araujo, Nonparametric methods in actigraphy: An update, Sleep
441
Science 7 (3) (2014) 158–164. doi:10.1016/j.slsci.2014.09.013.
442
URL http://linkinghub.elsevier.com/retrieve/pii/S1984006314000510
443
[13] A. S. Lim, L. Yu, M. D. Costa, A. S. Buchman, D. A. Bennett,
444
S. E. Leurgans, C. B. Saper, Quantification of the Fragmentation of
445
Rest-Activity Patterns in Elderly Individuals Using a State Transition
446
Analysis, Sleep 34 (11) (2011) 1569–1581. doi:10.5665/sleep.1400.
447
URL https://academic.oup.com/sleep/article-lookup/doi/10.5665/sleep.1400
448
[14] R. J. Cole, D. F. Kripke, W. Gruen, D. J. Mullaney, J. C. Gillin,
449
Automatic Sleep/Wake Identification From Wrist Activity, Sleep 15 (5)
450
(1992) 461–469. doi:10.1093/sleep/15.5.461.
451
URL https://academic.oup.com/sleep/article-lookup/doi/10.1093/sleep/15.5.461
452
[15] N. Oakley, Validation with polysomnography of the sleepwatch
sleep-453
/wake scoring algorithm used by the actiwatch activity monitoring
sys-454
tem, Bend: Mini Mitter, Cambridge Neurotechnology (1997).
[16] A. Sadeh, M. Sharkey, M. A. Carskadon, Activity-Based Sleep-Wake
456
Identification: An Empirical Test of Methodological Issues, Sleep 17 (3)
457
(1994) 201–207. doi:10.1093/sleep/17.3.201.
458
URL https://academic.oup.com/sleep/article-lookup/doi/10.1093/sleep/17.3.201
459
[17] D. F. Kripke, E. K. Hahn, A. P. Grizas, K. H. Wadiak, R. T.
Lov-460
ing, J. S. Poceta, F. F. Shadan, J. W. Cronin, L. E. Kline, Wrist
acti-461
graphic scoring for sleep laboratory patients: algorithm development,
462
Journal of Sleep Research 19 (4) (2010) 612–619.
doi:10.1111/j.1365-463
2869.2010.00835.x.
464
URL http://doi.wiley.com/10.1111/j.1365-2869.2010.00835.x
465
[18] C. Crespo, M. Aboy, J. R. Fern´andez, A. Moj´on, Automatic
identifica-466
tion of activityrest periods based on actigraphy, Medical & Biological
467
Engineering & Computing 50 (4) (2012) 329–340.
doi:10.1007/s11517-468
012-0875-y.
469
URL http://link.springer.com/10.1007/s11517-012-0875-y
470
[19] T. Roenneberg, L. K. Keller, D. Fischer, J. L. Matera, C. Vetter, E. C.
471
Winnebeck, Human activity and rest in situ., Methods in enzymology
472 552 (2015) 257–283. doi:10.1016/bs.mie.2014.11.028. 473 URL https://linkinghub.elsevier.com/retrieve/pii/S0076687914000937 474 http://www.ncbi.nlm.nih.gov/pubmed/25707281 475
[20] A. J. K. Phillips, W. M. Clerx, C. S. O’Brien, A. Sano, L. K. Barger,
476
R. W. Picard, S. W. Lockley, E. B. Klerman, C. A. Czeisler, Irregular
477
sleep/wake patterns are associated with poorer academic performance
478
and delayed circadian and sleep/wake timing, Scientific Reports 7 (1)
479
(2017) 3216. doi:10.1038/s41598-017-03171-4.
480
URL http://www.nature.com/articles/s41598-017-03171-4
481
[21] J. R. Lunsford-Avery, M. M. Engelhard, A. M. Navar, S. H. Kollins,
482
Validation of the Sleep Regularity Index in Older Adults and
Associa-483
tions with Cardiometabolic Risk, Scientific Reports 8 (1) (2018) 14158.
484
doi:10.1038/s41598-018-32402-5.
485
URL http://www.nature.com/articles/s41598-018-32402-5
486
[22] R. Refinetti, G. Corn´elissen, F. Halberg, Procedures for numerical
487
analysis of circadian rhythms, Biological Rhythm Research 38 (4)
488
(2007) 275–325. doi:10.1080/09291010600903692.
489
URL http://www.tandfonline.com/doi/abs/10.1080/09291010600903692
[23] C.-K. Peng, S. V. Buldyrev, S. Havlin, M. Simons, H. E. Stanley, A. L.
491
Goldberger, Mosaic organization of DNA nucleotides, Physical Review
492
E 49 (2) (1994) 1685–1689. doi:10.1103/PhysRevE.49.1685.
493
URL https://link.aps.org/doi/10.1103/PhysRevE.49.1685
494
[24] C. Peng, S. Havlin, H. E. Stanley, A. L. Goldberger, Quantification of
495
scaling exponents and crossover phenomena in nonstationary heartbeat
496
time series, Chaos: An Interdisciplinary Journal of Nonlinear Science
497
5 (1) (1995) 82–87. doi:10.1063/1.166141.
498
URL http://aip.scitation.org/doi/10.1063/1.166141
499
[25] K. Hu, E. J. Van Someren, S. A. Shea, F. A. Scheer,
Reduc-500
tion of scale invariance of activity fluctuations with aging and
501
Alzheimer’s disease: Involvement of the circadian pacemaker,
Proceed-502
ings of the National Academy of Sciences 106 (8) (2009) 2490–2494.
503
doi:10.1073/pnas.0806087106.
504
URL http://www.pnas.org/lookup/doi/10.1073/pnas.0806087106
505
[26] J. O. Ramsay, B. W. Silverman, Applied Functional Data Analysis :
506
Methods and Case Studies, springer series in statistics Edition,
Springer-507
Verlag, New York, 2002.
508
[27] J. Wang, H. Xian, A. Licis, E. Deych, J. Ding, J. McLeland, C.
Toede-509
busch, T. Li, S. Duntley, W. Shannon, Measuring the impact of apnea
510
and obesity on circadian activity patterns using functional linear
511
modeling of actigraphy data, Journal of Circadian Rhythms 9 (1)
512
(2011) 11. doi:10.1186/1740-3391-9-11.
513
URL https://www.jcircadianrhythms.com/article/10.1186/1740-3391-9-11
514
[28] E. C. Winnebeck, D. Fischer, T. Leise, T. Roenneberg, Dynamics and
515
Ultradian Structure of Human Sleep in Real Life, Current Biology 28 (1)
516
(2018) 49–59.e5. doi:10.1016/j.cub.2017.11.063.
517
URL https://doi.org/10.1016/j.cub.2017.11.063
518
[29] R. Vautard, P. Yiou, M. Ghil, Singular-spectrum analysis: A toolkit for
519
short, noisy chaotic signals, Physica D: Nonlinear Phenomena 58 (1-4)
520
(1992) 95–126. doi:10.1016/0167-2789(92)90103-T.
521
URL https://linkinghub.elsevier.com/retrieve/pii/016727899290103T
522
[30] N. Golyandina, A. Zhigljavsky, Singular Spectrum Analysis for Time
523
Series, no. January 2013 in SpringerBriefs in Statistics, Springer Berlin
524
Heidelberg, Berlin, Heidelberg, 2013. doi:10.1007/978-3-642-34913-3.
525
URL http://link.springer.com/10.1007/978-3-642-34913-3
[31] R. Fossion, A. L. Rivera, J. C. Toledo-Roy, J. Ellis, M. Angelova,
Mul-527
tiscale adaptive analysis of circadian rhythms and intradaily variability:
528
Application to actigraphy time series in acute insomnia subjects, PLOS
529
ONE 12 (7) (2017) e0181762. doi:10.1371/journal.pone.0181762.
530
URL http://rsif.royalsocietypublishing.org/cgi/doi/10.1098/rsif.2013.1112
531
https://dx.plos.org/10.1371/journal.pone.0181762
532
[32] S. K. Lam, A. Pitrou, S. Seibert, Numba: A llvm-based python jit
com-533
piler, in: Proceedings of the Second Workshop on the LLVM Compiler
534
Infrastructure in HPC, LLVM 15, Association for Computing
Machin-535
ery, New York, NY, USA, 2015. doi:10.1145/2833157.2833162.
536
URL https://doi.org/10.1145/2833157.2833162
537
[33] T. Kluyver, B. Ragan-Kelley, F. P´erez, B. E. Granger, M. Bussonnier,
538
J. Frederic, K. Kelley, J. B. Hamrick, J. Grout, S. Corlay, P. Ivanov,
539
D. Avila, S. Abdalla, C. Willing, et al., Jupyter notebooks - a publishing
540
format for reproducible computational workflows, in: ELPUB, 2016.
541
[34] A. Silver, Collaborative software development made easy, Nature
542
550 (7674) (2017) 143–144. doi:10.1038/550143a.
543
URL http://www.nature.com/articles/550143a
544
[35] S. J. Eglen, B. Marwick, Y. O. Halchenko, M. Hanke, S. Sufi, P.
Glee-545
son, R. A. Silver, A. P. Davison, L. Lanyon, M. Abrams, T. Wachtler,
546
D. J. Willshaw, C. Pouzat, J.-B. Poline, Toward standard practices
547
for sharing computer code and programs in neuroscience, Nature
548 Neuroscience 20 (6) (2017) 770–773. doi:10.1038/nn.4550. 549 URL http://dx.doi.org/10.1038/nn.4550 550 http://www.nature.com/articles/nn.4550 551
[36] K. I. Erickson, R. L. Leckie, A. M. Weinstein, Physical activity, fitness,
552
and gray matter volume, Neurobiology of Aging 35 (2 II) (2014) S20–
553 S28. arXiv:NIHMS150003, doi:10.1016/j.neurobiolaging.2014.03.034. 554 URL http://dx.doi.org/10.1016/j.neurobiolaging.2014.03.034 555 https://linkinghub.elsevier.com/retrieve/pii/S0197458014003492 556
[37] M. Hamer, N. Sharma, G. D. Batty, Association of objectively measured
557
physical activity with brain structure: UK Biobank study, Journal of
558
Internal Medicine 284 (4) (2018) 439–443. doi:10.1111/joim.12772.
559
URL http://doi.wiley.com/10.1111/joim.12772
560
[38] A. S. Lim, D. A. Fleischman, R. J. Dawe, L. Yu, K. Arfanakis, A. S.
561
Buchman, D. A. Bennett, Regional Neocortical Gray Matter Structure
and Sleep Fragmentation in Older Adults, Sleep 39 (1) (2016) 227–235. 563 doi:10.5665/sleep.5354. 564 URL https://academic.oup.com/sleep/article-lookup/doi/10.5665/sleep.5354 565 https://academic.oup.com/sleep/article/39/1/227/2726059 566
[39] M. Baillet, B. Dilharreguy, K. P´er`es, J.-F. Dartigues, W. Mayo,
567
G. Catheline, Activity/rest cycle and disturbances of structural
back-568
bone of cerebral networks in aging, NeuroImage 146 (2017) 814–820.
569 doi:10.1016/j.neuroimage.2016.09.051. 570 URL http://dx.doi.org/10.1016/j.neuroimage.2016.09.051 571 https://linkinghub.elsevier.com/retrieve/pii/S1053811916305262 572
[40] V. Muto, M. Jaspar, C. Meyer, C. Kusse, S. L. Chellappa, C.
Deguel-573
dre, E. Balteau, A. Shaffii-Le Bourdiec, A. Luxen, B. Middleton,
574
S. N. Archer, C. Phillips, F. Collette, G. Vandewalle, D.-J. Dijk,
575
P. Maquet, Local modulation of human brain responses by circadian
576
rhythmicity and sleep debt, Science 353 (6300) (2016) 687–690.
577
doi:10.1126/science.aad2993.
578
URL http://www.sciencemag.org/cgi/doi/10.1126/science.aad2993
579
[41] C. Meyer, V. Muto, M. Jaspar, C. Kuss´e, E. Lambot, S. L. Chellappa,
580
C. Degueldre, E. Balteau, A. Luxen, B. Middleton, S. N. Archer, F.
Col-581
lette, D.-J. Dijk, C. Phillips, P. Maquet, G. Vandewalle, Seasonality in
582
human cognitive brain responses, Proceedings of the National Academy
583
of Sciences 113 (11) (2016) 3066–3071. doi:10.1073/pnas.1518129113.
584
URL http://www.pnas.org/lookup/doi/10.1073/pnas.1518129113
585
Current executable software version
586
Ancillary data table required for sub version of the executable software:
587
(x.1, x.2 etc.) kindly replace examples in right column with the correct
588
information about your executables, and leave the left column as it is.
Nr. (Executable) software meta-data description
Please fill in this column
S1 Current software version v1.0.
S2 Permanent link to executables of
this version
https://github.com/ghammad/pyActigraphy/releases/tag
S3 Legal Software License GPL-3.0
S4 Computing platforms/Operating
Systems
Linux, OS X, Microsoft Windows S5 Installation requirements &
depen-dencies
Python 3.6 S6 If available, link to user manual - if
formally published include a ence to the publication in the refer-ence list
https://ghammad.github.io/pyActigraphy/
S7 Support email for questions [email protected]
![Figure 3: Vizualisation example of actigraphy data, overlaid with periods scored as “ac- “ac-tive” (0) or “rest” (1) by Roennberg’s algorithm [19] for two different settings (full line:](https://thumb-eu.123doks.com/thumbv2/123doknet/6627091.180613/8.892.156.722.202.516/figure-vizualisation-actigraphy-overlaid-roennberg-algorithm-different-settings.webp)