Journal of Fundamental and Applied Sciences is licensed under aCreative Commons Attribution-NonCommercial 4.0 International License. Libraries Resource Directory. We are listed under Research Associations category.
ABUNDANCE AND SPECIES RICHNESS OF LOMBRIC MACROFAUNA IN A SEMI-ARID FOREST ECOSYSTEM
N. Ababsa1, 2*, A. Laiche1 and F. Djabbar1
1
Department of ecology and environment, Faculty of Nature and Life Sciences, Abbes Laghrour, University, Khenchela, Algeria
2
Laboratoire des Ressources Naturelles et Aménagement des milieux sensibles, Larbi Ben M’hidi University, Oum El Bouaghi, Algeria
Received: 14 Mars 2017 / Accepted: 26 August 2017 / Published online: 01 September 2017
ABSTRACT
The importance of earthworms for soils has evolved over time. Our study was conducted in the forest of Ouled yagoub (North East Algerian).
Sampling at three different altitudes resulted in a total of forty-nine individuals (49) and only three species were identified: Octodrilus complanatus, Allolobophora molleri and
Aporrectodea rosea. Spread over two ecological categories.The specific richness is higher in the site of 1400 m of altitude. The Simpson index (Is) varies between 0.44 and 0.49 for the three study sites. The Shannon index fluctuates between 0.41 and 0.74. The values of the Hill index vary between 1 and 1.5 in the three Sites.
Keywords: Abundance, earthworm, species richness, biodiversity.
Author Correspondence, e-mail: welnim@yahoo.fr doi: http://dx.doi.org/10.4314/jfas.v9i3.24
1. INTRODUCTION
Soil is an extraordinary biotope for many organisms. In good conditions, it contains up to one billion micro-organisms per gram and one to four tons of earthworms per hectare [1].The
ISSN 1112-9867
majority of the pedo-fauna is essentially located where the energy potential of the vegetable inputs lies, however, burrowing animals may move away from it when circumstances require it [2]. Their abundance, biomass, diversity and bioturbation activity are indicators of soil quality. Earthworms are a major component of soil faunal communities in most ecosystems and include a large proportion of macrofauna biomass [3-7]. Hutha [8], consider them as key organisms in the functioning of soils. Lemtiri and al. [9] indicate that earthworms are important biological factors in soil ecosystems and can be used as bioindicators of soil health. From an abundance point of view, earthworms are not dominant, but their sizes and biomasses make them one of the main contributors to the biomass of invertebrates in soils [5, 10]. According to Edwards and Bohlen [3], the size of the populations is intermediate between that found in the most sterile habitats and those of the natural grasslands. This earthworm density is directly related to the climate and nature of the soil, where the highest densities of earthworms are noticed in the tropics. Cluzeau [11], reports an abundance of: 20 to 100 ind./ m2 in vineyard soils, 20 to 150 ind./ m2 in the soils of the growing plot, 60-300 ind./ m2 in grassland soils and 10-50 ind./ m2 in forests. In earthworms, about 3700 species have been described to date, representing a significant proportion of the 6000 species estimated for the total biodiversity of this group [12], the earthworms of North Africa are still poorly known, this group of soil fauna seems to attract little interest from scientists in Algeria [13]. In the three countries of the Maghreb (Morocco, Algeria, Tunisia), 33 species of earthworms were reported by Omodeo et al., [14]. Bazri et al. [13], determined 18 species in their study in eastern Algeria, Baha [15], has inventoried 11 species in the area known as Algiers, Ouahrani [16], has determined 11 species in the area known as Constantinoi. Decaëns [17], notes that the identification and classification of these organisms remains difficult due to (i) the lack of qualified taxonomists; (ii) in addition to this the study of earthworms is not evident in Due to several constraints related to the nature of the soils and the complexity of these organisms.
Our work is limited to the earthworm macrofauna considered as ecosystem engineers; it is an approach to the study of the abundance and diversity of earthworm populations in a forest ecosystem in semi- Arid regions because of the importance of these ecosystem engineers in maintaining soil fertility and structural stability, and the lack of studies in this area in semi-arid regions.
2. MATERIAL AND METHODS 2.1. Study area
The study area is located at the northeastern extremity of the Aurès massif, on the last chains of the town of Khenchela. It is an isosceles triangle whose base is oriented to the south. It is bounded by the depressions of outa mouroudj and outa ziriz, on the North by the departmental road khenchela Kais and on the West by the valley of Oued Mellagou extended to the North of Bouhmama by The road Bouhmama –Kais. It is located between 6 ° 47 '-7 ° 7' east longitude and 35 ° 18 '- 35 ° 29' north latitude.
The soils of the Ouled Yagoub forest are calcimorphs at different stages of evolution or degradation. Limestone brown soils are rare. These are shallow skeletal soils on steep slopes [18]. The humus layer is poor with often very little decomposed humus. The litter when it exists consists of pine needles and green oak leaves and other shrub species. These soils are based on the anticlines of Chélia and Khenchela and in the heart of the synclinal of Djebel Aurès with a marlstone and limestone facies. The bedrocks are limestones, marls, clays and sometimes gypsum [18].
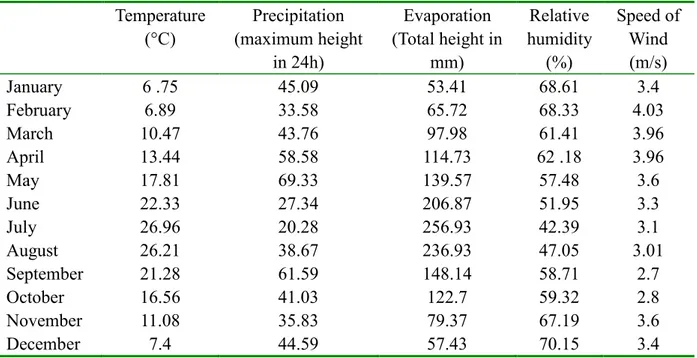
The climate is generally semi-arid with a cold and humid season from October to May and a warm and dry season from June to September and with variations according to altitude and exposure.
Table (1) gives information on the climatic factors of Khenchela spread over a period of twelve years (2002 to 2013).
According to BNEF [18], the study area contains, in order of importance, cedar, Aleppo pine, Green Oak and Juniper. The major part of the forest is in an advanced state of degradation caused by different human interventions or natural phenomena. The maquis dominated by green oak occupy an area of 15 254.24 ha, In addition to the cedar and pine forest of the region, at the edge, a shrub stratum is individualized into a veritable mantle well represented by xerophilic and calcicolous species.
Table 1. Mean weather data for Khenchela weather station for the period 2002 to 2013 Temperature (°C) Precipitation (maximum height in 24h) Evaporation (Total height in mm) Relative humidity (%) Speed of Wind (m/s) January 6 .75 45.09 53.41 68.61 3.4 February 6.89 33.58 65.72 68.33 4.03 March 10.47 43.76 97.98 61.41 3.96 April 13.44 58.58 114.73 62 .18 3.96 May 17.81 69.33 139.57 57.48 3.6 June 22.33 27.34 206.87 51.95 3.3 July 26.96 20.28 256.93 42.39 3.1 August 26.21 38.67 236.93 47.05 3.01 September 21.28 61.59 148.14 58.71 2.7 October 16.56 41.03 122.7 59.32 2.8 November 11.08 35.83 79.37 67.19 3.6 December 7.4 44.59 57.43 70.15 3.4
(Weather Station, Khenchela)
2.2. Sampling of earthworms
In the literature, many methods of sampling earthworms have been developed to optimize the extraction of earthworms; Manual sorting of a soil block, washing, sieving, electrical method, heat extraction, chemical methods and coupled methods.
For our work, earthworms are extracted by the manual sorting method of a block of 1m x 1m x 0.5m, for several reasons (i) manual sorting is the simplest method (ii) does not require chemical substances.
Before choosing the sites of study we have prospected the forest to find the regions populated by earthworms. Several sites were prospected and we chose to work in the wadi zarif area because it is the only one of the prospected sites where we found earthworms.
In the wadi zarif area we chose three sites. The choice of these is based on the altitude (Fig. 1) and we performed four replicates in each site, giving a total of 12 sampling points.
The sorting of the sampled soil is carried out directly after digging and we counted the number of earthworms and then retained them in 96% ethanol.
2.3. Biodiversity index
The diversity of earthworm species was determined for each site (according to altitude) by the Shannon diversity index (H '= - Σlni = pi ln pi), Piélou index: (J' =H '/ H'max), Simpson index
(Is = 1 / (Σ Pi2) and Hill index (Hill = ((1 / Is) / eH').
Fig.1. Earthworm Sampling Device
3. RESULTS AND DISCUSSION
The global characterization of the earthworms is assessed in terms of statistical descriptors (S richness, Abundance) and biodiversity index (Shannon index: H ', Piélou index: J, Simpson index: Is and Hill index)
3.1. Statistical descriptors 3.1.1. Total abundance
Abundance was expressed as the total number of individuals per square meter. In our work we counted a total of forty nine (49) individuals.
The results show that the two sites of 1400 and 1550 m of altitude are the most colonized by the worm populations (23 worms) whereas the site at 1500 m of altitude was marked by the lowest density (3 worms) (Fig.2). A maximum of 11 ind / m2 agrees with the results of Cluzeau [11], which indicate an abundance of: 20 to 100 ind. /m2 in vineyard soils, 20 to 150 ind. /m2 in the soils of the growing plots, 60 to 300 ind. /m2 in grassland soils and 10 to 50 ind / m2 in forests. Omodeo et al. [14] estimate that biodiversity is low throughout Maghreb territory (Morocco, Algeria and Tunisia). As a result of the low density recorded in our work with an average of 4.08 ind / m2, these low values may be due to the nature of soil and the climate, as Edwards and Bohlen [3] point out. As well as the presence of predators, this Altitudes Répétitions 1550m R01 R02 R03 R04 1500m R01 R02 R03 R04 1400m R01 R02 R03 R04 6m 6m 6m 6m
average density remains very far from those found by Bazri et al. [13] which indicate that in the semi-arid stage the density is 9.93 ± 5.94 individuals / m2 and is more or less high in the mountain area of semi-arid with an average of 15 individuals / m2.
Fig.2. Average earthworm abundance at the three sites 3.1.2. Specific richness and relative abundance
Three species were identified in a total of 49 worms, represented by two ecological categories, including two endogeics species and one anecics. These include Octodrilus complanatus (anecic species), Allolobophora molleri (endogeic species) and Aporrectodea rosea (endogeic species). The relation between these species and the altitude shows that the specific richness is higher in the site of 1400 m of altitude where we counted the three species, while for the other two sites two species were counted (fig. 3).
Octodrilus complanatus is an omnipresent worm in the three sites and most abundant with a relative abundance of 57.14%, followed by Aporrectodea rosea (38.77%).
Fig.3. Relative abundance of earthworms in the three sites (Oct : Octodrilus complanatus, Appo : Aporrectodea rosea et Allo : Allolobophora molleri).
3.2. Biodiversity index
Estimation of species richness based on sampling data has a long history in the various disciplines [19]. Measurement and assessment of biological diversity is an active research area of ecology [20], According to Chao et al., [21] quantifying and assessing changes in biological diversity are central to many ecological studies, however, exact methods for estimating the biological diversity of sampling data are difficult to achieve. In this study to refine the analysis of the specific diversity we opted for the use of the indices most commonly used in ecology. The results for the biodiversity index are shown in Table (2). We find that the values of the Simpson index (Is) vary between 0.44 and 0.49 for the three sites.
Macron, [22], indicates that the Simpson index is comprised in the interval [0; 1 [and its value decreases with the regularity of the distribution.
We thus find (Tab.2) that the Simpson index of site II is the weakest and close to that of site (I ) yet seven times richer in individuals.
The Shannon index fluctuates between 0.41 and 0.74, which means that the site of 1400 m of altitude is the richest in species because generally this index evaluates the diversity at the level of a site. Although the number of individuals is equal in the two sites of 1400 m and 1550 m but a difference between the two sites is perceived (0.74 against 0.68), this is due as indicated legendre and legendre [23], to the fact that the Shannon index increases with the number of species.
The Shannon index is accompanied by the equitability index J 'de Piélou. This is how abundance is distributed among species [24]. This index is at the top when the species have identical abundances in the stand and at the bottom when a single species dominates the entire stand [25]. This explains the low evenness value for the 1500 m altitude site and the maximum value (0.99) for the 1550 m altitude site characterized by two species with fairly fair abundance. The evenness is insensitive to the specific richness is very useful to compare the potential dominances between stations or between dates of sampling [25]. The Hill Index values range from 1 to 1.5 in the three sites. This index provides an accurate view of the diversity of sites, as it incorporates the other two indices of Shannon and Simpson [25]. Based on this index, the results shown in Table (2) show that the two sites at 1400 m and 1550 m are the most diverse as they have the largest number of species.
Table 2. Biodiversity indices (S: species richness, N: number of species, Is: Simpson index, H ': Shannon index, J': piélou equitability index, Hill index
S N Is H' J' Hill index
Site I : 1400 m 3 23 0,45 0,74 0,67 1,07
Site II : 1500 m 2 3 0,44 0,41 0,59 1,50
Site III : 1550 m 2 23 0,49 0,68 0,99 1,03
4. CONCLUSION
The present study is a contribution to the ecological study of earthworms in a forest ecosystem in a semi-arid region. The results show that this forest ecosystem has a low abundance and diversity of the earthworm's population and that the latter have no relation with altitude. The very low density in earthworms at 1500m altitude can be due to the presence of predator at this altitude.
5. ACKNOWLEDGMENTS
We would like to thank all the people who contributed to this work: Mr. Kellil (Forest conservation khenchela), Dr. Bazri and Dr. Medfouni
6. REFERENCES
[1] Bourguignon C. et Bourguignon L. Le sol, la terre et les champs. Pour retrouver une agriculture saine. Ed Sang de la terre, 2008, 223 pages. ISBN 978-2-86985-188-7
[2] Bachelier G., La faune des sols, son écologie et son action, IDT N°38. ORSTOM, Paris, 1978, 391 pages.
[3] Edwards, C. A. and Bohlen, P. J. Biology and Ecoloy of Earthworms 3rd ed. Chapman and Hall, London, 1996, 426 pages.
[4] Lavelle, P. and Spain, A. V.,. Soil Ecology. Kluwer Scientific Publications, Amsterdam, 2001, 654 pages.
[5] Edwards C.A. Earthworm ecology (2nd edition). CRC Press, Boca Raton, FL, 2004, 440
pages.
Robertson, G. P. Diversity and abundance of earthworms across an agricultural land-use intensity gradient. Soil and Tillage Research, 2008, pp: 83-88.
[7] Bhadauria T. and Saxena K. G. Role of Earthworms in Soil Fertility Maintenance through the Production of Biogenic Structures, 2010, doi:10.1155/2010/816073.
[8] Hutha V. The role of soil fauna in ecosystems: Ahortical review. Pedobiologia 50, 2007, pp: 489-495.
[9] Lemtiri A., Colinet G., Alabi T., Cluzeau D., Zirbes L., Haubruge É., Francis F. Impacts of earthworms on soil components and dynamics A review. Biotechnol. Agron. Soc. Environ. 2014, 18(1), pp : 121-133.
[10] Hallaire V et Lamandé M. Structure et perméabilité des sols en contexte agricole armoricain : quels indicateurs de la qualité physique des sols ? In : « Caractérisation, déterminisme et surveillance de la qualité des sols en milieu limoneux acide » (C. Walter, R. Chaussod, D. Cluzeau, P. Curmi, V. Hallaire, éditeurs). Rapport final du programme GESSOL n° 99126, INRA Rennes, 2002, pp : 29-57.
[11] Cluzeau D. Mieux connaitre les vers de terre. Guide explicatif, 2012, 4 pages. http://ecobiosoil.univ.rennes1.fr
[12] Decaëns T., Porco D., Rougerie R., Brown G.G and James S.W. Potential of DNA barcoding for earthworm research in taxonomy and ecology. Applied Soil Ecology 65, 2013, pp: 35-42.
[13] Bazri K., Ouahrani G., Gheribi-aoulmi Z., Díaz Cosín D.J. La diversité des lombriciens dans l’Est algérien depuis la côte jusqu’au désert ; Ecologia Mediterranea – Vol. 39 (2), 2013, 13 pages.
[14] Omodeo P., Rota E. & Baha M. The megadrile fauna (Annelida: Oligochaeta) of Maghreb: a biogeographical and ecological characterization. Pedobiologia 47, 2003, pp: 458-465.
[15] Baha M. The earthworm fauna of Mitidja, Algeria. Trop. Zool. 10, 1997, pp : 247-254. [16] Ouahrani G., Lombritechniques appliquées aux évaluations et aux solutions environnementales. Thèse de doctorat d’État. Université Mentouri, 2003, 230 pages.
[17] Decaëns T. Macro ecological patterns in soil communities. Global Ecol. Biogeogr. 19, 3, 2010, pp: 287-302.
[18] BNEF. Plan d’aménagement de la zône des Ouled Yakoub et des Béni-Oudjana (40.000 ha). Ministère de l’Hydraulique de l’Environnement et des Forêts. RADP., 1984, 62 pages. [19] Chao A. and Chiu C. H. Species richness: estimation and comparison. Wiley StatsRef: Statistics Reference Online, 2016, pp: 1-26.
[20] Magurran A. E. and B. J. McGill. Biological diversity: frontiers in measurement and assessment. Oxford University Press, Oxford, UK, 2011.
[21] Chao A., Nicholas J., Gotelli T., Hsieh C., Elizabeth l., Sander K. H., Ma, R, Colwell K., And Ellison A M. Rarefaction and extrapolation with Hill numbers: a framework for sampling and estimation in species diversity studies. Ecological Monographs, 84(1), 2014, pp: 45-67, 2014 by the Ecological Society of America.
[22] Marcon E. Mesures de la Biodiversit. Master. Kourou, France, 2015. <cel-01205813v3>
[23] Legendre P. and Legendre L. Numerical Ecology SECOND ENGLISH EDITION Ed.Elsevier science, 1998, 853 pages.
[24] Soudant D. et Belin C. Note sur l’approche statistique de la diversité en écologie. Application à l’indice composition pour le phytoplancton, 2011, 21 pages.
[25] Grall J. et Hily C. Traitement des données stationnelles (faune). FT-10-2003-01. doc, 2003, 10 Pages.
How to cite this article:
Ababsa N, Laiche A, DjabbarF. Abundance and species richness of lombric macrofauna in a