HAL Id: hal-01126409
https://hal.archives-ouvertes.fr/hal-01126409
Submitted on 9 Apr 2020HAL is a multi-disciplinary open access archive for the deposit and dissemination of sci-entific research documents, whether they are pub-lished or not. The documents may come from teaching and research institutions in France or abroad, or from public or private research centers.
L’archive ouverte pluridisciplinaire HAL, est destinée au dépôt et à la diffusion de documents scientifiques de niveau recherche, publiés ou non, émanant des établissements d’enseignement et de recherche français ou étrangers, des laboratoires publics ou privés.
Historical Elements of Correspondence Analysis and
Multiple Correspondence Analysis
Ludovic Lebart, Gilbert Saporta
To cite this version:
Ludovic Lebart, Gilbert Saporta. Historical Elements of Correspondence Analysis and Multiple Cor-respondence Analysis. Jorg Blasius, Michael Greenacre. Visualization and Verbalization of Data, Chapman and Hall/CRC, pp.31-44, 2014, 9781466589803. �hal-01126409�
1
Draft of chapter 3 of the Book: Visualization and Verbalization of Data. Blasius J. and Greenacre M. Editor (2014). CRC Press/Chapman and Hall, N.Y.
Chapter 3:
Historical Elements of Correspondence Analysis and
Multiple Correspondence Analysis
Ludovic Lebart and Gilbert Saporta
The use of visual displays as an exploratory tool in the 1960s is probably one of the distinctive features of correspondence analysis (CA) compared to other techniques, and the explanation of its success. Once the usefulness of a technique has been established, it is always easy to find afterwards pioneering works, and it is now well known that the equations of CA have been found many years before, based on quite different motivations. Multiple correspondence analysis (MCA) can be considered as a mere variant of CA, since its history is inseparable from that of CA. Its present name dates back to the beginning of the nineteen seventies, but its history also goes back much further in the past. The dissemination of these techniques is contemporary, and an active component, of the upsurge of exploratory multivariate data analysis that followed the year 1965, notably under the name “analyse des
données” in some francophone countries. We focus here on works prior to 1980. The history
of both CA and MCA together with the simultaneous revival of induction in statistics will be a pretext to evoke “the giants on whose shoulders we are standing”.
The history of CA and MCA and the simultaneous revival of induction in statistics will be a pretext to evoke “the giants on whose shoulders we are standing”.
3.1 Simple correspondence analysis
The simple form of CA is a particular way of analyzing contingency tables by means of visualizing jointly rows and columns in a low-dimensional space. Let us exemplify that aspect of CA by considering the cross-classification of eye and hair colours of Scottish children used by Fisher (1940) in his pioneering paper about the precision of discriminant functions (Table 3.1). This example is given as a mere illustration and is by no means a technical reminder.
Table 3.1: Fisher-Maung (historical) data about hair and eye colours. Hair Color H_Fair H_Red H_Medium H_Dark H_Black Total Eye Color E_Blue 326 38 241 110 3 718 E_Light 688 116 584 188 4 1580 E_Medium 343 84 909 412 26 1774 E_Dark 98 48 403 681 85 1315 Total 1455 286 2137 1391 118 5387
2
Think about the four eye-colour profiles, i.e., vectors of proportions summing to 1, as four points in a three-dimensional space (since four points lie in a three-dimensional space) and the five hair-colour profiles as five points also in a three-dimensional space (they have four coordinates that sum up to 1). CA consists of two simultaneous weighted PCAs of row and column profiles, using the chi-squared distances in each space, the weights being the marginal frequencies (see the chapter from Cazes in this book).
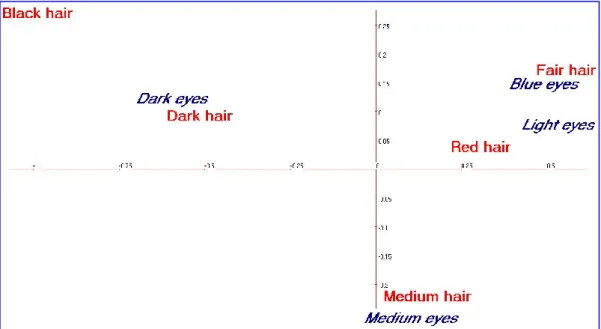
Both PCAs give the same eigenvalues. Each principal component of the PCA of row profiles is proportional to the vector associated with the same eigenvalue, containing the loadings derived from the PCA of the column profiles, and vice versa. Like in usual PCA, components have variances, or weighted mean squares, equal to the eigenvalue, while the loadings have a weighted mean-square equal to 1. Figure 3.1 is one of the possible displays of simultaneous representation of the rows and columns of Table 3.1 through simple CA, called the symmetric map, where both row and column points have inertias equal to the respective eigenvalues. As shown by the eigenvalues (Table 3.2), the first (horizontal) axis is markedly dominant. We may discard the third eigenvalue, the planar representation will be reliable.
Figure 3.1: Sketch of the superimposed graphical displays of the row-point and of the column-points of Table 3.1.
Table 3.2: The corresponding eigenvalues Axis number Eigen percent. cumulat.
value percent.
1 .1992 86.56 86.56
2 .0301 13.07 99.63
3 .0009 .37 100.00
The first axis ranks the categories from the darkest to the lightest colours. Each point (row or column) is the centroid of individuals possessing the corresponding category. Hair-medium and eye-medium are close and children with dark eyes are close to children with dark hair
3
(see Table 3.1). It does not mean that all children with dark hair have dark eyes. The second axis, which isolates the two “medium” categories, shows the so-called “arch” or “Guttman effect”.
Note that this use of CA as a tool of descriptive statistics is very far from the concerns of Fisher and his contemporary. We may distinguish two tracks or sources in the history of CA, both developed in the 1930’s: one is the quantification point of view, the other the reciprocal averaging approach.
Optimal scaling or quantification of categorical variables
Assigning “optimal” scores to rows and columns categories of a contingency table has been studied very early. De Leeuw (1983) traces back to Karl Pearson (1906) the idea of looking at such scoring as transformations that linearize regressions. This problem was solved later by Hermann Otto Hirschfeld (1935), better known under his subsequently anglicized name of H.O. Hartley. He obtained the eigen-equations of CA when solving the following question (Hirschfield, 1935, p 520): “Given a discontinuous bivariate distribution, is it always possible to introduce new values for the variates x, y such that both regressions are linear?” Hirschfeld showed that for the two-variable case with n and m categories, there are min(n,m)–1 solutions (the dimensions of CA). The new values, or scores, are nothing else than row and column coordinates in CA up to some standardization. Hirschfeld proved that the sum of eigenvalues was equal to Pearson’s mean-square contingency coefficient, usually denoted by 2, which is identical to the familiar Pearson’s chi-squared statistic for a two-way contingency table, divided by the total of the table.
Fisher (1940) obtained CA equations when generalizing discriminant analysis to a single categorical predictor. His question was how to give scores to columns in order to discriminate as best as possible between row categories. He used an iterative technique similar to reciprocal averaging in order to find the optimal scores and applied it to the cross-classification of eye and hair colours of Table 3.1. Note that Fisher was interested only in the optimum, i.e. the first dimension of CA. Apart from a sign inversion, his solution is equal to the standardized coordinates of the seven categories on the first axis (Figure 3.1).
Maung (1941) related Fisher’s result to Hotelling’s canonical correlation analysis by proving that Fisher’s system of scores maximizes the correlation coefficient between the quantified variables. A reconstruction formula, attributed to Fisher, is presented without proof. Surprisingly, neither Fisher nor Maung refer to Hirschfeld. One can find later developments in Williams (1952) with chi-squared tests for the significance of eigenvalues. Chapter 33 of the famous treatise by Kendall and Stuart (1962) was devoted to “canonical analysis of contingency tables”, again CA in different terminology. Note that in this chapter the derivation of the distribution of the eigenvalues is flawed, as proved by Lancaster (1963). The theory of optimal scaling culminated with several papers published in Psychometrika by Young, Takane, and de Leeuw in the 1970’s and de Leeuw’s dissertation (1973, reprinted in 1984). The contributions of the Dutch school of data analysis were gathered in the book of Gifi (1990).
Reciprocal averaging
In a short article, Horst (1935) coined the name of “method of reciprocal averaging” for an algorithm proposed two years earlier by Richardson and Kuder (1933). Richardson and Kuder aimed to achieve a better selection of salesmen for the company Procter and Gamble, and empirically discovered the method of “reciprocal averaging”. Basically this algorithm consists in assigning arbitrary scores to the columns of a contingency tables (or to the rows, if
4
preferred), then computing the weighted averages, or “barycentres”, for the rows (row scores), then computing new column scores as weighted averages etc. After each cycle the scores need to be standardized to avoid collapsing towards zero. After convergence and standardization, rows and columns scores are identical to rows and columns coordinates along the first principal axis of CA, the axis associated with the largest eigenvalue. In his note, Horst, who did not use any mathematical formula, indicates an identity with Hotelling’s equations, but actually those of principal components, not of canonical analysis.
The idea that on some scale, rows are represented as weighted barycenters of columns (and vice versa, if possible) is familiar to ecologists under the name of “ordination”. Legendre and Legendre (1998, p.387) say that ordination “consists in plotting object-points along an axis representing an ordered relationship, or forming a scatter diagram with two or more axes”. It is worth noticing that ecologists were interested in graphical displays, which was not the common case in the optimal scoring framework. However, the “arch” or “Guttman effect”, which occurs when a single numeric latent variable is present or dominant, has been considered as a drawback by many ecologists. In this case higher order factors are polynomial functions of the first factor, which may not bring useful information. This leads to the development of detrended correspondence analysis in the 1980s by Hill et al. (1980).
Among other works related to CA and ordination let us cite ter Braak’s canonical correspondence analysis (1986), where the ordination axes are constrained to be linear combinations of external variables (see also ter Braak’s chapter in this book).
The reciprocal averaging property was extensively used by Nishisato under the name of “dual scaling” (1980, 2007). Nishisato proposed this name to avoid choosing between many others since CA had been rediscovered many times. The name is related to the duality property, characterized by symmetric relations between row and column scores. The principle consists in maximizing the correlation ratio between the quantification of the variable associated to row categories with the categorical variable associated to column categories, and vice-versa: dual scaling of a contingency table is then equivalent to CA, and dual scaling of a disjunctive table is equivalent to MCA.
The geometric approach
CA was presented and developed under the French name analyse des correspondances for the first time by Escofier-Cordier (1965) and Benzécri (1969). The founders of CA stressed a geometric and algebraic point of view that enables a simultaneous visual display of rows and columns of a contingency table. Here they are both sets of weighted points in a Euclidean space and CA consists in projecting these points on a low-dimensional subspace in the same spirit as the presentation of principal component analysis (PCA) by Pearson (1901), but not by Hotelling. The use of the chi-squared metric ensures the coherence between the PCA of weighted row-profiles and the PCA of weighted column-profiles. The concept of inertia is highlighted and the total inertia is equal to Pearson’s 2 (see the chapter by Cazes, this book)
CA was applied in Benzécri’s laboratory to a great number of fields and was adopted by many French researchers. However, the dissemination out of the French-speaking community was limited until the publication of the books by Greenacre (1984) and Lebart, Morineau and Warwick (1984) popularized the method. Nevertheless, it took some time for correspondence analysis to be accepted as the standard name for the method, which was facilitated by the availability of software in commercial packages such as SAS, SPSS and Stata.
CA may also be presented as an example of Gabriel’s (1971) biplot for contingency tables (Gower and Hand, 1996; Greenacre, 2010), where rows, for example, depict vectors of
5
relative frequencies, called profiles in CA, in a space structured by the chi-squared metric, and columns describe biplot axes onto which the row points can be projected.
CA as a discretization of a continuous bivariate distribution
When a contingency table is obtained by discretization of an underlying bivariate continuous distribution f(x,y), the problem arises to study the behaviour of the solution as the partitions of the two variables are refined, when the CA scores asymptotically tend to continuous functions of x and y. Hirschfeld (1935, p 524) wrote that the squared canonical correlation between transformed discrete variables “could be defined for continuous distributions as well. However the complexity of its construction makes its practical use nearly impossible”.
Lancaster (1958, 1969) solved the general problem of canonical analysis of a bivariate distribution establishing a general reconstruction formula for the ratio of the bivariate density divided by the product of the marginal densities. This ratio may be expanded as a sum of products of canonical variables that are two complete sets of orthonormal functions defined on the margins. He also proved the convergence of canonical analysis of contingency tables (i.e., CA) towards the theoretical continuous solution, but concluded that “there is no general method for determining the canonical variates in the distributions on infinitely many points in both variables”. However, for some distributions the solution is known: Hermite polynomials in the case of the bivariate normal distribution, Laguerre polynomials for the bivariate gamma distribution. Naouri (1971) studied the Fredholm integral equations giving the canonical variates, and gave several examples. Since that, there have been few publications on continuous correspondence analysis (for example, Cuadras et al., 1999).
3.2 Multiple correspondence analysis
Among several possible presentation, multiple correspondence analysis (MCA) can be viewed as a simple extension of the area of applicability of correspondence analysis (CA), from the case of a contingency table to the case of a “complete disjunctive binary table”, also called an “indicator matrix”. The properties of such a table are interesting, the computational procedures and the rules of interpretation of the obtained representations are simple, albeit specific. MCA can emerge as both a particular case and a generalization of CA, it is not easy to disentangle its history from that of CA. We use the same historical data set to exemplify the link existing between CA and MCA, in the particular case of a two-way table.
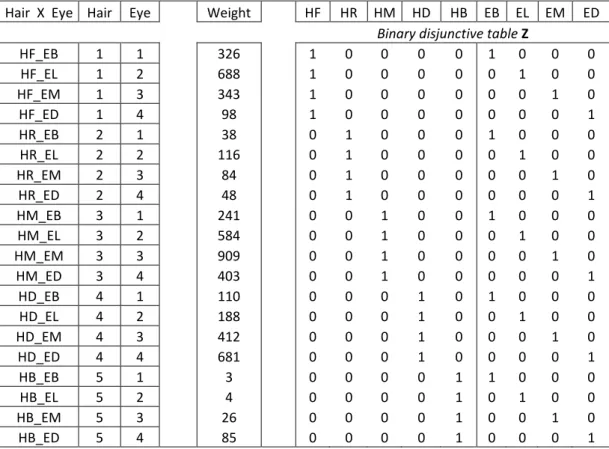
In Table 3.3, the first column contains intuitive identifiers of each cell. Columns two and three contain the addresses of each cell, whereas the fourth column (“weights”) contains the frequencies of the corresponding cell. The remaining of the table is the binary disjunctive matrix, made up of two blocks that constitute respectively a coding of both columns two and three.
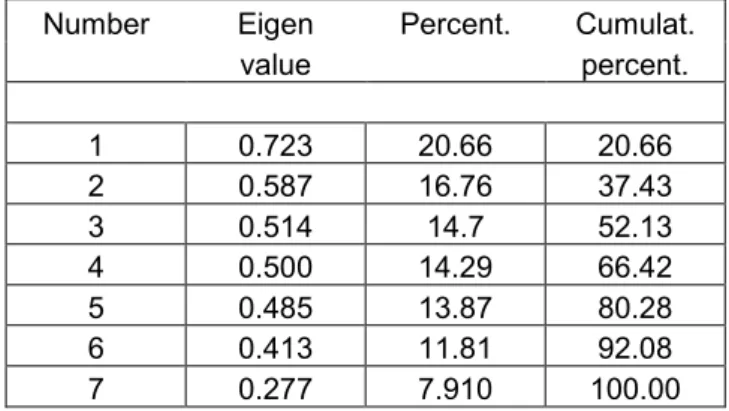
The CA of the contingency table (Table 3.1), the CA of the weighted binary disjunctive table (Table 3.3), and the CA of the Burt matrix (Table 3.4) produce the same eigenvectors with norm 1. However, the eigenvalues from these three CAs are distinct: if is the eigenvalue from the original CA of Table 3.1, from the second CA (Table 3.3), and from the third CA (Table 3.4), we have the relationships between eigenvalues: 1
2
and . The values of are displayed in Table 3.5.
6
Table 3.3: Another presentation of Table 3.1 data, leading to MCA.
Hair X Eye Hair Eye Weight HF HR HM HD HB EB EL EM ED Binary disjunctive table Z
HF_EB 1 1 326 1 0 0 0 0 1 0 0 0 HF_EL 1 2 688 1 0 0 0 0 0 1 0 0 HF_EM 1 3 343 1 0 0 0 0 0 0 1 0 HF_ED 1 4 98 1 0 0 0 0 0 0 0 1 HR_EB 2 1 38 0 1 0 0 0 1 0 0 0 HR_EL 2 2 116 0 1 0 0 0 0 1 0 0 HR_EM 2 3 84 0 1 0 0 0 0 0 1 0 HR_ED 2 4 48 0 1 0 0 0 0 0 0 1 HM_EB 3 1 241 0 0 1 0 0 1 0 0 0 HM_EL 3 2 584 0 0 1 0 0 0 1 0 0 HM_EM 3 3 909 0 0 1 0 0 0 0 1 0 HM_ED 3 4 403 0 0 1 0 0 0 0 0 1 HD_EB 4 1 110 0 0 0 1 0 1 0 0 0 HD_EL 4 2 188 0 0 0 1 0 0 1 0 0 HD_EM 4 3 412 0 0 0 1 0 0 0 1 0 HD_ED 4 4 681 0 0 0 1 0 0 0 0 1 HB_EB 5 1 3 0 0 0 0 1 1 0 0 0 HB_EL 5 2 4 0 0 0 0 1 0 1 0 0 HB_EM 5 3 26 0 0 0 0 1 0 0 1 0 HB_ED 5 4 85 0 0 0 0 1 0 0 0 1
Table 3.4: Burt matrix B, product of the above binary table Z by its transpose. Note that the original contingency table and its transpose are the off-diagonal blocks.
1455 0 0 0 0 326 688 343 98 0 286 0 0 0 38 116 84 48 0 0 2137 0 0 241 584 909 403 0 0 0 1391 0 110 188 412 681 0 0 0 0 118 3 4 26 85 326 38 241 110 3 718 0 0 0 688 116 584 188 4 0 1580 0 0 343 84 909 412 26 0 0 1774 0 98 48 403 681 85 0 0 0 1315
Unlike the original table 3.1, the tables Z and B can be easily generalised to more than two blocks (or questions, variables), leading then to the general framework of MCA. A vast domain of applications is then opened (socio-economic surveys, and more generally, all kinds of research questions involving numerous categorical variables...).
7
Table 3.5: Eigenvalues from the MCA of the weighted binary disjunctive table Z. Number Eigen Percent. Cumulat.
value percent. 1 0.723 20.66 20.66 2 0.587 16.76 37.43 3 0.514 14.7 52.13 4 0.500 14.29 66.42 5 0.485 13.87 80.28 6 0.413 11.81 92.08 7 0.277 7.910 100.00
First traces of a technology
According to a famous paper of Healy (1978), statistics is more a technology than a science. This terminological choice aptly applies to MCA, a tool characterised more by its usefulness than by its theoretical content and context. The history of a particular technology, because of its involvement with real life, can be fascinating. From this point of view, we can compare, for instance, MCA with the “minimum spanning tree”, a technique as useful in statistics as in operations research. A prominent example is provided by the history of the minimum spanning tree (almost a thriller! See Graham and Hell, 1985).
Preliminary bases
At the foundation of the contemporary presentation of principal axis analyses is a theorem based on the singular values decomposition, that was presented by Eckart and Young (1936) for rectangular matrices and which generalized the works of Cauchy (1830) and Sylvester (1889) (to quote only two noteworthy milestones) concerning square matrices. The problem that is at hand is one of pure numerical reduction, i.e. of data compression: how to fit, in the least-squares sense, a matrix by another matrix of inferior rank. Among the first articles that were published on the algebraic and geometric methods of principal axis methods, we like to note Gower (1966, see also his chapter in this book) and Gabriel (1971).
MCA, like PCA, deals with tables involving individual-level data. PCA is the oldest and most established of the methods of principal axes visualization. Conceived for the first time in a limited (albeit quite modern) setting by Pearson in 1901, and integrated into mathematical statistics by Hotelling in 1933, PCA has not really been used before the arrival and diffusion of computational aids. For the traditional statistician, it is about searching for the principal axes of a multivariate normal distribution from a sample. This is the initial presentation of Hotelling (l933), and later that of classic manuals of multivariate analysis, such as the fundamental treatise by Anderson (1958). It is also a special case of factor analysis (case of null or equal specificities; cf. Horst, 1965). A presentation that is closer to current thinking can be found in the pioneering and synthetic article by Rao (1964).
Multiple correspondence analysis: formulas and methodology
The basic formulas underlying MCA can be traced back to Guttman (1941), who devised it as a method of scaling, but also to Burt (1950), in a wider scope. The paper by Guttman contains, with modern matrix notations, all the formulas that concern and characterize MCA as we know it. It includes a careful description of “binary disjunctive data sets” and mentions the “chi-squared metric”.
8
In his (legitimate) claim (published in the British Journal of Mathematical and Statistical
Psychology, directed by Burt himself) for an acknowledgement of priority addressed to Burt,
Guttman (1953) insists on the limited scope that should be assigned to the method: to derive a
unique scale. After a courteous introduction (page 1) (“It is gratifying to see how Professor
Burt has independently arrived at much the same formulation. This convergence of thinking lends credence to the suitability of the approach.”), Guttman wrote (page 2):”... while the principal components here are formally similar to those for quantitative variables, nevertheless, their interpretation may be quite different”, and, further on (same page): “If a correct, but non-linear prediction technique is used, the whole variation can sometimes be accounted for by but the single component. In such a case, the existence of more than one component arises merely from the fact that a linear system is being used to approximate a non linear one.” Guttman then explains (same page) that the other dimensions will be polynomial functions of the first one, being similar to the solutions “of a second order differential equation classical in physics”.
Note that Benzécri (1973, chapter entitled “Sur l’analyse de la correspondance définie par un graphe”) has defined a “generalized Guttman effect”, linked to the eigenvectors of the Laplace operator, where components of higher order are polynomial functions of the first two components. In fact, Guttman has discovered all the formulas underlying MCA, but was uniquely and perhaps obstinately interested by the prediction of a perfect scale. In his paper of 1953 entitled “Scale analysis and factor analysis (Comments of Dr Guttmann’s paper)” , Burt, while recognising the anteriority of Guttman as regard all the details of the formulas, promotes a more exploratory role for the method, in the vein of the recommendations of Thurstone (1947) in the context of factor analysis. “It is encouraging to find that Dr. Guttman has discerned points of resemblance between the methods we have independently reached for analysing qualitative data; And I willingly agree that this convergence in our lines of approach lends additional plausibility to the results [....] my aim was to factorize such data, his to construct a scale” (Burt, 1953, page 5). The most amazing in these interesting discussions, which involved painstaking calculations by hand on very small numerical examples, is precisely the absence of computers and of real sized experiments.
Note that the response of Burt is cleverly articulated – he was obviously perfectly mastering his own mind at that time. The fact that his reputation has been stained 20 years later about some alleged fraud (see: Hearnshaw, 1979; Gould, 1982; Joynson, 1989; Fletcher, 1991) can be summarized by the sentence, from the Encyclopaedia Britannica: “From the late 1970s it was generally accepted that he had fabricated some of the data, though some of his earlier work remained unaffected by this revelation”.
The first real applications of MCA as an exploratory tool probably date back to Hayashi (1956). The availability of computing facilities entailed a wealth of new developments and applications in the sixties and seventies, notably around Benzécri (1964, 1973). The term “multiple correspondence analysis” was coined at that time.
MCA has been developed in another theoretical framework (closer to the first approach of Guttman) under the name of “homogeneity analysis” by the research team around Jan de Leeuw since 1973 (cf. Gifi, 1981/1990) and under the name of “dual scaling” by Nishisato (1980), the latter more inspired by Hayashi.
The first implementations…
A first internal note by Benzécri proved the equivalence between the analysis proposed by Burt (1950) of the “Burt contingency table” (now called the Burt matrix in MCA, see Table 3.4) relating to two variables and the same CA of the single two-way contingency table.
9
Another note by Benzécri (1972) provided a review of the properties that hold in the case of more than two variables. Lebart and Tabard (1973) presented all these properties, and a complete source code of a Fortran software of MCA, including the diagonalization of a (J –
Q) (J – Q) matrix, instead of a J J matrix, where J = total number of categories, Q =
number of categorical variables. These papers and reports are referred to in Lebart (1974), in which the MCA solution is obtained through a direct diagonalization algorithm involving uniquely the response pattern matrix, i.e. the NQ matrix where N is the number of respondents. This paper is perhaps the first paper in English that contains the name “MCA”. In Lebart (1975), MCA is presented as a technology to drive the methodology of survey data processing: in a first phase, a visualization through MCA of all the basic socio-economic characteristics of the respondents provides a “socio-economic grid” (aka: the “basic frame of the survey”). In a second phase, all the variable constituting the content of the survey are projected (as supplementary variables) onto this grid. In so doing, the researcher obtains at a glance an overview of the main correlations that are usually obtained through a painstaking inspection of numerous cross-tabulations. The book by Lebart et al. (1977) (translated in English seven years later with the kind support of Ken Warwick: Lebart et al., 1984) dealt with all these results and computer programs. MCA was one of the most salient components of the software SPAD that was devised at that time.
Note that like the Bourgeois Gentleman of Molière, who has been speaking prose all his life,
and didn't even know it, some statisticians, such as Nakache (1973), have applied CA to
complete disjunctive tables, and didn’t even know that they were using MCA…
The dissemination of MCA
Descriptive statistical analysis allows us to represent statistical information in a graphical form by simplifying and schematizing it. Multidimensional descriptive statistical analysis generalizes this idea in a natural way when the information concerns several variables or dimensions.
Sample surveys are popular tools in the social sciences, and their questionnaires generally contain a wealth of categorical data. Replacing or complementing the dull arrays of cross-tabulations with suggestive graphical displays has been an undeniable improvement in survey data processing. It is then not a surprise that MCA has been welcome, immediately used, and probably overused during the first years of its dissemination. Emblematic and large-scale applications of CA and MCA in social science are to be found in the works of the sociologist Pierre Bourdieu: “La Distinction” (Bourdieu, 1979) and “Homo Academicus” (Bourdieu, 1984) (see also Blasius and Schmitz, this volume).
One of the innovations in statistics after 1960 was the appearance of techniques in the form of "products": software developed with financial and commercial constraints on their conception, production, and distribution. Like any finalized product, the advantage of the software was its ability to diffuse and its inconvenience that it entailed certain rigidity. Like any product intended to be used by specialists it induced new divisions of labour that were not very desirable in a knowledge process. Software that is accessible and easy to use allow methods to be widely spread but lead to a careless use in areas where much caution would be called for.
MCA and multi-way analyses
In the pioneering papers of Hirschfeld, Fisher and Maung mentioned previously, simple CA was, implicitly or explicitly, considered as a particular case of canonical correlations analysis between two sets of dummy variables (categorical variables coded under binary disjunctive
10
form). It was then natural to devise the extensions of simple correspondence analysis to more than two dimensions through generalized canonical analysis as proposed by various authors, among them: Horst (1961), Carroll (1968), and Kettenring (1971). In this wealth of methods that cannot be described in this chapter, the generalization proposed by Carroll is the closest to MCA as we know it. For p groups of variables (or p blocks X) this generalization consists in obtaining an auxiliary variable z which maximizes 2
1 ( , ) p j j R
z X . When blocks are made of indicator variables of categorical variables Xj, the multiple correlation is equal to thecorrelation ratio : 2( , ) 2( , )
j j
R y X y X .
There is no unique generalization of the theorem of Eckart and Young to the case of three-way tables. This can be expressed in the following three-way: the hierarchical decomposition of an element of the tensor product of two Euclidean spaces into a sum of tensor products of pairs of vectors belonging to each space is unique. But such decomposition is not unique in the case of an element of the tensor product of more than two Euclidean spaces (cf. Benzécri, 1973; Tome 2B, n°6). Therefore, in this case, there cannot be an exploratory approach that is as well established as in the case of two-way tables.
We find a synthesis and a classification of the main approaches to multi-way analysis in the work of Kroonenberg (1983). The first works on this theme were those of Tucker (1964, 1966) followed by those of Harshman (1970) in the context of classic factor analysis. Let us also mention the works of Pagès et al. (1976) based on the operators defined by Robert and Escoufier (1976). Kroonenberg (in this book) gives a complete account of the history of three-way methods.
Stability, validation, resampling
An important issue in MCA is certainly the stability of the results, together with the confidence attached to the location of points in the principal subspaces. From a purely numerical point of view, Escofier and Le Roux (1976), and Escofier (1979) have treated the stability of the axes in principal axes analysis (PCA and CA). These authors study the maximal variations of the eigenvectors and the eigenvalues when well defined modifications alter the data: removal or addition of elements to the data tables, the influence of regrouping several elements or small modifications of the values in the table, the influence of the chosen distances and weightings. The study of the validity of the results of dimension-reducing techniques has lead to much research, but which has since the 1980s taken a different direction with “computer intensive methods” such as bootstrapping.
The bootstrap, a particular simulation technique introduced by Efron (1979), consists in simulating samples of the same size as the initial sample. With the exception of the works of Gifi (1981/1990) that specifically concern correspondence analysis (in fact the bootstrap principle differs significantly according to the various principal axes techniques), one of the first works where bootstrap is applied to validate results of PCA is probably that of Diaconis and Efron (1983). Meulman (1982) introduced bootstrapping in the Homogeneity Analysis framework, which is another presentation of MCA. She performed a new CA for each bootstrap sample. Independently, Greenacre (1984) used what we later called the “partial bootstrap”, this is when the initial configuration is fixed and the bootstrap samples are added as supplementary points.
Some related methods
11
brought to the practice of MCA. Saporta (1977) proposed a technique of discrimination from a set of qualitative variables (DISQUAL) based on the principal axes extracted from a preliminary MCA. Cazes (1977, 1980) has studied the properties of the CA of sub-tables of a Burt contingency table. The technique of supplementary elements, proposed earlier by Gower in another framework (1968), has been thoroughly investigated with all its possible variants by Cazes (1977). A note by Benzécri (1979) gave a procedure to remedy the poorly significant percentages of variances provided by MCA. Escofier (1979a, 1979b) proposed variants of MCA allowing for processing (or representing as supplementary elements) both categorical and numerical variables.
As a conclusion…
It is certainly presumptuous to attempt to write the history of a technology without a certain perspective. We have tried as much as possible to restrict ourselves to works prior to 1980, but both the context and the complexity of discoveries are such that we had to mention some more recent contributions that may either reveal some past results or summarize scattered methods. We have encountered a series of ideas, formulas, and techniques, translated later into methodologies, textbooks and software. The process of discovery is by no means sequential, and to specify, for example, a date of birth is always difficult, sometimes almost meaningless. The endeavour to briefly clarify the genesis of CA and MCA will remain, as expected, a personal point of view. However, the fascination towards our methodological ancestors deserved to be communicated. For other historical references about the history of CA, see: Benzécri (1982), de Leeuw (1983), Tenenhaus and Young (1985), Nishisato (2007, chapter 3), Armatte (2008) , Beh and Lombardo (2012).
References
Anderson T.W. (1958): An Introduction to Multivariate Statistical Analysis (Second edition : 1984). J. Wiley, New York.
Armatte, M. (2008) : Histoire et Préhistoire de l'Analyse des données par J.P. Benzécri : un cas de généalogie rétrospective, Electronic Journal for History of probability and Statistics, 4,2
Beh, E. J. and Lombardo, R. (2012): A genealogy of correspondence analysis. Australian & New Zealand Journal of Statistics, 54: 137–168.
Benzecri J.-P. (1964): Cours de Linguistique mathématique, Faculté des Sciences de Rennes. Benzécri J.-P. (1969): Statistical analysis as a tool to make patterns emerge from clouds. In :
Methodology of Pattern Recognition (S.Watanabe, Ed.) Academic Press, 35-74.
Benzécri J.-P. (1972): Sur l’analyse des tableaux binaires associés à une correspondance multiple. Publication of the Laboratoire de Statistique Mathématique, Université Pierre et Marie Curie. Benzécri J.-P. (1973): L'Analyse des Données. Tome 1: La Taxinomie. Tome 2: L'Analyse des
Correspondances (2nd. éd. 1976). Dunod, Paris.
Benzécri J.-P. (1979): Sur le calcul des taux d'inertie dans l'analyse d'un questionnaire. Cahiers de l'Analyse des Données, 3, 377-378 .
Benzécri J.-P. (1982): Histoire et préhistoire de l'analyse des données. Dunod, Paris.
Bourdieu P. (1979): La Distinction. Critique sociale du jugement. Les Editions de Minuit. Paris. Burt C. (1950): The factorial analysis of qualitative data. British J. of Statist. Psychol. 3, 3, 166-185. Burt C. (1953): Scale Analysis and factor analysis. Comments on Dr Guttman paper. British J. of
Statist. psychol. 6, 5-20.
Carroll J. D. (1968): Generalization of canonical correlation to three or more sets of variables. Proc. Amer. Psychological Assoc. 227-228.
12
Cauchy, A. L. (1830): Mémoire sur l’équation qui a pour racines les moments d’inertie principaux d’un corps solide et sur diverses équations du même genre. Mémoires de l'Académie des sciences, t. IX, 111 (presented in 1826);
Cazes P. (1977): Etude des propriétés extrêmales des sous-facteurs issus d'un sous-tableau d'un tableau de Burt. Les Cahiers de l'Analyse des Données, 2, 143-160.
Cazes P. (1980): Analyse de certains tableaux rectangulaires décomposés en blocs. Les Cahiers de l'Analyse des Données, 5, 145-161, et 387-403.
Cazes P. (1977) : (collection of notes published in 1982): Note sur les éléments supplémentaires en analyse des correspondances. Les Cahiers de l'Analyse des Données, 1, 9-23; 2, 133-154.
Cuadras, C.M., Fortiana, J., Greenacre, M.J. (1999): Continuous Extensions of Matrix Formulations in Correspondence Analysis, with Applications to the FGM Family of Distributions. In: Innovations in Multivariate Statistical Analysis, R.D.H. Heijmans, D.S.G. Pollock and A. Satorra eds., Kluwer Ac. Publ., Dordrecht, 101-116.
de Leeuw, J. (1973): Canonical analysis of contingency tables, Ph.D., Leiden University, reprinted (1984) DSWO. Leiden.
de Leeuw, J. (1983): On the Prehistory of Correspondence Analysis, Statistica Neerlandica, 37 , 161– 164.
de Leeuw, J., Young, F. W., and Takane, Y. (1976): Additive structure in qualitative data: An alternating least squares method with optimal scaling features. Psychometrika, 41, 471-504. Diaconis P., Efron B. (1983): Computer intensive methods in statistics. Scientific American, 248,
(May), 116-130.
Eckart C., Young G. (1936): The approximation of one matrix by another of lower rank. Psychometrika, l, 211-218.
Efron B. (1979): Bootstrap methods : another look at the Jackknife. Ann. Statist., 7, 1-26.
Escofier B. (1979 a): Traitement simultané de variables qualitatives et quantitatives. Les Cahiers de l'Analyse des Données, 4, (2), 137-146.
Escofier B. (1979 b): Une représentation des variables dans l'analyse des correspondances multiples. Revue de Statist. Appl. , 27, 37-47.
Escofier B. [Cordier B.] (1965): l'Analyse des correspondances. Thèse, Faculté des Sciences de Rennes ; publiée en 1969 dans les Cahiers du Bureau Universitaire de Recherche Opérationnelle, n°13.
Escofier B., Le Roux B. (1976): Influence d’un élément sur les facteurs en analyse des correspondances. Les Cahiers de l'Analyse des Données, 3, 297-318.
Fisher R.A. (1940): The precision of discriminant functions. Ann. Eugen., 10, 422-429.
Fletcher, R. (1991): Science, Ideology and the Media: The Cyril Burt Scandal. New Brunswick, USA: Transaction Publishers.
Gabriel K.R. (1971): The biplot graphic display of matrices with application to principal component analysis. Biometrika, 58, 3, 453-467.
Gifi A. (1981): Non Linear Multivariate Analysis, Department of Data theory, University of Leiden. [and: Gifi A. (1990): Non Linear Multivariate Analysis, J. Wiley, Chichester.] (book recapitulating works done before 1980).
Gould S.J. (1983): The real error of Cyril Burt. In: The Mismeasure of Man. W.W. Norton and Company, New York. Chapter 6, 234-320.
Gower J. C. (1966): Some distance properties of latent and vector methods used in multivariate analysis. Biometrika, 53, 325-328.
Gower J. C. (1968): Adding a point to vector diagram in multivariate analysis. Biometrika, 55, 582-585.
13
Gower J.C. (2008): The biological stimulus to multidimensional data analysis. Electronic Journal for History of probability and Statistics : JEHPS. December 2008, vol 4, n°2. (www.jehps.net). Graham R. L. and Hell P. (1985): On the history of the minimum spanning tree problem. Annals.
History of Comput. 7, 43-57.
Greenacre, M. (1984): Theory and Applications of Correspondence Analysis. Academic Press. Guttman L. (1941): The quantification of a class of attributes: a theory and method of a scale
construction. In : The prediction of personal adjustment (Horst P., ed.) 251 -264, SSCR New York.
Guttman L. (1953): A note on Sir Cyril Burt’s Factorial Analysis of Qualitative Data, British J. of Statist. psychol. 6, 1-4.
Guttman, L. (1950): The principal components of scale analysis. In S. A. Stouffer, L. Guttman, E. A. Suchman, P. F. Lazarsfeld, S. A. Star, & J . A. Clausen. Measurement and prediction. Princeton: Princeton University Press.
Harshman R. A. (1970): Foundation of the PARAFAC procedure : Models and conditions for an explanatory multi-modal factor analysis. UCLA working paper in Phonetics, 16, UCLA, Los Angeles.
Hayashi C.(1956): Theory and examples of quantification. (II) Proc. of the Institute of Statist. Math. 4 (2), 19-30.
Hayashi, C. (1952): On the prediction of phenomena from qualitative data and the quantification of qualitative data from the mathematico-statistical point of view. Annals of the Institute of Statistical Mathematics, 3 (No. 2), 69-98.
Healy M. J. R. (1978): Is Statistics a Science?. J. R. Statist. Soc. A. 141, part 3, 385 -393. Hearnshaw L. S. (1979): Cyril Burt, Psychologist. Hodder and Stoughton, London.
Heiser W (2008): Psychometric roots of multidimensional data analysis in the Netherlands: From Gerard Heymans to John van de Geer. Electronic Journal for History of probability and Statistics. December 2008, vol 4, n°2. (www.jehps.net).
Hill M.O. (1974): Correspondence analysis: a neglected multivariate method. Appl. Statist. 3, 340-354.
Hill, M.O. and Gauch, H.G. (1980): Detrended Correspondence Analysis: An Improved Ordination Technique. Vegetatio 42, 47–58.
Hirschfeld H.D. (1935): A Connection between correlation and contingency. Proc. Camb. Phil. Soc. 31, 520-524.
Horst P. (1961): Relation among m sets of measures. Psychometrika, 26, 129-149. Horst P. (1965): Factor Analysis of Data Matrices. Holt, Rinehart, Winston, New York.
Horst,P. (1935): Measuring complex Attitudes, The Journal of Social Psychology, 6:3, 369-374 Hotelling H. (1933): Analysis of a complex of statistical variables into principal components. J. Educ.
Psychol. 24, 417-441, 498-520.
Joynson, R.B. (1989): The Burt Affair. New York: Routledge.
Kendall M.G and Stuart, A. (1961): The advanced theory of statistics, vol.2, Griffin
Kettenring R.J. (1971): Canonical analysis of several sets of variables. Biometrika, 58, (3), 433-450. Kroonenberg P. (1983): Three-Mode Principal Component Analysis. DSWO Press, Leiden.
Lancaster, H.O. (1957): The structure of bivariate distributions, Ann.Math. Stat., 29, 719-736. Lancaster H.O. (1963): Canonical correlation and partition of 2. Quart. J. of Math., 14, 220-224. Lancaster, H.O. (1969): The chi-squared distribution. Wiley
Lebart L. (1969): Introduction à l'analyse des données : Analyse des correspondances et validité des résultats. Consommation, Dunod. 4, 65-87.
14
Lebart L. (1974): On the Benzécri's method for finding eigenvectors by stochastic approximation. Proceedings in Comp. Statist., In: COMPSTAT, Physica verlag, Vienna, 202-211.
Lebart L. (1975): L'orientation du dépouillement de certaines enquêtes par l'analyse des correspondances multiples. Consommation, 2, 73-96. Dunod.
Lebart L., Morineau A., Tabard N. (1977): Techniques de la description statistique. Dunod, Paris. English translation in 1984: Lebart L., Morineau A., Warwick K.- Multivariate Descriptive Statistical Analysis. J. Wiley, NY. (translated without the (excellent) sociological examples from N. Tabard, by E. Berry, under the supervision of K. Warwick).
Lebart L., Tabard N. (1973): Recherches sur la description automatique des données socio-economiques. Rapport CORDES-CREDOC, Research Convention n°13/1971.
Lebart, L. (2008): Exploratory multivariate data analysis from its origins to 1980: Nine contributions. Electronic Journal for History of probability and Statistics, 4,2
Legendre P. and Legendre L. (1998): Numerical Ecology , Elsevier
Maung K. (1941): Measurement of association in a contingency table with special reference to the pigmentatin of hair and eye colours of Scottish schoolchildren. Ann. Eugen. Lond. 11, 189-223. Meulman J. (1982): Homogeneity Analysis of Incomplete Data. DSWO Press. Leiden.
Nakache J.P. (1973): Influence du codage des données en analyse factorielle des correspondances. Etude d'un exemple pratique médical. Revue Statist. Appl., 21, (2).
Naouri, J.C. (1971) : Analyse factorielle des correspondances continues, Thèse d’Etat., Univ. Pierre et Marie Curie, Paris
Nishisato S.(1980): Analysis of Categorical Data. Dual Scaling and its Application. Univ. of Toronto Press.
Nishisato, S. (2007): Multidimensional Nonlinear Descriptive Analysis, Chapman & Hall/CRC Pagès J.-P., Escoufier Y., Cazes P. (1976): Opérateurs et analyse de tableaux à plus de deux
dimensions. Cahiers du BURO, ISUP, Paris, 61-89
Pearson K. (1901): On lines and planes of closest fit to systems of points in space. Phil. Mag. 2, n°ll, 559-572.
Pearson, K. (1906): On certain Points connected with scale Order in the Case of the Correlation of two characters which for some arrangement give a Linear Regression Line. Biometrika 5, 176-178
Rao C.R. (1964): The use and interpretation of principal component analysis in applied research. Sankhya serie A, 26, 329-357.
Richardson M., Kuder G. F. (1933): Making a rating scale that measures. Personnel Journal., 12, 71-75.
Robert P., Escoufier Y. (1976): A unifying tool for linear multivariate methods : the RV coefficient. Applied Statistics, 25, (3), 257-265.
Saporta G. (1975 ): Dépendance et codage de deux variables aléatoires. Revue Statist. Appl. 23, 43-63.
Saporta G. (1977): Une méthode et un programme d'analyse discriminante sur variables qualitatives. In : Premières Journées Int. Analyse des Données et informatiques, INRIA, Rocquencourt.
Sylvester J.J. (1889): Messenger of Mathematics (quoted by Eckart and Young, 1939). 19, n°42. Takane, Y., Young, F. W., and de Leeuw, J. (1977): Nonmetric individual differences
multidimensional scaling: An alternating least squares method with optimal scaling features. Psychometrika, 42, 8-67.
Tenenhaus M., Young F. W. (1985): An analysis and synthesis of multiple correspondence analysis, optimal scaling, dual scaling, homogeneity analysis and other methods for quantifying categorical multivariate data. Psychometrika, 91-119.
Ter Braak, C.J.F. (1986): Canonical Correspondence Analysis: A New Eigenvector Technique for Multivariate Direct Gradient Analysis, Ecology, 67, 5 pp. 1167-1179
15
Thurstone L. L. (1947): Multiple Factor Analysis. The Univ. of Chicago Press, Chicago.
Tucker L. R. (1964): The extension of factor analysis to three-dimensional matrices. In: Contribution to Mathematical Psychology; Harris C. W. (ed), University of Wisconsin Press, Madison, 109 – 127..
Tucker L. R. (1966): Some mathematical notes on three-mode factor analysis. Psychometrika, 31, 279-311.
van der Heijden P.G.M., Sijtsma K. (1996): Fifty years of measurement and scaling in the Dutch social science. Statistica Neerlandica, vol 50, n°1, 111-135.
Williams E., J. (1952): Use of scores for the analysis of association in contingency tables. Biometrika, 44, 274-289.
Young, F. W., de Leeuw, J., and Takane, Y. (1976): Regression with qualitative and quantitative variables: An alternating least squares method with optimal scaling features. Psychometrika, 41, 505-529.
Young, F. W., Takane, Y., and de Leeuw, J. (1978): Principal components of mixed measurement level multivariate data: An alternating least squares method with optimal scaling features.