ScienceDirect
Available online at www.sciencedirect.com
Procedia Computer Science 170 (2020) 10–17
1877-0509 © 2020 The Authors. Published by Elsevier B.V.
This is an open access article under the CC BY-NC-ND license (http://creativecommons.org/licenses/by-nc-nd/4.0/) Peer-review under responsibility of the Conference Program Chairs.
10.1016/j.procs.2020.03.004
10.1016/j.procs.2020.03.004 1877-0509
© 2020 The Authors. Published by Elsevier B.V.
This is an open access article under the CC BY-NC-ND license (http://creativecommons.org/licenses/by-nc-nd/4.0/) Peer-review under responsibility of the Conference Program Chairs.
Available online at www.sciencedirect.com
ScienceDirect
Procedia Computer Science 00 (2020) 000–000www.elsevier.com/locate/procedia
1877-0509 © 2020 The Authors. Published by Elsevier B.V.
This is an open access article under the CC BY-NC-ND license (http://creativecommons.org/licenses/by-nc-nd/4.0/) Peer-review under responsibility of the Conference Program Chairs.
The 11th International Conference on Ambient Systems, Networks and Technologies (ANT)
April 6-9, 2020, Warsaw, Poland
Activity Recognition in Smart Homes using UWB Radars
Kevin Bouchard*, Julien Maitre, Camille Bertuglia, Sébastien Gaboury
Laboratoire d’Intelligence Ambiante pour la Reconnaissance d’Activités (LIARA) Université du Québec à Chicoutimi, 555 boulevard de l’Université, Chicoutimi G7H2B1, Canada
Abstract
In the last decade, smart homes have transitioned from a potential solution for aging-in-place to a real set of technologies being deployed in the real-world. This technological transfer has been mostly supported by simple, commercially available sensors such as passive infrared and electromagnetic contacts. On the other hand, many teams of research claim that the sensing capabilities are still too low to offer accurate, robust health-related monitoring and services. In this paper, we investigate the possibility of using Ultra-wideband (UWB) Doppler radars for the purpose of recognizing the ongoing ADLs in smart homes. Our team found out that with simple configuration and classical features engineering, a small set of UWB radars could reasonably be used to recognize ADLs in a realistic home environment. A dataset was built from 10 persons performing 15 different ADLs in a 40 square meters apartment with movement on the other side of the wall. Random Forest was able to attain 80% accuracy with an F1-Score of 79%, and a Kappa of 77%. Those results indicate the use of Doppler radars can be a good research avenue for smart homes.
© 2020 The Authors. Published by Elsevier B.V.
This is an open access article under the CC BY-NC-ND license (http://creativecommons.org/licenses/by-nc-nd/4.0/) Peer-review under responsibility of the Conference Program Chairs.
Keywords: Smart home; Activity recognition; Ambient intelligence; Radars; Machine learning;
1. Introduction
In recent years, eastern governments have multiplied the initiatives to find innovative solutions to the ongoing and increasingly concerning aging of their population [1]. This has particularly been affecting the first world countries, due to the longer life expectancy and the lower birthrate. For instance, in Canada, the average birthrate is now as low as 1.57 decreasing significantly from a high of 3.94 during the sixties [2]. Meanwhile, the proportion of adults aged
* Corresponding author. Tel.: +1-418-545-5011 5063.
E-mail address: [email protected]
2 Author name / Procedia Computer Science 00 (2018) 000–000
over 65 has grown from less than 10% to 17% in those same decades and is projected to reach up to 19.5% by 2068 [3]. This projection includes a partial offset by favorable immigration policies. The effects of such population aging may have dire consequences for the fragile public healthcare system. As the elders rise in number, the demand for health-related services increases proportionally. In particular, as they age, many elders begin losing their autonomy gradually and may require services to complete some or all of their Activities of Daily Living (ADLs). With the help of standardized ADLs, occupational therapists or other healthcare professionals may take the difficult decision to withdraw the person from their home. This drastic measure is not taken lightly, as it is not only extremely costly for the state, but also lead to a significant decrease in the quality of life of the person. For this reason, the government has been promoting aging-in-place for more than a decade now.
Aging-in-place usually means the need for punctual health services (physiotherapy, nursing, etc.) at the home of the person. In the context of a shortage of clinical professionals, this often proves challenging and threatens the security of the person if their services are not adequate. It is why, in this context, smart homes are embraced as a potentially cheap alternative to enable secure, semi-autonomous life for the elders [4]. Most of the smart home initiatives adopt the model based on cheap ubiquitous sensors distributed in strategic places in the environment of the person such as passive infrared sensors, electromagnetic contacts, smart plugs, and temperature sensors [5]. These types of sensors produce little data, are often noisy, and provide a very partial view of what is happening in the smart home. Therefore, a large body of the literature focuses on developing and improving pattern recognition algorithms in order to make the most out of this scarce data [6]. Nevertheless, there are fundamental limits to the improvement of the patterns that can be extracted from such data. Consequently, some teams, including ours, try to develop or exploit more informative technology. For instance, passive RFID can be exploited to track a multitude of objects in the smart home giving approximate movement information [7]. This rich data is, however, difficult to exploit. Moreover, spatial data tends to reduce the model generalization [8]. Some teams prefer to rely on wearable technology [9][10] which usually embed an Inertial Central Unit (IMU) and sometimes other sensors providing information on the health status (photoplethysmogram, tremor sensor, heart rate sensor). The IMU in itself can provide a variety of information on the ADLs of the person. The main disadvantages of wearables are that they must be charged daily and that it depends on the will of the person to always wear it. Another alternative replacing ubiquitous sensors is vision-based technology [11]. Vision-based sensing has the advantage of being more expressive in terms of information. Nevertheless, it is generally considered as more challenging to extract the interesting information (i.e., correct segmentation of the image). Moreover, the smart homes based on these technologies are more difficult to generalize since changing conditions may significantly affect the performance of those methods (i.e., light intensity in the smart home environment). Finally, the main reason preventing the adoption of vision-based technologies for aging-in-place is probably their perceived intrusiveness [12].
The conclusion that can be drawn is a need for better sensing capabilities in smart homes to fully embrace their potential for aging-in-place. One emerging technology which could provide a good compromise is the Ultra-Wide Band (UWB) RAdio Detection And Ranging (Radar) systems. While radars have been historically associated with large equipment for planes and boats detection, recent technological advances have enabled their implementation on small System on Chip (SoC) with low energy requirements. In this paper, our team investigates the use of a recent UWB radar as the sole technology for ADLs recognition in a smart home. The radar is a XeThru X4M200 from Novelda(https://www.xethru.com/). It is an affordable, precise, and robust sensor. In addition, an extensive dataset comprised of 15 different ADLs executed 10 times each was collected in a real smart home following realistic patterns of daily life activities. Three radars were installed in the smart home with no other technology (the other sensors were disabled). Thus, this paper explains the setup and how we built an activity recognition model from engineered features and the most common classification methods.
2. Related Work on UWB
The term ultra-wideband refers to the radio communication with a large effective bandwidth (between 20-25% of the center frequency depending on the definition) of ≥500MHz. This large bandwidth gives the UWB the possibility to transmit a large amount of data at a short distance. It is also considered as a very secure method of communication since the signals can be designed to appear as imperceptible random noise to conventional radios. It also operates at low power since it works by impulse modulation as opposed to the frequency modulation of narrowband
Kevin Bouchard et al. / Procedia Computer Science 170 (2020) 10–17 11
ScienceDirect
Procedia Computer Science 00 (2020) 000–000
www.elsevier.com/locate/procedia
1877-0509 © 2020 The Authors. Published by Elsevier B.V.
This is an open access article under the CC BY-NC-ND license (http://creativecommons.org/licenses/by-nc-nd/4.0/) Peer-review under responsibility of the Conference Program Chairs.
The 11th International Conference on Ambient Systems, Networks and Technologies (ANT)
April 6-9, 2020, Warsaw, Poland
Activity Recognition in Smart Homes using UWB Radars
Kevin Bouchard*, Julien Maitre, Camille Bertuglia, Sébastien Gaboury
Laboratoire d’Intelligence Ambiante pour la Reconnaissance d’Activités (LIARA) Université du Québec à Chicoutimi, 555 boulevard de l’Université, Chicoutimi G7H2B1, Canada
Abstract
In the last decade, smart homes have transitioned from a potential solution for aging-in-place to a real set of technologies being deployed in the real-world. This technological transfer has been mostly supported by simple, commercially available sensors such as passive infrared and electromagnetic contacts. On the other hand, many teams of research claim that the sensing capabilities are still too low to offer accurate, robust health-related monitoring and services. In this paper, we investigate the possibility of using Ultra-wideband (UWB) Doppler radars for the purpose of recognizing the ongoing ADLs in smart homes. Our team found out that with simple configuration and classical features engineering, a small set of UWB radars could reasonably be used to recognize ADLs in a realistic home environment. A dataset was built from 10 persons performing 15 different ADLs in a 40 square meters apartment with movement on the other side of the wall. Random Forest was able to attain 80% accuracy with an F1-Score of 79%, and a Kappa of 77%. Those results indicate the use of Doppler radars can be a good research avenue for smart homes.
© 2020 The Authors. Published by Elsevier B.V.
This is an open access article under the CC BY-NC-ND license (http://creativecommons.org/licenses/by-nc-nd/4.0/) Peer-review under responsibility of the Conference Program Chairs.
Keywords: Smart home; Activity recognition; Ambient intelligence; Radars; Machine learning;
1. Introduction
In recent years, eastern governments have multiplied the initiatives to find innovative solutions to the ongoing and increasingly concerning aging of their population [1]. This has particularly been affecting the first world countries, due to the longer life expectancy and the lower birthrate. For instance, in Canada, the average birthrate is now as low as 1.57 decreasing significantly from a high of 3.94 during the sixties [2]. Meanwhile, the proportion of adults aged
* Corresponding author. Tel.: +1-418-545-5011 5063.
E-mail address: [email protected]
ScienceDirect
Procedia Computer Science 00 (2020) 000–000www.elsevier.com/locate/procedia
1877-0509 © 2020 The Authors. Published by Elsevier B.V.
This is an open access article under the CC BY-NC-ND license (http://creativecommons.org/licenses/by-nc-nd/4.0/) Peer-review under responsibility of the Conference Program Chairs.
The 11th International Conference on Ambient Systems, Networks and Technologies (ANT)
April 6-9, 2020, Warsaw, Poland
Activity Recognition in Smart Homes using UWB Radars
Kevin Bouchard*, Julien Maitre, Camille Bertuglia, Sébastien Gaboury
Laboratoire d’Intelligence Ambiante pour la Reconnaissance d’Activités (LIARA) Université du Québec à Chicoutimi, 555 boulevard de l’Université, Chicoutimi G7H2B1, Canada
Abstract
In the last decade, smart homes have transitioned from a potential solution for aging-in-place to a real set of technologies being deployed in the real-world. This technological transfer has been mostly supported by simple, commercially available sensors such as passive infrared and electromagnetic contacts. On the other hand, many teams of research claim that the sensing capabilities are still too low to offer accurate, robust health-related monitoring and services. In this paper, we investigate the possibility of using Ultra-wideband (UWB) Doppler radars for the purpose of recognizing the ongoing ADLs in smart homes. Our team found out that with simple configuration and classical features engineering, a small set of UWB radars could reasonably be used to recognize ADLs in a realistic home environment. A dataset was built from 10 persons performing 15 different ADLs in a 40 square meters apartment with movement on the other side of the wall. Random Forest was able to attain 80% accuracy with an F1-Score of 79%, and a Kappa of 77%. Those results indicate the use of Doppler radars can be a good research avenue for smart homes.
© 2020 The Authors. Published by Elsevier B.V.
This is an open access article under the CC BY-NC-ND license (http://creativecommons.org/licenses/by-nc-nd/4.0/) Peer-review under responsibility of the Conference Program Chairs.
Keywords: Smart home; Activity recognition; Ambient intelligence; Radars; Machine learning;
1. Introduction
In recent years, eastern governments have multiplied the initiatives to find innovative solutions to the ongoing and increasingly concerning aging of their population [1]. This has particularly been affecting the first world countries, due to the longer life expectancy and the lower birthrate. For instance, in Canada, the average birthrate is now as low as 1.57 decreasing significantly from a high of 3.94 during the sixties [2]. Meanwhile, the proportion of adults aged
* Corresponding author. Tel.: +1-418-545-5011 5063.
E-mail address: [email protected]
2 Author name / Procedia Computer Science 00 (2018) 000–000
over 65 has grown from less than 10% to 17% in those same decades and is projected to reach up to 19.5% by 2068 [3]. This projection includes a partial offset by favorable immigration policies. The effects of such population aging may have dire consequences for the fragile public healthcare system. As the elders rise in number, the demand for health-related services increases proportionally. In particular, as they age, many elders begin losing their autonomy gradually and may require services to complete some or all of their Activities of Daily Living (ADLs). With the help of standardized ADLs, occupational therapists or other healthcare professionals may take the difficult decision to withdraw the person from their home. This drastic measure is not taken lightly, as it is not only extremely costly for the state, but also lead to a significant decrease in the quality of life of the person. For this reason, the government has been promoting aging-in-place for more than a decade now.
Aging-in-place usually means the need for punctual health services (physiotherapy, nursing, etc.) at the home of the person. In the context of a shortage of clinical professionals, this often proves challenging and threatens the security of the person if their services are not adequate. It is why, in this context, smart homes are embraced as a potentially cheap alternative to enable secure, semi-autonomous life for the elders [4]. Most of the smart home initiatives adopt the model based on cheap ubiquitous sensors distributed in strategic places in the environment of the person such as passive infrared sensors, electromagnetic contacts, smart plugs, and temperature sensors [5]. These types of sensors produce little data, are often noisy, and provide a very partial view of what is happening in the smart home. Therefore, a large body of the literature focuses on developing and improving pattern recognition algorithms in order to make the most out of this scarce data [6]. Nevertheless, there are fundamental limits to the improvement of the patterns that can be extracted from such data. Consequently, some teams, including ours, try to develop or exploit more informative technology. For instance, passive RFID can be exploited to track a multitude of objects in the smart home giving approximate movement information [7]. This rich data is, however, difficult to exploit. Moreover, spatial data tends to reduce the model generalization [8]. Some teams prefer to rely on wearable technology [9][10] which usually embed an Inertial Central Unit (IMU) and sometimes other sensors providing information on the health status (photoplethysmogram, tremor sensor, heart rate sensor). The IMU in itself can provide a variety of information on the ADLs of the person. The main disadvantages of wearables are that they must be charged daily and that it depends on the will of the person to always wear it. Another alternative replacing ubiquitous sensors is vision-based technology [11]. Vision-based sensing has the advantage of being more expressive in terms of information. Nevertheless, it is generally considered as more challenging to extract the interesting information (i.e., correct segmentation of the image). Moreover, the smart homes based on these technologies are more difficult to generalize since changing conditions may significantly affect the performance of those methods (i.e., light intensity in the smart home environment). Finally, the main reason preventing the adoption of vision-based technologies for aging-in-place is probably their perceived intrusiveness [12].
The conclusion that can be drawn is a need for better sensing capabilities in smart homes to fully embrace their potential for aging-in-place. One emerging technology which could provide a good compromise is the Ultra-Wide Band (UWB) RAdio Detection And Ranging (Radar) systems. While radars have been historically associated with large equipment for planes and boats detection, recent technological advances have enabled their implementation on small System on Chip (SoC) with low energy requirements. In this paper, our team investigates the use of a recent UWB radar as the sole technology for ADLs recognition in a smart home. The radar is a XeThru X4M200 from Novelda(https://www.xethru.com/). It is an affordable, precise, and robust sensor. In addition, an extensive dataset comprised of 15 different ADLs executed 10 times each was collected in a real smart home following realistic patterns of daily life activities. Three radars were installed in the smart home with no other technology (the other sensors were disabled). Thus, this paper explains the setup and how we built an activity recognition model from engineered features and the most common classification methods.
2. Related Work on UWB
The term ultra-wideband refers to the radio communication with a large effective bandwidth (between 20-25% of the center frequency depending on the definition) of ≥500MHz. This large bandwidth gives the UWB the possibility to transmit a large amount of data at a short distance. It is also considered as a very secure method of communication since the signals can be designed to appear as imperceptible random noise to conventional radios. It also operates at low power since it works by impulse modulation as opposed to the frequency modulation of narrowband
12 Author name / Procedia Computer Science 00 (2018) 000–000 Kevin Bouchard et al. / Procedia Computer Science 170 (2020) 10–17 3
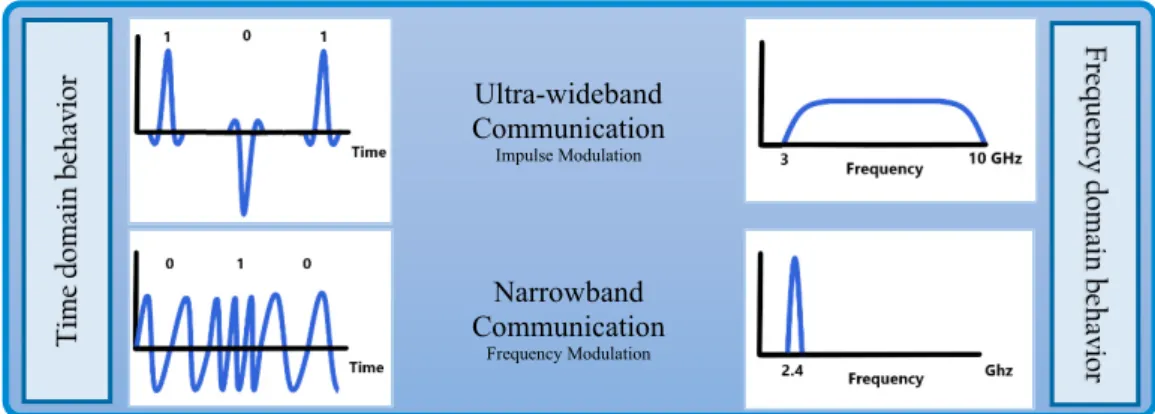
communications. Impulse modulation means that there is no need for a carrier wave. Figure 1 shows the difference between the narrowband and the ultra-wideband. The impulse modulation, as opposed to amplitude, frequency or phase modulation, is also non-interfering. This is due to the high-time resolution. It results in a method insensible to the well-known multipath propagation problem. UWB usually relies on many rapid short pulses that occupy the entire bandwidth. This characteristic enables high spatial resolution when UWB is used as radars (up to a few millimeters).
Ultra-wideband Communication Impulse Modulation Narrowband Communication Frequency Modulation
Figure 1. The Ultra-wide band behavior in the time and the frequency domains compared to narrowband. Ultra-wideband radars (UWB) have been the subject of many promising works on various related fields such as heart rate monitoring, sleep monitoring, occupancy detection, 3D imaging or fall detection [13], [14], [15], [16]. Slow-time information are usually used with a Fast Fourrier Transform (FFT) to infer a patient heart rate, though several other methods have been used to improve the accuracy [13]. This method is a way to exploit the manifestation of the Doppler effect and pickup small body motion that can also be applied for sleep monitoring [17]. Principal Component Analysis can be used on the UWB data to suppress clutter and detect the occupancy of a room [15]. Kirchhoff Migration and Stolt frequency-wavenumber (F-K) Migration, used in imaging, can be used as well with UWB data offering a fast, accessible and cheap alternative for security imaging devices [17]. Additionally, interesting features can be extracted from the micro-Doppler effect which can then be utilized for many classification methods for fall detection [16]. Nevertheless, most of the work found in the literature exploit only one radar in a laboratory setting. In our knowledge, there are no realistic deployment of a plurality of radars for the purpose of activity recognition in a realistic home environment.
3. The Smart Home
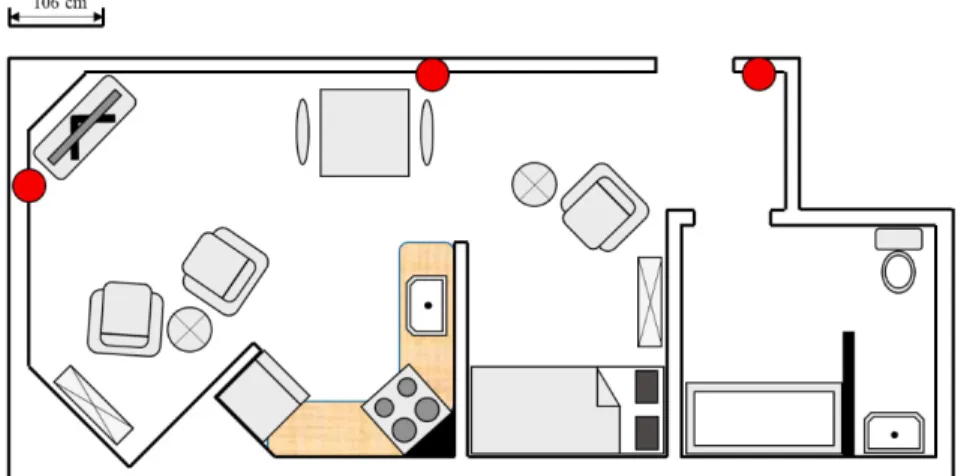
Our research team has access to a real-size smart home prototype and conducts experimental research inside the University. This smart home is an infrastructure comprising a living room, a kitchen, a bedroom, and a bathroom. The whole environment is about 40 square meters (Figure 2). There are student desks all around the infrastructure with windows to see what going on inside. Our team is sensors agnostic and, therefore, there are various types of technologies in the prototyping smart home including motion, ultrasonic, temperature, RFID, power analyzer, BLE beacons, and other types of sensors. The reason is, like many other researchers in the community, our team has not yet found the perfect solution to solve the long going problems regarding the tracking and the recognition of the ongoing ADLs in the smart home. The challenge of ADLs recognition in smart homes is to create an Artificial Intelligence (AI) on the top of the smart home’s sensors, offering only a partial vision of the environment, and to deduce the actions of an unaware person inside. The difficulty resides not only in the limited information but also in the almost unlimited courses of actions humans can do in their environment. Hundreds of papers have been published on this topic over the last decades [5], [6], [10], [18]. Yet, it eludes us because we need to solve it with little intrusiveness, low cost, and with good overall precision. The UWB radar technology, which was presented in Section 2, has the potential to partially address these challenges. In particular, the XeThru X4M200, from Novelda, could be a cost-effective solution at $249 US per SoC if a few of them could cover an apartment and enable ADLs recognition as a standalone technology. Ti m e do m ai n be ha vi or Fre que ncy dom ain be ha vi or
4 Author name / Procedia Computer Science 00 (2018) 000–000
Figure 2. The LIARA smart home. The three dots are the position of the UWB Doppler radar.
3.1. XeThru X4M200
The radar our team decided to use in this research project is the XeThru X4M200 by Novelda (Figure 3). The Xethru uses pulse-Doppler signal processing. The principle is to use a tx antenna to transmit coherent pulses at a coherent tone using an oscillator (a 27MHz one in the XeThru). After sending a pulse, the transmitter is turned off and an rx antenna listens for the reflections of that signal. The quiet period between those pulses has a direct effect on the range of the radars since it is the time available for the pulse to travel to the distant object round-trip. These pulses are repeated following a Pulse Repetition Frequency (PRF) of 15.875MHz (number of cycles per second) to comply with the FCC, but are modifiable in the XeThru SoC. When a pulse is disrupted by an object, some of its energy is reflected. This reflection is sampled at the end of the pulse until another pulse is fired. Each sample has the same width as the transmitted pulse. If the disruptor object is moving, its movement will produce a frequency shift. This is called the Doppler effect and it can be exploited to estimate the velocity of the object.
The XeThru Doppler radar is easy to install, cost reasonable, has only a little multipath propagation, and can pass through walls. The XeThru X4M200 has a few parameters and firmware algorithms. First, it can operate on a low frequency occupying the 6.0 to 8.5GHz band or a high frequency between 7.5 and 10.20GHz. By default, the XeThru provides 17 data frames per second, although in this project it was changed to 50. Those frames are accumulated in a buffer processed by two parallel pulse Doppler. The slow time uses the last 20 seconds of data and the fast time exploits the last 6 seconds. The slow Doppler is used for respiration detection or a stationary/slow-moving person in the environment. In our research, we directly exploit the frames collected in the buffer which contain the raw data. Each frame is composed of 184 bins containing the amplitude reflections over the parametrized distance. The range we were able to attain using the XeThru was close to 10 m which is about twice the default distance used for the respiration and movement detector algorithms. Therefore, to cover the whole smart home, we had to use three units. Moreover, from three on up, it could be possible to perform trilateration and localize a person using time of flight. While it was not used for the activity recognition in this project, our team has been also working on this aspect. The radars are shown with the big red dots on Figure 2.
communications. Impulse modulation means that there is no need for a carrier wave. Figure 1 shows the difference between the narrowband and the ultra-wideband. The impulse modulation, as opposed to amplitude, frequency or phase modulation, is also non-interfering. This is due to the high-time resolution. It results in a method insensible to the well-known multipath propagation problem. UWB usually relies on many rapid short pulses that occupy the entire bandwidth. This characteristic enables high spatial resolution when UWB is used as radars (up to a few millimeters).
Ultra-wideband Communication Impulse Modulation Narrowband Communication Frequency Modulation
Figure 1. The Ultra-wide band behavior in the time and the frequency domains compared to narrowband. Ultra-wideband radars (UWB) have been the subject of many promising works on various related fields such as heart rate monitoring, sleep monitoring, occupancy detection, 3D imaging or fall detection [13], [14], [15], [16]. Slow-time information are usually used with a Fast Fourrier Transform (FFT) to infer a patient heart rate, though several other methods have been used to improve the accuracy [13]. This method is a way to exploit the manifestation of the Doppler effect and pickup small body motion that can also be applied for sleep monitoring [17]. Principal Component Analysis can be used on the UWB data to suppress clutter and detect the occupancy of a room [15]. Kirchhoff Migration and Stolt frequency-wavenumber (F-K) Migration, used in imaging, can be used as well with UWB data offering a fast, accessible and cheap alternative for security imaging devices [17]. Additionally, interesting features can be extracted from the micro-Doppler effect which can then be utilized for many classification methods for fall detection [16]. Nevertheless, most of the work found in the literature exploit only one radar in a laboratory setting. In our knowledge, there are no realistic deployment of a plurality of radars for the purpose of activity recognition in a realistic home environment.
3. The Smart Home
Our research team has access to a real-size smart home prototype and conducts experimental research inside the University. This smart home is an infrastructure comprising a living room, a kitchen, a bedroom, and a bathroom. The whole environment is about 40 square meters (Figure 2). There are student desks all around the infrastructure with windows to see what going on inside. Our team is sensors agnostic and, therefore, there are various types of technologies in the prototyping smart home including motion, ultrasonic, temperature, RFID, power analyzer, BLE beacons, and other types of sensors. The reason is, like many other researchers in the community, our team has not yet found the perfect solution to solve the long going problems regarding the tracking and the recognition of the ongoing ADLs in the smart home. The challenge of ADLs recognition in smart homes is to create an Artificial Intelligence (AI) on the top of the smart home’s sensors, offering only a partial vision of the environment, and to deduce the actions of an unaware person inside. The difficulty resides not only in the limited information but also in the almost unlimited courses of actions humans can do in their environment. Hundreds of papers have been published on this topic over the last decades [5], [6], [10], [18]. Yet, it eludes us because we need to solve it with little intrusiveness, low cost, and with good overall precision. The UWB radar technology, which was presented in Section 2, has the potential to partially address these challenges. In particular, the XeThru X4M200, from Novelda, could be a cost-effective solution at $249 US per SoC if a few of them could cover an apartment and enable ADLs recognition as a standalone technology. Ti m e do m ai n be ha vi or Fre que ncy dom ain be ha vi or
Figure 2. The LIARA smart home. The three dots are the position of the UWB Doppler radar.
3.1. XeThru X4M200
The radar our team decided to use in this research project is the XeThru X4M200 by Novelda (Figure 3). The Xethru uses pulse-Doppler signal processing. The principle is to use a tx antenna to transmit coherent pulses at a coherent tone using an oscillator (a 27MHz one in the XeThru). After sending a pulse, the transmitter is turned off and an rx antenna listens for the reflections of that signal. The quiet period between those pulses has a direct effect on the range of the radars since it is the time available for the pulse to travel to the distant object round-trip. These pulses are repeated following a Pulse Repetition Frequency (PRF) of 15.875MHz (number of cycles per second) to comply with the FCC, but are modifiable in the XeThru SoC. When a pulse is disrupted by an object, some of its energy is reflected. This reflection is sampled at the end of the pulse until another pulse is fired. Each sample has the same width as the transmitted pulse. If the disruptor object is moving, its movement will produce a frequency shift. This is called the Doppler effect and it can be exploited to estimate the velocity of the object.
The XeThru Doppler radar is easy to install, cost reasonable, has only a little multipath propagation, and can pass through walls. The XeThru X4M200 has a few parameters and firmware algorithms. First, it can operate on a low frequency occupying the 6.0 to 8.5GHz band or a high frequency between 7.5 and 10.20GHz. By default, the XeThru provides 17 data frames per second, although in this project it was changed to 50. Those frames are accumulated in a buffer processed by two parallel pulse Doppler. The slow time uses the last 20 seconds of data and the fast time exploits the last 6 seconds. The slow Doppler is used for respiration detection or a stationary/slow-moving person in the environment. In our research, we directly exploit the frames collected in the buffer which contain the raw data. Each frame is composed of 184 bins containing the amplitude reflections over the parametrized distance. The range we were able to attain using the XeThru was close to 10 m which is about twice the default distance used for the respiration and movement detector algorithms. Therefore, to cover the whole smart home, we had to use three units. Moreover, from three on up, it could be possible to perform trilateration and localize a person using time of flight. While it was not used for the activity recognition in this project, our team has been also working on this aspect. The radars are shown with the big red dots on Figure 2.
14 Kevin Bouchard et al. / Procedia Computer Science 170 (2020) 10–17
Author name / Procedia Computer Science 00 (2018) 000–000 5
4. Building an Activity Dataset
In order to test if the UWB radar could be used as the sole technology for activity recognition in smart homes, the team designed a comprehensive experimental protocol. The team selected 15 different ADLs to cover most of the smart home. These ADLs are the following set: {A-Drink, B-Sleeping, C-Put on a coat, D-Cleaning, E-Preparing pasta, F-Preparing Tea, G-Doing the dishes, H-Brushing your teeth, I-Wash your hands, J-Read a book, K-Eat, L-Walk, M-Put on shoes, N-Take medication, O-Use a computer}. Our goal was to collect a realistic dataset, so even though the students work on desks that are on the other side of the wall, we did not ask them to leave. This, indeed, realistically depicts the possible capture of the neighbor from the other side of the wall in an eldercare facility. The project was evaluated in front of the ethical board of our institution and approved for research (#2019-220). Each participant was informed of the project, their implication in it, and the data that would be collected. They had to sign a consent form. In total, the team was able to recruit 10 adults aged between 22 and 39 years old. All of them were males due to the inherent difficulty to recruit females in our department. Each of them performed the 15 ADLs for a total of 150 ADLs instances in our dataset. For the methodology, the participants were explained the keys steps of each ADL and then they were free to perform it as they wished. For instance, the ADL Preparing Tea was composed of the key steps Take a mug, Put water in the boiler, Heat the water, Take the tea, Put the tea in the mug, Fill the mug
with boiling water without a specified order. Nevertheless, the freedom that was given to the participants resulted in
high variability in the execution. For instance, some participants boiled the water using the microwave oven. While waiting for the water to boil, the participants were free to do whatever they wanted (most of them checked their phone). Each ADL had, however, a predetermined fixed time. Hence, the person was told the approximate time and we recorded until the fixed time was elapsed even when the person finished early (the participant was asked to wait). The ADLs durations were respectively 30 seconds for {A, C, I, L, N}, 45 second for {M}, 60 seconds for {B}, 120 seconds for {D, G, J, K, O}, 180 seconds for {F, H}, and 300 seconds for {E}.
5. Experiments and results
As mentioned previously, the UWB radars were set up in order to provide 50 data frames per second. Let 𝐗𝐗 = 𝑥𝑥𝑗𝑗,𝑖𝑖∈ ℝ𝑁𝑁×𝑀𝑀 be the radar scattering matrix, where 𝑥𝑥
𝑗𝑗,𝑖𝑖 is the amplitude value related to the bin 𝑗𝑗 of the frame 𝑖𝑖. 𝑁𝑁 and 𝑀𝑀 denote the total bins number of one frame (fast-time) and the total frames number (slow-time) respectively. In other terms, 𝐗𝐗 represents a successive concatenation (recording) of the received radar signals (frames) during a certain period (time window), say 𝑃𝑃 seconds. Thus, 𝑀𝑀 corresponds to the multiplication of the sampling rate ( 𝑆𝑆 frames/second) by the duration of 𝑃𝑃 seconds. Then, the data preprocessing step has the objective to transform this radar scattering matrix 𝐗𝐗 into a radar time series 𝐘𝐘 = 𝑦𝑦𝑖𝑖∈ ℝ1×𝑀𝑀 (vector). To do so, we normalize all the data in one column (amplitude values of one frame) according to the maximum absolute value in this same column. Then, we sum all the normalized values of the column in order to obtain the value 𝑦𝑦𝑖𝑖 at time 𝑖𝑖 of our new signal. Equation (1) describes the operation allowing to transform the radar scattering matrix into a radar time series.
(1)
Finally, the resulting time series 𝐙𝐙 = 𝑧𝑧𝑖𝑖∈ ℝ1×𝑀𝑀 is also normalized by subtracting the mean and dividing by the standard deviation of the non-normalized time series 𝐘𝐘. Equation (2) expresses this last operation in order to get a time series that can be exploited for the feature extraction processing.
(2) From this time series 𝐙𝐙, we can now extract features through a sliding time window. Thus, we defined a length of time window equal to 15 seconds. In other terms, the exploited time window has 750 samples. Also, the overlap between time window over time series is 80%, which means that two successive time windows share 600 identical
6 Author name / Procedia Computer Science 00 (2018) 000–000
samples. More generally, we exploited three UWB radars and each of them provides a time series denoted by 𝑇𝑇𝑆𝑆𝑗𝑗, where 𝑗𝑗 = 1, 2, 3 represents the radar identification number. Thus, one event is defined as a matrix given by [𝑇𝑇𝑆𝑆1, 𝑇𝑇𝑆𝑆2, 𝑇𝑇𝑆𝑆3]. Unfortunately, this event is strongly dependent on the person and radars’ locations. Thus, we decided to shift the time series in this matrix in order to create two new instances related to this event. The two new instances are given by [𝑇𝑇𝑆𝑆2, 𝑇𝑇𝑆𝑆3, 𝑇𝑇𝑆𝑆1], [𝑇𝑇𝑆𝑆3, 𝑇𝑇𝑆𝑆1, 𝑇𝑇𝑆𝑆2].
5.1. Features Extraction
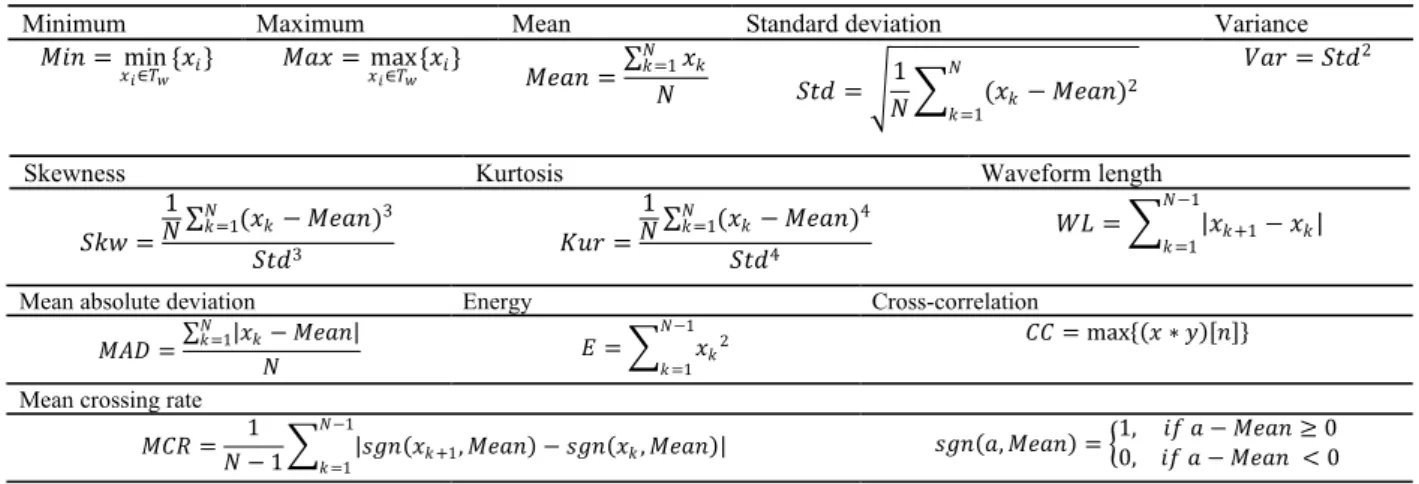
From the time domain, 12 features are extracted. Let the time window be 𝑇𝑇𝑤𝑤, 𝑁𝑁 is the number of samples, 𝑥𝑥𝑘𝑘 is the sample 𝑘𝑘 in the window. Then, the time domain features are the ones defined in the Table 1. For the cross-correlation, where 𝑥𝑥 and 𝑦𝑦 are the time windows of the first and the second sensor respectively, 𝑛𝑛 denotes the displacement between these two time windows, and * represents the convolution.
Table 1. The time domain features.
Finally, the raw data was also processed with the discrete wavelet transform (DWT) in order to extract features from the frequency domain. The DWT of a signal 𝑥𝑥 is given by two convolutions and each of them are followed by a downsampling operation. The first convolution involves the signal 𝑥𝑥 and a low pass filter with impulse response. Then the result is subsampled by 2 providing the approximation coefficients (ACs) denoted by 𝐴𝐴𝐶𝐶1. The second convolution also involves the signal 𝑥𝑥 and a high-pass filter. Again, the convolution result is subsampled by 2 providing the detail coefficients (DCs) denoted by 𝐷𝐷𝐶𝐶1. All these computations describe a one level transformation (or decomposition). However, it is possible to increase the number of level transformation. To do so, the resulting ACs (considered as the new signal 𝑥𝑥) is exploited to apply a new one level transformation in order to obtain 𝐴𝐴𝐶𝐶2 et 𝐷𝐷𝐶𝐶2, and so on. The maximum level of decomposition can be computed from the original signal with Equation (3):
max level = ⌊log2(length(𝑤𝑤) − 1)⌋length(𝑥𝑥) (3)
where length(𝑥𝑥) is the number of samples of signal 𝑥𝑥 and length(𝑤𝑤) denotes the length of the wavelet filter. In the presented study, we obtained a maximum level of decomposition equal to 9, and we used the wavelet Daubechies 1. Once the signal 𝑥𝑥 has been decomposed with the DWT, we exploit each detail coefficients from each level by calculating the related energy. Equation (4) gives the details of the energy computation from DCs related to the decomposition level 𝑗𝑗. Consequently, the number of features per time series is 21, and per instances is 63 features.
𝑒𝑒𝑛𝑛𝑒𝑒𝑛𝑛𝑛𝑛𝑦𝑦𝑗𝑗 = √
∑𝑛𝑛𝑖𝑖=1𝐷𝐷𝐶𝐶𝑗𝑗,𝑖𝑖2 length(𝐷𝐷𝐶𝐶𝑗𝑗)
(4)
Minimum Maximum Mean Standard deviation Variance
𝑀𝑀𝑖𝑖𝑛𝑛 = min 𝑥𝑥𝑖𝑖∈𝑇𝑇𝑤𝑤{𝑥𝑥𝑖𝑖} 𝑀𝑀𝑎𝑎𝑥𝑥 = max𝑥𝑥𝑖𝑖∈𝑇𝑇𝑤𝑤{𝑥𝑥𝑖𝑖} 𝑀𝑀𝑒𝑒𝑎𝑎𝑛𝑛 =∑ 𝑥𝑥𝑘𝑘 𝑁𝑁 𝑘𝑘=1 𝑁𝑁 𝑆𝑆𝑡𝑡𝑑𝑑 = √𝑁𝑁1 (𝑥𝑥𝑘𝑘− 𝑀𝑀𝑒𝑒𝑎𝑎𝑛𝑛)2 𝑁𝑁 𝑘𝑘=1 𝑉𝑉𝑎𝑎𝑛𝑛 = 𝑆𝑆𝑡𝑡𝑑𝑑2
Skewness Kurtosis Waveform length
𝑆𝑆𝑘𝑘𝑤𝑤 = 1 𝑁𝑁 ∑𝑁𝑁𝑘𝑘=1(𝑥𝑥𝑘𝑘− 𝑀𝑀𝑒𝑒𝑎𝑎𝑛𝑛)3 𝑆𝑆𝑡𝑡𝑑𝑑3 𝐾𝐾𝑢𝑢𝑛𝑛 = 1 𝑁𝑁 ∑𝑁𝑁𝑘𝑘=1(𝑥𝑥𝑘𝑘− 𝑀𝑀𝑒𝑒𝑎𝑎𝑛𝑛)4 𝑆𝑆𝑡𝑡𝑑𝑑4 𝑊𝑊𝐿𝐿 = 𝑥𝑥𝑘𝑘+1− 𝑥𝑥𝑘𝑘 𝑁𝑁−1 𝑘𝑘=1
Mean absolute deviation Energy Cross-correlation
𝑀𝑀𝐴𝐴𝐷𝐷 =∑𝑁𝑁𝑘𝑘=1 𝑥𝑥𝑘𝑘𝑁𝑁− 𝑀𝑀𝑒𝑒𝑎𝑎𝑛𝑛 𝐸𝐸 = 𝑥𝑥𝑘𝑘2
𝑁𝑁−1 𝑘𝑘=1
𝐶𝐶𝐶𝐶 = max (𝑥𝑥 ∗ 𝑦𝑦)[𝑛𝑛] Mean crossing rate
𝑀𝑀𝐶𝐶𝑅𝑅 =𝑁𝑁 − 1 1 𝑠𝑠𝑛𝑛𝑛𝑛(𝑥𝑥𝑘𝑘+1, 𝑀𝑀𝑒𝑒𝑎𝑎𝑛𝑛) − 𝑠𝑠𝑛𝑛𝑛𝑛(𝑥𝑥𝑘𝑘, 𝑀𝑀𝑒𝑒𝑎𝑎𝑛𝑛)
𝑁𝑁−1
𝑘𝑘=1 𝑠𝑠𝑛𝑛𝑛𝑛(𝑎𝑎, 𝑀𝑀𝑒𝑒𝑎𝑎𝑛𝑛) = 1, 𝑖𝑖𝑓𝑓 𝑎𝑎 − 𝑀𝑀𝑒𝑒𝑎𝑎𝑛𝑛 ≥ 00, 𝑖𝑖𝑓𝑓 𝑎𝑎 − 𝑀𝑀𝑒𝑒𝑎𝑎𝑛𝑛 < 0
Mean absolute deviation Energy Cross-correlation
𝑀𝑀𝑎𝑎𝑑𝑑 =∑𝑁𝑁𝑘𝑘=1 𝑥𝑥𝑘𝑘𝑁𝑁− 𝑀𝑀𝑒𝑒𝑎𝑎𝑛𝑛 𝐸𝐸 = 𝑥𝑥𝑘𝑘+1−𝑥𝑥𝑘𝑘2
𝑁𝑁−1 𝑘𝑘=1
𝐶𝐶𝐶𝐶 = max (𝑥𝑥 ∗ 𝑦𝑦)[𝑛𝑛] Mean crossing rate
𝑀𝑀𝐶𝐶𝑅𝑅 =𝑁𝑁 − 1 1 𝑠𝑠𝑛𝑛𝑛𝑛(𝑥𝑥𝑘𝑘+1, 𝑀𝑀𝑒𝑒𝑎𝑎𝑛𝑛) − 𝑠𝑠𝑛𝑛𝑛𝑛(𝑥𝑥𝑘𝑘, 𝑀𝑀𝑒𝑒𝑎𝑎𝑛𝑛)
𝑁𝑁−1
4. Building an Activity Dataset
In order to test if the UWB radar could be used as the sole technology for activity recognition in smart homes, the team designed a comprehensive experimental protocol. The team selected 15 different ADLs to cover most of the smart home. These ADLs are the following set: {A-Drink, B-Sleeping, C-Put on a coat, D-Cleaning, E-Preparing pasta, F-Preparing Tea, G-Doing the dishes, H-Brushing your teeth, I-Wash your hands, J-Read a book, K-Eat, L-Walk, M-Put on shoes, N-Take medication, O-Use a computer}. Our goal was to collect a realistic dataset, so even though the students work on desks that are on the other side of the wall, we did not ask them to leave. This, indeed, realistically depicts the possible capture of the neighbor from the other side of the wall in an eldercare facility. The project was evaluated in front of the ethical board of our institution and approved for research (#2019-220). Each participant was informed of the project, their implication in it, and the data that would be collected. They had to sign a consent form. In total, the team was able to recruit 10 adults aged between 22 and 39 years old. All of them were males due to the inherent difficulty to recruit females in our department. Each of them performed the 15 ADLs for a total of 150 ADLs instances in our dataset. For the methodology, the participants were explained the keys steps of each ADL and then they were free to perform it as they wished. For instance, the ADL Preparing Tea was composed of the key steps Take a mug, Put water in the boiler, Heat the water, Take the tea, Put the tea in the mug, Fill the mug
with boiling water without a specified order. Nevertheless, the freedom that was given to the participants resulted in
high variability in the execution. For instance, some participants boiled the water using the microwave oven. While waiting for the water to boil, the participants were free to do whatever they wanted (most of them checked their phone). Each ADL had, however, a predetermined fixed time. Hence, the person was told the approximate time and we recorded until the fixed time was elapsed even when the person finished early (the participant was asked to wait). The ADLs durations were respectively 30 seconds for {A, C, I, L, N}, 45 second for {M}, 60 seconds for {B}, 120 seconds for {D, G, J, K, O}, 180 seconds for {F, H}, and 300 seconds for {E}.
5. Experiments and results
As mentioned previously, the UWB radars were set up in order to provide 50 data frames per second. Let 𝐗𝐗 = 𝑥𝑥𝑗𝑗,𝑖𝑖 ∈ ℝ𝑁𝑁×𝑀𝑀 be the radar scattering matrix, where 𝑥𝑥𝑗𝑗,𝑖𝑖 is the amplitude value related to the bin 𝑗𝑗 of the frame 𝑖𝑖. 𝑁𝑁 and 𝑀𝑀 denote the total bins number of one frame (fast-time) and the total frames number (slow-time) respectively. In other terms, 𝐗𝐗 represents a successive concatenation (recording) of the received radar signals (frames) during a certain period (time window), say 𝑃𝑃 seconds. Thus, 𝑀𝑀 corresponds to the multiplication of the sampling rate ( 𝑆𝑆 frames/second) by the duration of 𝑃𝑃 seconds. Then, the data preprocessing step has the objective to transform this radar scattering matrix 𝐗𝐗 into a radar time series 𝐘𝐘 = 𝑦𝑦𝑖𝑖∈ ℝ1×𝑀𝑀 (vector). To do so, we normalize all the data in one column (amplitude values of one frame) according to the maximum absolute value in this same column. Then, we sum all the normalized values of the column in order to obtain the value 𝑦𝑦𝑖𝑖 at time 𝑖𝑖 of our new signal. Equation (1) describes the operation allowing to transform the radar scattering matrix into a radar time series.
(1)
Finally, the resulting time series 𝐙𝐙 = 𝑧𝑧𝑖𝑖∈ ℝ1×𝑀𝑀 is also normalized by subtracting the mean and dividing by the standard deviation of the non-normalized time series 𝐘𝐘. Equation (2) expresses this last operation in order to get a time series that can be exploited for the feature extraction processing.
(2) From this time series 𝐙𝐙, we can now extract features through a sliding time window. Thus, we defined a length of time window equal to 15 seconds. In other terms, the exploited time window has 750 samples. Also, the overlap between time window over time series is 80%, which means that two successive time windows share 600 identical
samples. More generally, we exploited three UWB radars and each of them provides a time series denoted by 𝑇𝑇𝑆𝑆𝑗𝑗, where 𝑗𝑗 = 1, 2, 3 represents the radar identification number. Thus, one event is defined as a matrix given by [𝑇𝑇𝑆𝑆1, 𝑇𝑇𝑆𝑆2, 𝑇𝑇𝑆𝑆3]. Unfortunately, this event is strongly dependent on the person and radars’ locations. Thus, we decided to shift the time series in this matrix in order to create two new instances related to this event. The two new instances are given by [𝑇𝑇𝑆𝑆2, 𝑇𝑇𝑆𝑆3, 𝑇𝑇𝑆𝑆1], [𝑇𝑇𝑆𝑆3, 𝑇𝑇𝑆𝑆1, 𝑇𝑇𝑆𝑆2].
5.1. Features Extraction
From the time domain, 12 features are extracted. Let the time window be 𝑇𝑇𝑤𝑤, 𝑁𝑁 is the number of samples, 𝑥𝑥𝑘𝑘 is the sample 𝑘𝑘 in the window. Then, the time domain features are the ones defined in the Table 1. For the cross-correlation, where 𝑥𝑥 and 𝑦𝑦 are the time windows of the first and the second sensor respectively, 𝑛𝑛 denotes the displacement between these two time windows, and * represents the convolution.
Table 1. The time domain features.
Finally, the raw data was also processed with the discrete wavelet transform (DWT) in order to extract features from the frequency domain. The DWT of a signal 𝑥𝑥 is given by two convolutions and each of them are followed by a downsampling operation. The first convolution involves the signal 𝑥𝑥 and a low pass filter with impulse response. Then the result is subsampled by 2 providing the approximation coefficients (ACs) denoted by 𝐴𝐴𝐶𝐶1. The second convolution also involves the signal 𝑥𝑥 and a high-pass filter. Again, the convolution result is subsampled by 2 providing the detail coefficients (DCs) denoted by 𝐷𝐷𝐶𝐶1. All these computations describe a one level transformation (or decomposition). However, it is possible to increase the number of level transformation. To do so, the resulting ACs (considered as the new signal 𝑥𝑥) is exploited to apply a new one level transformation in order to obtain 𝐴𝐴𝐶𝐶2 et 𝐷𝐷𝐶𝐶2, and so on. The maximum level of decomposition can be computed from the original signal with Equation (3):
max level = ⌊log2(length(𝑤𝑤) − 1)⌋length(𝑥𝑥) (3)
where length(𝑥𝑥) is the number of samples of signal 𝑥𝑥 and length(𝑤𝑤) denotes the length of the wavelet filter. In the presented study, we obtained a maximum level of decomposition equal to 9, and we used the wavelet Daubechies 1. Once the signal 𝑥𝑥 has been decomposed with the DWT, we exploit each detail coefficients from each level by calculating the related energy. Equation (4) gives the details of the energy computation from DCs related to the decomposition level 𝑗𝑗. Consequently, the number of features per time series is 21, and per instances is 63 features.
𝑒𝑒𝑛𝑛𝑒𝑒𝑛𝑛𝑛𝑛𝑦𝑦𝑗𝑗 = √
∑𝑛𝑛𝑖𝑖=1𝐷𝐷𝐶𝐶𝑗𝑗,𝑖𝑖2 length(𝐷𝐷𝐶𝐶𝑗𝑗)
(4)
Minimum Maximum Mean Standard deviation Variance
𝑀𝑀𝑖𝑖𝑛𝑛 = min 𝑥𝑥𝑖𝑖∈𝑇𝑇𝑤𝑤{𝑥𝑥𝑖𝑖} 𝑀𝑀𝑎𝑎𝑥𝑥 = max𝑥𝑥𝑖𝑖∈𝑇𝑇𝑤𝑤{𝑥𝑥𝑖𝑖} 𝑀𝑀𝑒𝑒𝑎𝑎𝑛𝑛 =∑ 𝑥𝑥𝑘𝑘 𝑁𝑁 𝑘𝑘=1 𝑁𝑁 𝑆𝑆𝑡𝑡𝑑𝑑 = √𝑁𝑁1 (𝑥𝑥𝑘𝑘− 𝑀𝑀𝑒𝑒𝑎𝑎𝑛𝑛)2 𝑁𝑁 𝑘𝑘=1 𝑉𝑉𝑎𝑎𝑛𝑛 = 𝑆𝑆𝑡𝑡𝑑𝑑2
Skewness Kurtosis Waveform length
𝑆𝑆𝑘𝑘𝑤𝑤 = 1 𝑁𝑁 ∑𝑁𝑁𝑘𝑘=1(𝑥𝑥𝑘𝑘− 𝑀𝑀𝑒𝑒𝑎𝑎𝑛𝑛)3 𝑆𝑆𝑡𝑡𝑑𝑑3 𝐾𝐾𝑢𝑢𝑛𝑛 = 1 𝑁𝑁 ∑𝑁𝑁𝑘𝑘=1(𝑥𝑥𝑘𝑘− 𝑀𝑀𝑒𝑒𝑎𝑎𝑛𝑛)4 𝑆𝑆𝑡𝑡𝑑𝑑4 𝑊𝑊𝐿𝐿 = 𝑥𝑥𝑘𝑘+1− 𝑥𝑥𝑘𝑘 𝑁𝑁−1 𝑘𝑘=1
Mean absolute deviation Energy Cross-correlation
𝑀𝑀𝐴𝐴𝐷𝐷 =∑𝑁𝑁𝑘𝑘=1 𝑥𝑥𝑘𝑘𝑁𝑁− 𝑀𝑀𝑒𝑒𝑎𝑎𝑛𝑛 𝐸𝐸 = 𝑥𝑥𝑘𝑘2
𝑁𝑁−1 𝑘𝑘=1
𝐶𝐶𝐶𝐶 = max (𝑥𝑥 ∗ 𝑦𝑦)[𝑛𝑛] Mean crossing rate
𝑀𝑀𝐶𝐶𝑅𝑅 =𝑁𝑁 − 1 1 𝑠𝑠𝑛𝑛𝑛𝑛(𝑥𝑥𝑘𝑘+1, 𝑀𝑀𝑒𝑒𝑎𝑎𝑛𝑛) − 𝑠𝑠𝑛𝑛𝑛𝑛(𝑥𝑥𝑘𝑘, 𝑀𝑀𝑒𝑒𝑎𝑎𝑛𝑛)
𝑁𝑁−1
𝑘𝑘=1 𝑠𝑠𝑛𝑛𝑛𝑛(𝑎𝑎, 𝑀𝑀𝑒𝑒𝑎𝑎𝑛𝑛) = 1, 𝑖𝑖𝑓𝑓 𝑎𝑎 − 𝑀𝑀𝑒𝑒𝑎𝑎𝑛𝑛 ≥ 00, 𝑖𝑖𝑓𝑓 𝑎𝑎 − 𝑀𝑀𝑒𝑒𝑎𝑎𝑛𝑛 < 0
Mean absolute deviation Energy Cross-correlation
𝑀𝑀𝑎𝑎𝑑𝑑 =∑𝑁𝑁𝑘𝑘=1 𝑥𝑥𝑘𝑘𝑁𝑁− 𝑀𝑀𝑒𝑒𝑎𝑎𝑛𝑛 𝐸𝐸 = 𝑥𝑥𝑘𝑘+1−𝑥𝑥𝑘𝑘2
𝑁𝑁−1 𝑘𝑘=1
𝐶𝐶𝐶𝐶 = max (𝑥𝑥 ∗ 𝑦𝑦)[𝑛𝑛] Mean crossing rate
𝑀𝑀𝐶𝐶𝑅𝑅 =𝑁𝑁 − 1 1 𝑠𝑠𝑛𝑛𝑛𝑛(𝑥𝑥𝑘𝑘+1, 𝑀𝑀𝑒𝑒𝑎𝑎𝑛𝑛) − 𝑠𝑠𝑛𝑛𝑛𝑛(𝑥𝑥𝑘𝑘, 𝑀𝑀𝑒𝑒𝑎𝑎𝑛𝑛)
𝑁𝑁−1
16 Kevin Bouchard et al. / Procedia Computer Science 170 (2020) 10–17
Author name / Procedia Computer Science 00 (2018) 000–000 7
5.2. Algorithms
From the algorithms point of view, the team decided to test four of the most common supervised classifiers. The first algorithm is the k-Nearest Neighbors (KNN). KNN is a non-parametric instance-based learning method. It requires all the training dataset to perform classification. It is obviously very slow and limited to relatively small datasets. The idea is simply to use a distance measure to select the k neighbors that are the most similar to the new instance to classify. Then, the class is selected by vote (majority, plurality, weighted majority, etc.). The second algorithm, Classification and Regression Tree (CART), is a binary tree constructed from the training dataset using the Gini index to select the best split on the attributes. It creates an intelligible model for humans, as long as the data can be understood. The third model is the ensemble method named AdaBoost. The idea is to use a series of weak learners. A weight vector for each sample is uniformly initialized. During a boosting cycle, the weak learner is selected to minimize the weighted sum of error for misclassified instances. Then, the weights are revised and normalized. The classifier is added to the ensemble and the next boosting cycle can begin, and so on. The fourth algorithm is Random Forest, another ensemble learning method, but relying on bagging instead of boosting. The idea is to randomly select a subset of the dataset of size 𝑛𝑛, build a decision tree using only a random subset of attributes of size 𝑚𝑚 at each node, and repeat k times (to create the forest). The classification is then a vote on the k trees.
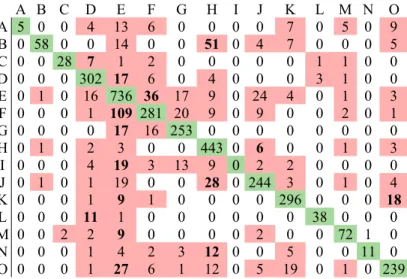
As shown in Table 2, the ensemble learning methods, without any surprise, surpassed by far the naïve KNN. The results shown are for KNN with k=5, but we did test other values. Between 1 to 5 there was little difference and over it, it would start dropping significantly. CART did a little better, but still 20% under the Random Forest performance. The Random Forest confusion matrix is shown on Figure 4. Some of the misclassifications were for obvious reasons. The ADL K-Eat was often confused with O-Use a computer since they were both calm ADLs on the kitchen table with a few hand motions. Cleaning (D) and L-Walking could be confused since in both cases the participants walked around the smart home, with only the vacuum in their hand as a difference. Other confusions, such as the one between
B-Sleeping and H-Brushing your teeth still eludes us. Nevertheless, we think that our dataset is too small to recognize
such a variety of ADLs. Moreover, in some case, such as H and I, the participants performed the ADLs in different locations. Still, overall, without much preprocessing and configuration, the classifiers were able to perform reasonably. The recognition could probably have climbed to a 90%+ performance with simpler ADLs such as seen in the literature [6]. Moreover, with other information such as the location of the person (the room especially), the results could be improved with the tradeoff that it would prevent from generalizing to a different smart home layout.
Table 2. The classifiers’ performance. Classifier Accuracy F1-Score Kappa
KNN 0.51 0.50 0.44
CART 0.60 0.60 0.54
Adaboost 0.77 0.75 0.73
Random
Forest 0.80 0.79 0.77
Figure 4. Confusion matrix for Random Forest with k=100. A B C D E F G H I J K L M N O A 5 0 0 4 13 6 0 0 0 0 7 0 5 0 9 B 0 58 0 0 14 0 0 51 0 4 7 0 0 0 5 C 0 0 28 7 1 2 0 0 0 0 0 1 1 0 0 D 0 0 0 302 17 6 0 4 0 0 0 3 1 0 0 E 0 1 0 16 736 36 17 9 0 24 4 0 1 0 3 F 0 0 0 1 109 281 20 9 0 9 0 0 2 0 1 G 0 0 0 0 17 16 253 0 0 0 0 0 0 0 0 H 0 1 0 2 3 0 0 443 0 6 0 0 1 0 3 I 0 0 0 4 19 3 13 9 0 2 2 0 0 0 0 J 0 1 0 1 19 0 0 28 0 244 3 0 1 0 4 K 0 0 0 1 9 1 0 0 0 0 296 0 0 0 18 L 0 0 0 11 1 0 0 0 0 0 0 38 0 0 0 M 0 0 2 2 9 0 0 0 0 2 0 0 72 1 0 N 0 0 0 1 4 2 3 12 0 0 5 0 0 11 0 O 0 0 0 1 27 6 1 12 0 5 19 0 1 0 239
8 Author name / Procedia Computer Science 00 (2018) 000–000
6. Conclusion and Future Work
In this paper, our team presented a first investigation regarding the use of UWB Doppler radars as the sole technology in a smart home. Our investigation was based on the use of three XeThru X4M200 in a 40 square meters apartment. The total cost of this equipment was only $ 750 US, which make it an affordable alternative. With a good feature selection, a small dataset, and negligible configuration efforts, trained classifiers were able to recognize ADLs with a good accuracy. In the future, our team will work on integrating these trained models into an expert system to build upon contextual knowledge and improve such recognition. Moreover, it is planned to gather bigger datasets in the future. A special effort will be produced to recruit women to avoid possible bias in recognition toward males. With a bigger dataset, our team plans to test a larger variety of features and algorithms, including deep neural networks. Acknowledgements
The authors would like to thank the Ministère de l’Économie et de l’Innovation from the government of the province of Québec, Canada for the grant that made this project possible. The authors would also like to thank the
Natural Sciences and Engineering Research Council (NSERC) for its general financing. Finally, the researchers want
to thank all the participants who took part to their data collection process. Quality research would not be possible without motivated citizens such as them.
References
[1] D. of E. United Nations and P. D. Social Affairs, “World Population Prospects 2019: Highlights,” 2019.
[2] N. Bohnert, A. Milan, and H. Lathe, “Enduring diversity: Living arrangements of children in Canada over 100 years of the census,” 2014. [3] “Population Projections for Canada (2018 to 2036),” 2019.
[4] S. Giroux and H. Pigot, “Smart homes for people suffering from cognitive disorders,” Comput. Sci. Ambient Intell., pp. 225–262, 2012. [5] D. J. Cook, A. S. Crandall, B. L. Thomas, and N. C. Krishnan, “CASAS: A smart home in a box,” Computer (Long. Beach. Calif)., vol. 46,
no. 7, pp. 62–69, 2012.
[6] S. Ramasamy Ramamurthy and N. Roy, “Recent trends in machine learning for human activity recognition—A survey,” Wiley Interdiscip.
Rev. Data Min. Knowl. Discov., vol. 8, no. 4, p. e1254, 2018.
[7] D. Fortin-Simard, J.-S. Bilodeau, K. Bouchard, S. Gaboury, B. Bouchard, and A. Bouzouane, “Exploiting Passive RFID Technology for Activity Recognition in Smart Homes,” IEEE Intell. Syst., vol. 30, no. 4, 2015.
[8] K. Bouchard, L. Holder, and D. J. Cook, “Extracting generalizable spatial features from smart phones datasets,” in AAAI Workshop -
Technical Report, 2016, vol. WS-16-01-.
[9] Y. Tian, X. Wang, L. Chen, and Z. Liu, “Wearable Sensor-Based Human Activity Recognition via Two-Layer Diversity-Enhanced Multiclassifier Recognition Method,” Sensors, vol. 19, no. 9, p. 2039, 2019.
[10] K. Chapron, V. Plantevin, F. Thullier, K. Bouchard, E. Duchesne, and S. Gaboury, “A more efficient transportable and scalable system for real-time activities and exercises recognition,” Sensors (Switzerland), vol. 18, no. 1, 2018.
[11] K. Kim, A. Jalal, and M. Mahmood, “Vision-Based Human Activity Recognition System Using Depth Silhouettes: A Smart Home System for Monitoring the Residents,” J. Electr. Eng. Technol., vol. 14, no. 6, pp. 2567–2573, 2019.
[12] K. L. Roberts and H. A. Allen, “Perception and cognition in the ageing brain: a brief review of the short-and long-term links between perceptual and cognitive decline,” Front. Aging Neurosci., vol. 8, p. 39, 2016.
[13] S. Wu, K. Tan, Z. Xia, J. Chen, S. Meng, and F. Guangyou, “Improved human respiration detection method via ultra-wideband radar in through-wall or other similar conditions,” IET Radar, Sonar Navig., vol. 10, no. 3, pp. 468–476, 2016.
[14] T. Sakamoto et al., “Feature-based correlation and topological similarity for interbeat interval estimation using ultrawideband radar,” IEEE
Trans. Biomed. Eng., vol. 63, no. 4, pp. 747–757, 2015.
[15] Z. Baird, I. Gunasekara, M. Bolic, and S. Rajan, “Principal component analysis-based occupancy detection with ultra wideband radar,” in
2017 IEEE 60th International Midwest Symposium on Circuits and Systems (MWSCAS), 2017, pp. 1573–1576.
[16] H. Sadreazami, M. Bolic, and S. Rajan, “Fall Detection using Standoff Radar-based Sensing and Deep Convolutional Neural Network,”
IEEE Trans. Circuits Syst. II Express Briefs, 2019.
[17] G. E. Smith, F. Ahmad, and M. G. Amin, “Micro-Doppler processing for ultra-wideband radar data,” in Radar Sensor Technology XVI, 2012, vol. 8361, p. 83610L.
[18] K. Bouchard, J. Lapalu, B. Bouchard, and A. Bouzouane, “Clustering of human activities from emerging movements: A flocking based unsupervised mining approach,” J. Ambient Intell. Humaniz. Comput., 2018.
5.2. Algorithms
From the algorithms point of view, the team decided to test four of the most common supervised classifiers. The first algorithm is the k-Nearest Neighbors (KNN). KNN is a non-parametric instance-based learning method. It requires all the training dataset to perform classification. It is obviously very slow and limited to relatively small datasets. The idea is simply to use a distance measure to select the k neighbors that are the most similar to the new instance to classify. Then, the class is selected by vote (majority, plurality, weighted majority, etc.). The second algorithm, Classification and Regression Tree (CART), is a binary tree constructed from the training dataset using the Gini index to select the best split on the attributes. It creates an intelligible model for humans, as long as the data can be understood. The third model is the ensemble method named AdaBoost. The idea is to use a series of weak learners. A weight vector for each sample is uniformly initialized. During a boosting cycle, the weak learner is selected to minimize the weighted sum of error for misclassified instances. Then, the weights are revised and normalized. The classifier is added to the ensemble and the next boosting cycle can begin, and so on. The fourth algorithm is Random Forest, another ensemble learning method, but relying on bagging instead of boosting. The idea is to randomly select a subset of the dataset of size 𝑛𝑛, build a decision tree using only a random subset of attributes of size 𝑚𝑚 at each node, and repeat k times (to create the forest). The classification is then a vote on the k trees.
As shown in Table 2, the ensemble learning methods, without any surprise, surpassed by far the naïve KNN. The results shown are for KNN with k=5, but we did test other values. Between 1 to 5 there was little difference and over it, it would start dropping significantly. CART did a little better, but still 20% under the Random Forest performance. The Random Forest confusion matrix is shown on Figure 4. Some of the misclassifications were for obvious reasons. The ADL K-Eat was often confused with O-Use a computer since they were both calm ADLs on the kitchen table with a few hand motions. Cleaning (D) and L-Walking could be confused since in both cases the participants walked around the smart home, with only the vacuum in their hand as a difference. Other confusions, such as the one between
B-Sleeping and H-Brushing your teeth still eludes us. Nevertheless, we think that our dataset is too small to recognize
such a variety of ADLs. Moreover, in some case, such as H and I, the participants performed the ADLs in different locations. Still, overall, without much preprocessing and configuration, the classifiers were able to perform reasonably. The recognition could probably have climbed to a 90%+ performance with simpler ADLs such as seen in the literature [6]. Moreover, with other information such as the location of the person (the room especially), the results could be improved with the tradeoff that it would prevent from generalizing to a different smart home layout.
Table 2. The classifiers’ performance. Classifier Accuracy F1-Score Kappa
KNN 0.51 0.50 0.44
CART 0.60 0.60 0.54
Adaboost 0.77 0.75 0.73
Random
Forest 0.80 0.79 0.77
Figure 4. Confusion matrix for Random Forest with k=100. A B C D E F G H I J K L M N O A 5 0 0 4 13 6 0 0 0 0 7 0 5 0 9 B 0 58 0 0 14 0 0 51 0 4 7 0 0 0 5 C 0 0 28 7 1 2 0 0 0 0 0 1 1 0 0 D 0 0 0 302 17 6 0 4 0 0 0 3 1 0 0 E 0 1 0 16 736 36 17 9 0 24 4 0 1 0 3 F 0 0 0 1 109 281 20 9 0 9 0 0 2 0 1 G 0 0 0 0 17 16 253 0 0 0 0 0 0 0 0 H 0 1 0 2 3 0 0 443 0 6 0 0 1 0 3 I 0 0 0 4 19 3 13 9 0 2 2 0 0 0 0 J 0 1 0 1 19 0 0 28 0 244 3 0 1 0 4 K 0 0 0 1 9 1 0 0 0 0 296 0 0 0 18 L 0 0 0 11 1 0 0 0 0 0 0 38 0 0 0 M 0 0 2 2 9 0 0 0 0 2 0 0 72 1 0 N 0 0 0 1 4 2 3 12 0 0 5 0 0 11 0 O 0 0 0 1 27 6 1 12 0 5 19 0 1 0 239
6. Conclusion and Future Work
In this paper, our team presented a first investigation regarding the use of UWB Doppler radars as the sole technology in a smart home. Our investigation was based on the use of three XeThru X4M200 in a 40 square meters apartment. The total cost of this equipment was only $ 750 US, which make it an affordable alternative. With a good feature selection, a small dataset, and negligible configuration efforts, trained classifiers were able to recognize ADLs with a good accuracy. In the future, our team will work on integrating these trained models into an expert system to build upon contextual knowledge and improve such recognition. Moreover, it is planned to gather bigger datasets in the future. A special effort will be produced to recruit women to avoid possible bias in recognition toward males. With a bigger dataset, our team plans to test a larger variety of features and algorithms, including deep neural networks. Acknowledgements
The authors would like to thank the Ministère de l’Économie et de l’Innovation from the government of the province of Québec, Canada for the grant that made this project possible. The authors would also like to thank the
Natural Sciences and Engineering Research Council (NSERC) for its general financing. Finally, the researchers want
to thank all the participants who took part to their data collection process. Quality research would not be possible without motivated citizens such as them.
References
[1] D. of E. United Nations and P. D. Social Affairs, “World Population Prospects 2019: Highlights,” 2019.
[2] N. Bohnert, A. Milan, and H. Lathe, “Enduring diversity: Living arrangements of children in Canada over 100 years of the census,” 2014. [3] “Population Projections for Canada (2018 to 2036),” 2019.
[4] S. Giroux and H. Pigot, “Smart homes for people suffering from cognitive disorders,” Comput. Sci. Ambient Intell., pp. 225–262, 2012. [5] D. J. Cook, A. S. Crandall, B. L. Thomas, and N. C. Krishnan, “CASAS: A smart home in a box,” Computer (Long. Beach. Calif)., vol. 46,
no. 7, pp. 62–69, 2012.
[6] S. Ramasamy Ramamurthy and N. Roy, “Recent trends in machine learning for human activity recognition—A survey,” Wiley Interdiscip.
Rev. Data Min. Knowl. Discov., vol. 8, no. 4, p. e1254, 2018.
[7] D. Fortin-Simard, J.-S. Bilodeau, K. Bouchard, S. Gaboury, B. Bouchard, and A. Bouzouane, “Exploiting Passive RFID Technology for Activity Recognition in Smart Homes,” IEEE Intell. Syst., vol. 30, no. 4, 2015.
[8] K. Bouchard, L. Holder, and D. J. Cook, “Extracting generalizable spatial features from smart phones datasets,” in AAAI Workshop -
Technical Report, 2016, vol. WS-16-01-.
[9] Y. Tian, X. Wang, L. Chen, and Z. Liu, “Wearable Sensor-Based Human Activity Recognition via Two-Layer Diversity-Enhanced Multiclassifier Recognition Method,” Sensors, vol. 19, no. 9, p. 2039, 2019.
[10] K. Chapron, V. Plantevin, F. Thullier, K. Bouchard, E. Duchesne, and S. Gaboury, “A more efficient transportable and scalable system for real-time activities and exercises recognition,” Sensors (Switzerland), vol. 18, no. 1, 2018.
[11] K. Kim, A. Jalal, and M. Mahmood, “Vision-Based Human Activity Recognition System Using Depth Silhouettes: A Smart Home System for Monitoring the Residents,” J. Electr. Eng. Technol., vol. 14, no. 6, pp. 2567–2573, 2019.
[12] K. L. Roberts and H. A. Allen, “Perception and cognition in the ageing brain: a brief review of the short-and long-term links between perceptual and cognitive decline,” Front. Aging Neurosci., vol. 8, p. 39, 2016.
[13] S. Wu, K. Tan, Z. Xia, J. Chen, S. Meng, and F. Guangyou, “Improved human respiration detection method via ultra-wideband radar in through-wall or other similar conditions,” IET Radar, Sonar Navig., vol. 10, no. 3, pp. 468–476, 2016.
[14] T. Sakamoto et al., “Feature-based correlation and topological similarity for interbeat interval estimation using ultrawideband radar,” IEEE
Trans. Biomed. Eng., vol. 63, no. 4, pp. 747–757, 2015.
[15] Z. Baird, I. Gunasekara, M. Bolic, and S. Rajan, “Principal component analysis-based occupancy detection with ultra wideband radar,” in
2017 IEEE 60th International Midwest Symposium on Circuits and Systems (MWSCAS), 2017, pp. 1573–1576.
[16] H. Sadreazami, M. Bolic, and S. Rajan, “Fall Detection using Standoff Radar-based Sensing and Deep Convolutional Neural Network,”
IEEE Trans. Circuits Syst. II Express Briefs, 2019.
[17] G. E. Smith, F. Ahmad, and M. G. Amin, “Micro-Doppler processing for ultra-wideband radar data,” in Radar Sensor Technology XVI, 2012, vol. 8361, p. 83610L.
[18] K. Bouchard, J. Lapalu, B. Bouchard, and A. Bouzouane, “Clustering of human activities from emerging movements: A flocking based unsupervised mining approach,” J. Ambient Intell. Humaniz. Comput., 2018.