HAL Id: hal-00201498
https://hal.archives-ouvertes.fr/hal-00201498
Submitted on 30 Dec 2007
HAL is a multi-disciplinary open access
archive for the deposit and dissemination of sci-entific research documents, whether they are pub-lished or not. The documents may come from teaching and research institutions in France or abroad, or from public or private research centers.
L’archive ouverte pluridisciplinaire HAL, est destinée au dépôt et à la diffusion de documents scientifiques de niveau recherche, publiés ou non, émanant des établissements d’enseignement et de recherche français ou étrangers, des laboratoires publics ou privés.
A possible link between critical and limiting flux for
colloidal systems: consideration of critical deposit
formation along a membrane
Patrice Bacchin
To cite this version:
Patrice Bacchin. A possible link between critical and limiting flux for colloidal systems: consideration of critical deposit formation along a membrane. Journal of Membrane Science, Elsevier, 2004, 228 (2), pp.237-241. �10.1016/j.memsci.2003.10.012�. �hal-00201498�
A possible link between critical and limiting flux for colloidal
systems : consideration of critical deposit formation along a
membrane
P. Bacchin
Laboratoire de Génie Chimique, Université Paul Sabatier, 118 route de Narbonne, 31062 Toulouse cedex, France
[email protected], Fax: (33) 5 61 55 61 39
Abstract
A simple model based on (a) the formation of a deposit under critical conditions and (b) on a boundary layer growing along a hollow fiber or tubular membrane in cross-flow filtration suggests that the limiting and critical fluxes can be theoretically linked. With certain assumptions, it is shown that the critical flux is equal to 2/3 of the limiting flux. The assumptions made and the existence of a direct relationship between critical and limiting flux in "real world" membrane process are further discussed.
Keywords: fouling, critical flux, crossflow filtration, ultrafiltration
1. Introduction
Limiting flux is an old concept in cross-flow filtration which represents the maximum stationary permeation flux which can be reached when increasing trans-membrane pressure. Critical flux is a concept that appeared in 1994 and 1995 [1-4] to describe the flux at which irreversible fouling appears on a membrane. Critical and limiting fluxes are well different in their significance. The objective of this paper is to establish a theoretical link between these
two concepts for colloidal systems by considering a simple model for critical deposit formation.
Below, a simplified view of the critical flux concept is presented through use of the critical Peclet number in order to have an easily and understandable basis to describe deposit formation. Implications of this view are then detailed through the development of a model for critical deposit formation (CDF). By considering the formation of a deposit under critical conditions and the development of the boundary layer along a membrane surface, variation of permeate flux between the critical flux and the final limiting flux is depicted and the concepts of critical and limiting flux are linked theoretically. Finally phenomena that can limit this analysis are discussed.
2. Simplified view of critical flux through a critical Péclet number
2.1. The Péclet number : a simple way to consider the effect of cross-flow velocity on critical flux
A literature survey shows that critical fluxes obtained during cross-flow filtration are dependent on numerous parameters such as suspension properties (particles size and concentration), surface interaction (ionic strength, pH, zeta potential) and hydrodynamic conditions (tangential velocity). Concerning hydrodynamics, it appears clearly that the critical flux is a function of the tangential velocity. This effect may be accounted for in a fairly simple way via a critical Peclet number [1,2] which represents the ratio of permeate flux to mass transfer coefficient : crit crit crit D J k J Pe ⎟ ⎠ ⎞ ⎜ ⎝ ⎛ = ⎟ ⎠ ⎞ ⎜ ⎝ ⎛ = δ (1)
where k is the mass transfer coefficient which can be deduced from a film model as the ratio of diffusion coefficient, D, to the boundary layer thickness, δ. Parameters k and δ can then be
related to the friction factor through the traditional approach adopted in chemical engineering (Chilon-Colburn analogies) to describe mass transfer at an interface. A similar critical ratio is defined and experimentally illustrated through a ratio of critical flux to wall shear rate by Guesan-Guisiou et al. [5] : wall shear rate and mass transfer coefficient being linked together through the friction factor. Theoretical considerations [1] have shown that the critical Péclet number (eq. 1) is only a function of the suspension properties and the presence of surface interaction between particles and the membrane. It can then be linked for example to a stability ratio dependent on the surface interaction [1-2] or traditionally to the logarithm of a concentration ratio (gel model). The critical Péclet number is then a way to normalize the critical flux with respect to hydrodynamic phenomena.
2.2. The Péclet number : a simple way to explain deposit development from the outlet towards the inlet in a membrane channel
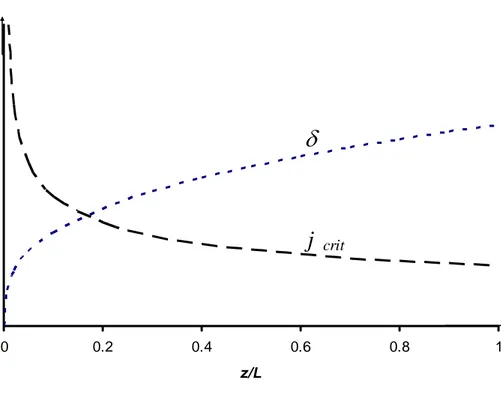
Let us examine now the consequence of considering a constant critical Péclet number in a membrane channel. A typical distribution of boundary layer thickness with the axial distance z in a membrane channel with steady state laminar and fully developed flow is shown in Figure 1 where a power law with a 1/3 exponent relationship has been used in agreement with Davis and Sherwood [6] and with our numerical simulation of filtration and deposit formation [7]. Physically, this variation in boundary layer thickness along a porous channel (from a thin layer near the entrance to a thicker one at the outlet) describes the associated effects in mass transfer of an axial convection with a radial diffusion. Such a development is inevitable : the use of spacers along the membrane can disrupt it but does not avoid a distribution (there will be a distribution of boundary layer thickness for every gap between spacers). Considering a constant critical Péclet number leads to a distribution of a local critical flux all along the membrane: the lowest local critical flux is at the end of membrane where the boundary layer is thickest (figure 1). Such a critical flux distribution has consequences for the formation of
the deposit along the membrane: with increasing trans-membrane pressure critical flux will be reached (and deposit will form) first at the outlet of the membrane. The implication is that the irreversible deposit should spread from the outlet to the inlet of the membrane. A model is developed in the next section to illustrate this trend and describe the variation of the permeate flux as the deposit grows along the membrane.
3. Critical Deposit Formation (CDF) model
The critical deposit formation (CDF) model developed here is based on the following assumptions:
• cake deposit as main fouling phenomenon • negligible osmotic pressure
• no flux limitation before the critical flux (strong form of critical flux [8]) • a constant critical Péclet number for the membrane channel
• when the critical Péclet number is exceeded locally, the local flux is constant and equal to the local critical flux
• development of the boundary layer along the membrane channel proportional to z1/3 i.e. related to a steady state, laminar and fully developed flow
• longitudinal pressure drop along the membrane (retentate side) is ignored i.e. the pure water flux is identical all along the membrane
This model is therefore based on a distribution of critical permeate flux that assumes a constant critical Péclet number and considers the development of the boundary layer along the membrane length. It is then necessary to define a local permeate flux, j, (z dependent) and a mean flux, J (having for physical meaning the permeate flux collected and for mathematical meaning the average permeate flux resulting from the integration of the local flux).
The critical flux is defined as the mean flux (i.e. the permeate flux observed) for which the first deposit appears on the membrane. According to the previous consideration and definition (eq. 1), the critical flux for the whole membrane surface, Jcrit, is considered to be the
local critical flux at the outlet of the membrane, jcrit, and can then be linked to the critical
Péclet number and the mass transfer coefficient at the outlet of the membrane:
(
) (
)
critcrit
crit j z L k z L Pe
J = = = = (2)
Along the membrane length, z, there is a distribution of local critical fluxes, which can be linked similarly to the mass transfer coefficient and so to the value of the critical flux from the previous equation :
( ) ( )
(
)
1/3 ⎟1/3 ⎠ ⎞ ⎜ ⎝ ⎛ = ⎟ ⎠ ⎞ ⎜ ⎝ ⎛ = = = z L J z L Pe L z k Pe z k zjcrit crit crit crit (3)
Furthermore, the mean permeate flux over the membrane is given by :
∫
= L dz z j L J 0 ) ( 1 (4)According to the definition of the critical flux, the local flux on the membrane is the water flux if the local flux is below the local critical flux. On another hand, if the local water flux is above the critical flux there is a deposit leading to a decrease in permeate flux until the flux once again reaches the critical value. Such a mechanism can be written as follows:
0 0 j (z) j(z) J J < crit = (5) ) ( ) ( ) ( 0 j z j z j z J > crit = crit (6)
Assuming this, if the permeate water flux is greater than the critical flux at the end of the membrane then there exists a critical length, zcrit, along the membrane beyond which the
critical flux is reached. This critical length is defined by the fact that at this distance from the inlet the water permeate flux is equal to the local critical flux:
) (
0 jcrit zcrit
J = (7)
The critical length can then be derived from the equation for the local critical flux (eq 3) :
3 0 crit ⎟⎟ ⎠ ⎞ ⎜⎜ ⎝ ⎛ = J J L z crit (8)
The mean flux averaged over the membrane surface (eq. 4) is now the sum of two terms: one over the zone without deposit and one over the zone where local critical value is reached:
⎟ ⎟ ⎟ ⎟ ⎠ ⎞ ⎜ ⎜ ⎜ ⎜ ⎝ ⎛ + =
∫
∫
L z crit z crit crit dz z L J dz J L J 1/3 0 0 ( ) 1 (9)From this integration, one can deduce the mean permeate flux according to the global critical flux and the water permeate flux:
3 0 0 2 1 2 3 ⎟⎟ ⎠ ⎞ ⎜⎜ ⎝ ⎛ − = J J J J J crit crit (10)
Eq. 10 (valid only when J0>Jcrit) links the critical flux theoretically to the limiting flux. The
limiting flux is by definition the flux reached for high TMP i.e. very large water flux,
∞ →
0
J , and can then be deduced from equation 10 as :
crit J J 2 3 lim = (11)
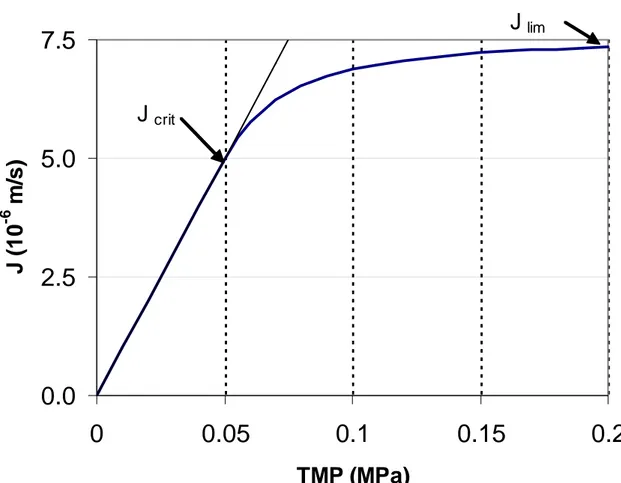
The variation of the mean permeate flux, J, according to equation 10 has been plotted in figure 2. The calculations presented in this paper were performed for a membrane permeability expressed as a ratio of pure water flux over trans-membrane pressure of 10-10 m.s-1.Pa-1.Critical flux appears and then first gives a deposit at the outlet of the membrane for a value corresponding to two-thirds of the limiting flux value as seen in the previous equation. One can note the continuity in the variation of eq. 10 with the flux line initially straight below Jcrit and curved beyond Jcrit.. Such a variation in the mean permeate flux is the result of the
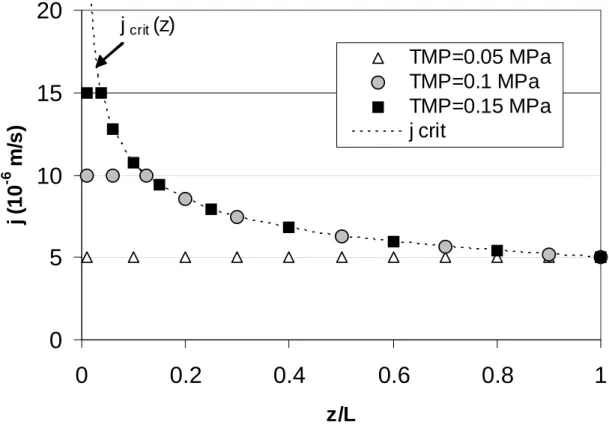
seen that below the critical length (zcrit/L= 0.037, 0.125 and 1) for the respective
trans-membrane pressure (TMP= 5 10+4, 1.5 10+5 and 2 10+5 Pa), the local permeate flux is the water flux and beyond is equal to the local critical flux given by the envelope curve (dashed line in figure 3).
The hydraulic resistance of the deposit can be easily deduced from this model. The resistance ratio (deposit resistance over membrane resistance) is derived from eq. 10 as:
2 2 0 2 2 0 3 0 0 3 3 2 1 crit crit crit m c J J J J J J J J R R − + − = − = (12)
The resistance ratio is the result of local variation as plotted in figure 4. One notes again that the deposit grows from the outlet of the membrane to the inlet as experimentally observed in numerous publications [9] or inside spacers elements [10]. An asymptotic limit of eq. 12 for large water flux is:
1 3 2 0 − = crit m c J J R R (13)
Equation 10 could be considered for a graphical determination of critical flux from experimental data. When plotting the mean permeate flux, J, as a function of the reciprocal of the square of the water permeate flux, 1/J02 (or similarly 1/TMP2), one should obtain a straight
line from which can be deduced the critical flux. However, such an exploitation of eq. 10 with experimental data has not given interesting results so far. Discrepancies could come from the fact that such a model can only apply to filtration performed with suspensions very homogeneous in size and physico-chemical properties and with membranes having a homogeneous permeate flux on the surface. It has to be noted that the local distribution of the permeate flux at the membrane surface has been already suspected by different authors [3, 11] as responsible for a distribution of critical flux over the membrane surface. On the other hand, an instability of the feed flow due to entrance effects or an imperfect membrane channel could
also be a factor in causing such discrepancies : such a phenomenon could cause the local critical flux profile to differ from the predicted profile because of a wrong development in boundary layer thickness.
Taking into account the dispersity in critical flux on the membrane for a given z induced by the dispersity in physico-chemical properties of both the suspension and the membrane or a more appropriate development in boundary layer thickness along the membrane could lead to interesting applications in the “real world” of membrane processes of this simple Critical Deposit Formation Model presented here. A full paper examining the effect of a possible dispersion of critical flux on the fouling with such an approach is in preparation.
4. Critical flux and limiting flux
Critical and limiting fluxes are well differentiated concepts in their definitions. The limiting flux is the maximum stationary flux obtained when increasing TMP. Unlike the limiting flux, the critical flux is a criterion for the transition between concentration polarisation and fouling. The critical flux is reached when irreversible fouling occurs locally on the membrane, whereas the limiting flux is reached when the whole membrane surface operates above the critical flux : i.e. when a further increase in flux at any point on the membrane surface lead to another layer deposit fully compensating the increased pressure drop. The difference between the values of critical and limiting flux can thus be physically related to the existence of a critical flux distribution of different properties along the membrane surface (fig. 1) as seen in this paper. By taking into account the distribution of mass transfer coefficient along the membrane induced by the boundary layer development, it can be seen that the critical flux has a value of two-thirds the limiting flux. A general rule to avoid any deposit on a membrane could be to never exceed 2/3 of the limiting flux : it has to be noted that such a rule is already applied in other processes such as electrodialysis.
5. Conclusions
A simplified view around the critical flux concept which keeps the concept as simple as possible (but not simpler) is used to illustrate the way a deposit can form when considering the variation in mass transfer coefficient along the membrane. This critical deposit formation (CDF) model allows the variation of the permate flux with the transmembrane pressure to be determined from the first appearence of the deposit at the outlet of the membrane (critical flux) until the limiting flux corresponding to flux value for which critical flux is reached all along the membrane. The growth of the boundary layer thickness, inherent in the mass transfer development along the membrane surface, leads to a fixed form for the curve of permeate flux versus TMP (eq. 10 and figure 2). This model predicts the appearance of the critical flux (deposit at the outlet of the membrane) at a value of 2/3 of the limiting flux:
lim
3 2
J Jcrit =
This kind of simple model with deposit formation along a membrane gives a rough description of the fouling development and a physical explanation for the difference between critical and limiting flux. Some improvements in this kind of approach could lead to further interesting studies of membrane processes controlled by critical deposit formation.
6. List of symbols
D Diffusion coefficient m2.s
j Local permeate flux m.s-1
J Mean permeate flux over the whole membrane surface m.s-1
k Mass transfer coefficient m.s-1
L Membrane length m
R Hydraulic resistance m-1
z Axial position along the membrane m
Greek letters
δ Boundary layer thickness m
Subscripts 0 Water crit Critical lim Limiting c Cake m Membrane
7. References
[1] P. Bacchin, Formation et résistance au transfert d’un dépôt de colloïdes sur une membrane d’ultrafiltration, thesis n° 1743, Université Paul Sabatier, Toulouse, France, 1994.
[2] P. Bacchin, P. Aimar, V. Sanchez. Model for colloidal fouling of membranes, AIChE J., 41, (1995) 368-376.
[3] R.W. Field, D. Wu, J.A. Howell, B.B. Gupta. Critical flux concept for microfiltration fouling, Journal of Membrane Science, 100, (1995) 259-272.
[4] J.A. Howell. Sub-critical flux operation of microfiltration, Journal of Membrane Science, 107, (1995) 165-171.
[5] G. Gesan-Guiziou, E. Boyaval, G. Daufin. Critical stability conditions in crossflow microfiltration of skimmed milk: transition to irreversible deposition, Journal of Membrane Science, 158, (1999) 211-222. [6] R.H. Davis, J.D. Sherwood. A similarity solution for steady-state crossflow microfiltration, Chemical
[7] P. Bacchin, D. Si-Hassen, V. Starov, M.J. Clifton, P. Aimar. A unifying model for concentration polarization, gel-layer formation and particle deposition in cross-flow membrane filtration of colloidal suspensions, Chemical Engineering Science, 57, (2002) 77-91.
[8] D.X. Wu, J.A. Howell, R.W. Field. Critical flux measurement for model colloids, Journal of Membrane Science, 152, (1999) 89-98.
[9] B.D. Cho, A.G. Fane. Fouling transients in nominally sub-critical flux operation of a membrane bioreactor, Journal of Membrane Science, 209, (2002) 391-403.
[10] P. R. Neal, H. Li, A. G. Fane, D. E. Wiley. The effect of filament orientation on critical flux and particle deposition in spacer-filled channels, Journal of Membrane Science, 214, (2003) 165-178.
[11] B. Espinasse, P. Bacchin, P. Aimar. Détermination du flux critique : un outil pour la maîtrise du colmatage ?, in SFGP (Ed.), Récents progrès en génie des procédés, Lavoisier, Paris, 2003, pp. 483-49.
List of captions
Figure 1. Distribution of local critical flux, j crit, along the membrane, z/L, induced by the
growth of the boundary layer thickness, δ. The critical Péclet number, eq. 1, is assumed constant along the membrane surface.
Figure 2. Evolution of the permeate flux as a function of trans-membrane pressure (TMP) according to eq. 10. Limiting flux and critical flux are respectively 7.5 10-6 and 5 10-6 m/s.
Figure 3. Distribution of local flux, j, along the membrane, z/L, for three values of trans-membrane pressure corresponding to mean permeate fluxes given by figure 2. The dashed line represents the value of local critical flux along the membrane.
Figure 4. Variations of the resistance ratio, Rc/Rm, (deposit resistance over the membrane
resistance).
a) Mean values as a function of the trans-membrane pressure, TMP.
b) Local values distribution along the membrane length, z/L, for three values of trans-membrane pressure.
Fig. 1 P. BACCHIN
0 0.2 0.4 0.6 0.8 1
z/L
δ
Fig. 2 P. BACCHIN
0.0
2.5
5.0
7.5
0
0.05
0.1
0.15
0.2
TMP (MPa)
J (
1
0
-6m/
s
)
J
critJ
limFig. 3 P. BACCHIN