UNIVERSITÉ DE MONTRÉAL
MEASURES OF CRITICAL INFRASTRUCTURE VULNERABILITY TO DESTRUCTIVE EVENTS
LUCAS IULIANI
DÉPARTEMENT DE MATHÉMATIQUES ET DE GÉNIE INDUSTRIEL ÉCOLE POLYTECHNIQUE DE MONTRÉAL
MÉMOIRE PRÉSENTÉ EN VUE DE L’OBTENTION DU DIPLÔME DE MAITRISE ÈS SCIENCES APPLIQUÉES
(GÉNIE INDUSTRIEL) DÉCEMBRE 2016
UNIVERSITÉ DE MONTRÉAL
ÉCOLE POLYTECHNIQUE DE MONTRÉAL
Ce mémoire intitulé :
MEASURES OF CRITICAL INFRASTRUCTURE VULNERABILITY TO DESTRUCTIVE EVENTS
présenté par : IULIANI Lucas
en vue de l’obtention du diplôme de : Maitrise ès sciences appliquées a été dûment accepté par le jury d’examen constitué de :
M. JOANIS Marcelin, Ph. D., président
Mme DE MARCELLIS-WARIN Nathalie, Doctorat, membre et directeur de recherche M. GALBRAITH John W., D. Phil., membre et codirecteur de recherche
DEDICATION
“You should call it entropy, for two reasons. In the first place, your uncertainty function has been used in statistical mechanics under that name, so it already has a name. In the second place, and more importantly, nobody knows what entropy really is, so in a debate you will always have the advantage.”. —John Von Neumann
ACKNOWLEDGEMENTS
This graduate research would not have been possible if not for the guidance and encouragement of Professor John W. Galbraith. His sustained dedication—despite his many more pressing engagements and bloated inbox—was incredibly appreciated. May the end of this research mark the start of a new friendship. Here’s to many coffees together in the future.
Special thanks are also due to Professor Nathalie de Marcellis-Warin, without whom my time in graduate school would not have been nearly as interesting or inspiring. The number of graduate students that gravitate towards her, eager to take part in her esearch and learn from her unique experiences, are a testament to her charisma and intellect.
Lastly, and most importantly, thank you to the family and friends at my back. Your patience, cheer, love and encouragement kept me typing during those slower days.
RÉSUMÉ
Les infrastructures critiques sont les actifs physiques qui fournissent aux sociétés modernes les services et besoins nécessaires pour le bon fonctionnement d’activités sociales et économiques essentielles. L'importance de ces infrastructures complexes est largement reconnue et la nécessité de protéger ces réseaux contre des événements destructifs—intentionnels ou accidentels—attire l'attention de plusieurs chercheurs et experts en sécurité. Il est également bien reconnu que le coût et les efforts associés à la protection totale représentent un énorme défi. La société réalisera son plus grand retour sur investissement en identifiant, en priorisant et en protégeant stratégiquement les actifs les plus vulnérables de son portefeuille d'infrastructures. Cela implique la nécessité d'une méthodologie de sélection permettant de cibler les actifs les plus cruciaux et de mesurer efficacement la vulnérabilité globale d'un réseau donné, ce qui nous permettra d'évaluer les niveaux de risque actuels et d'évaluer les améliorations techniques proposés. Le travail à suivre tente de mesurer la robustesse des systèmes d'infrastructures critiques en utilisant une approche basée sur les conséquences, évaluant la fonctionnalité de ces réseaux suite à la survenance d'un événement destructeur. Pour ce faire, des applications empiriques de deux approches différentes—une première utilisant la méthodologie fondée sur la théorie des réseaux et une deuxième méthodologie, proposé pour la première fois, fondée sur l'entropie—ont été réalisées sur les réseaux de transport d'électricité des quatre plus grandes provinces canadiennes en utilisant l'information disponible dans le domaine public.
Notre enquête sur les similitudes entre ces deux méthodologies distinctes n’a fourni aucune similarité définitive lors de la comparaison de la vulnérabilité des provinces, mesurée selon les différentes approches, mais a éclairée des avenues prometteuses pour de la recherche future.
ABSTRACT
Critical infrastructure systems are the physical assets that provide modern societies with the fundamental resources required to conduct essential economic and social operations, from power and electricity to drinking water and telecommunications. The crucial importance of these vast, complex and ubiquitous infrastructures is widely acknowledged and as such, the necessity to protect these networks from destructive events—both intentional and accidental—has garnered the attention of researchers and security experts alike. Similarly, it is also well recognized that the cost and effort associated with total protection presents an enormous challenge. Society will achieve its greatest return on investment by correctly identifying, prioritizing and protecting the most vulnerable assets in its infrastructure portfolio. This implies the need for a screening methodology by which we can target the most crucial assets, and effective metrics with which to gauge the vulnerability of a given network as a whole, allowing us to assess risk levels and evaluate proposed or completed engineering changes. The following work studies the robustness of critical infrastructure systems using a consequence-based framework, assessing the functionality of networks conditional on some destructive event having taken place. In order to do so, empirical applications of two different approaches—the network theory-based methodology and a novel entropy-based methodology—were carried out on the electrical transmission networks of the four largest Canadian provinces, using information available in the public domain.
Our attempt to investigate the similarities between the separate methodologies failed to provide any meaningful consistencies when comparing provinces’ robustness according to the different grading schemes, but did provide promising avenues for future research.
TABLE OF CONTENTS
DEDICATION ... III ACKNOWLEDGEMENTS ... IV RÉSUMÉ ... V ABSTRACT ... VI TABLE OF CONTENTS ...VII LIST OF TABLES ... X LIST OF FIGURES ... XI LIST OF SYMBOLS AND ABBREVIATIONS...XII LIST OF APPENDICES ... XIV
CHAPTER 1 INTRODUCTION ... 1
1.1 Critical infrastructure systems ... 1
1.2 Threats to critical infrastructure ... 3
1.2.1 Physical threats ... 3
1.2.2 Cyber threats ... 4
1.3 Critical infrastructure protection ... 6
1.3.1 Reliability theory ... 7
1.3.2 Resilience ... 8
1.3.3 Robustness ... 10
1.4 Research objectives ... 11
CHAPTER 2 LITERATURE REVIEW ... 13
2.1 Economic theory-based approaches ... 13
2.1.2 Computable General Equilibrium models ... 15
2.2 Agent-based approaches ... 16
2.3 System dynamics-based approaches ... 18
CHAPTER 3 NETWORK SCIENCE ... 20
3.1 Historical review ... 21
3.2 Fundamentals of network theory ... 23
3.2.1 Network characterization ... 25
3.2.2 Network Analysis ... 32
3.2.3 Applications to critical infrastructure vulnerability ... 38
CHAPTER 4 ENTROPY-BASED APPROACH TO ROBUSTNESS ... 40
4.1 Entropy-based model of robustness ... 40
4.1.1 Properties of measures ... 41
4.1.2 Measures of robustness ... 44
CHAPTER 5 APPLICATION TO ELECTRICAL INFRASTRUCTURE... 49
5.1 Network theory-based approach ... 49
5.1.1 British Columbia ... 50 5.1.2 Ontario ... 51 5.1.3 Quebec ... 54 5.1.4 Alberta ... 56 5.1.5 Network Characteristics ... 59 5.1.6 Network Analysis ... 60 5.2 Entropy-based approach ... 64 5.3 Discussion ... 67
6.1 Future research ... 70
6.1.1 Improvement ... 71
6.1.2 Future development ... 71
BIBLIOGRAPHY ... 73
LIST OF TABLES
Table 1.1: Relationship between Aspects of Resilience and Resilience-Enhancing Measures ... 9
Table 3.1: Degree and betweeness centrality rankings of graph B1 ... 34
Table 3.2: Degree and betweeness centrality rankings of graph B2 ... 34
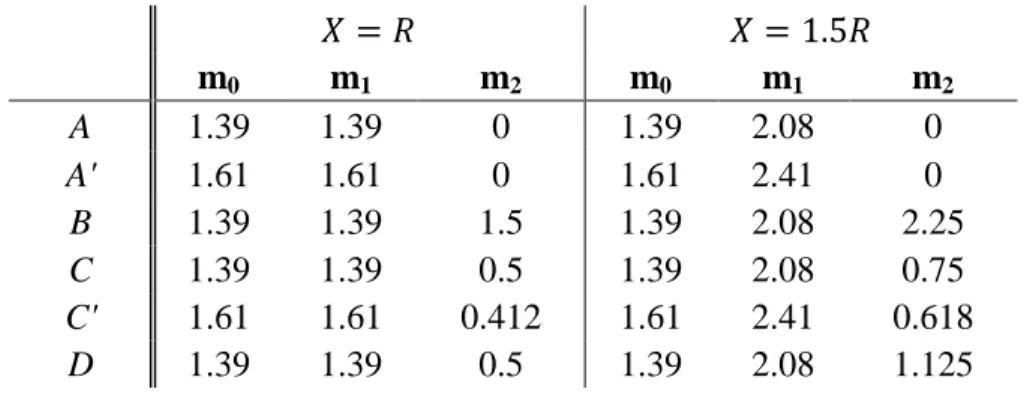
Table 4.1: Values of measures m0, m1 and m2 for sample system structures ... 48
Table 5.1: Basic properties of empirical networks ... 59
Table 5.2: Vulnerability Scores ... 63
Table 5.3: Measures m0, m1 and m2 for Canadian power grids ... 67
LIST OF FIGURES
Figure 1.1: Prioritized list of critical infrastructure sectors ... 2
Figure 1.2: Aspects of Resilience and the Timing of an Adverse Event ... 9
Figure 3.1: Euler's simplification of the Konigsberg bridge problem ... 21
Figure 3.2: Graph G - an unweighted and undirected graph ... 24
Figure 3.3: Graphs A1 and A2 ... 29
Figure 3.4: Graph B1and B2 ... 34
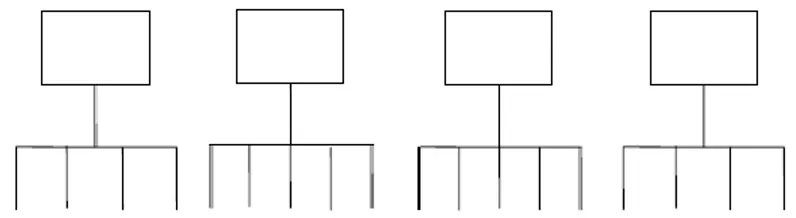
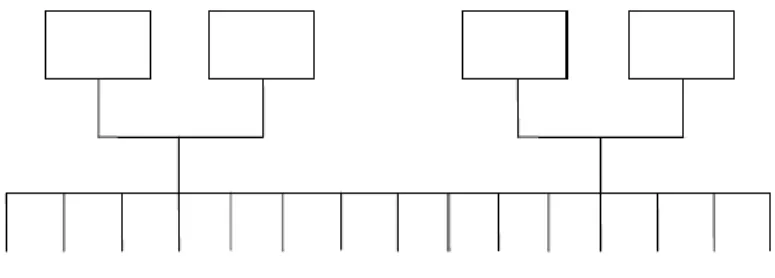
Figure 4.1: Example System Structures A and A' ... 41
Figure 4.2: Example System Structure B ... 42
Figure 4.3: Example System Structure C ... 42
Figure 4.4: Example System Structure C' ... 43
Figure 4.5: Example Structure System D ... 43
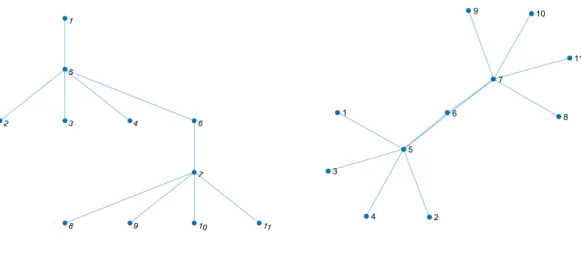
Figure 5.1: B.C. Bulk Transmission System ... 50
Figure 5.2: Centrality scores - B.C.'s Bulk Transmission Grid ... 51
Figure 5.3: Ontario Bulk Transmission System ... 53
Figure 5.4: Centrality Scores - Ontario's Bulk Transmission System ... 54
Figure 5.5: Quebec's Bulk Transmission System ... 55
Figure 5.6: Centrality Scores – Quebec’s Bulk Transmission System ... 56
Figure 5.7: Alberta's Bulk Transmission System ... 57
Figure 5.8: Centrality Scores - Alberta's Bulk Transmission System ... 58
Figure 5.9: Node degree distributions ... 59
Figure 5.10: Connectivty Loss (y-axis) according to Fraction of nodes removed (x-axis) ... 62
Figure 5.11: CDFs of proportionate sources of supply (xi/X) of Canadian power grids ... 65
LIST OF SYMBOLS AND ABBREVIATIONS
AG Adjacency matrix of graph G
aij Adjacency matrix value for nodes i and j
BG Incidence matrix of graph G
bij Incidence matrix value for nodes i and j
bi Betweeness centrality of node i
ci Closeness centrality of node i
C Clustering coefficient CAS Complex adaptive systems CGE Computable general equilibrium CI Critical infrastructures
D Graph diameter
di Node degree
dG Average degree
dij Geodesic, or shortest path δij Kronecker delta
E Set of edges E
Eglob Network efficiency
ei Individual edge
ei Eigenvector centrality of node i
G Graph G
H Entropy
ki Node degree
Li Loss of supply resulting from destruction of site i L-1 Harmonic mean M System robustness M Meshedness coefficient m Network size m0 Entropy of sources
m1 Re-scaled entropy of sources
m2 Proportionate required capacity
n Network order
π Probability of new node connection to existing node
P System reliability
pi Individual component reliability
R System robustness
R Total required supply
ri Remaining proportion of required supply
r Assortativity coefficient
S System resilience
σ(ρ) Connectivity loss after removal of ρ fraction of nodes
V Set of vertices V
vi Individual vertex
V System vulnerability
X Total supply available
LIST OF APPENDICES
APPENDIX A - SYSTEM DIAGRAMS ... 83 APPENDIX B – CENTRALITY SCORES ... 87
CHAPTER 1
INTRODUCTION
The developed world relies on the rapid, reliable and inexpensive delivery of goods and services. Each day, billions of dollars in trade are secured onto cargo ships and make their way across the globe, navigating the ocean’s network of shipping lanes to their final port of delivery. Deep beneath the surface, fiber optic cables spanning the distances between continents provide virtually all of the world’s reliable means of telecommunications, such as the Internet. This Internet service in turn goes on to help supervise, control and automate many of the supply chains that make up our utilities infrastructures, such as natural gas or oil pipelines and power grids. Together, these systems have been optimally designed and operate in tandem in order to provide the fundamental resources that keep our economies moving and societies functioning.
While the efficiency of these economic arrangements is among the primary focus areas of economic research, it is reasonable to ask whether improvements in productivity, delivery or overall efficiency have been accompanied by changes in vulnerability of output to catastrophic events. These crucial structural elements underlying economic activity may be affected by destructive events such as extreme weather, accidents or terrorist activity. In fact, there have been a number of documented examples in which economic activity at the level of a city has been severely disrupted by such events. While we cannot measure all the elements relevant to the robustness of economic activity, it is reasonable to assume that we can characterize the robustness of systems whose failure has been responsible for major economic disruptions in the past. Put simply, if we can measure the robustness of these crucial infrastructure elements, we will have some insight about the robustness of the broader economy that depends on them.
1.1 Critical infrastructure systems
Critical infrastructures (CI) are the physical assets that supply modern societies with the goods and resources required to perform everyday economic and social activities. This definition can be understood to include individual sectors of basic economic activity, such as power, energy, water distribution, telecommunications and others, as well as the individual components that make up these complex systems, such as dams, pipelines, utilities grids, radio towers, etc. In this contemporary globalized and interconnected environment, we can safely assume that our
increased reliance on critical infrastructure systems, coupled with their sprawling growth and continued degradation, gives rise to a potentially unprecedented level of vulnerability.
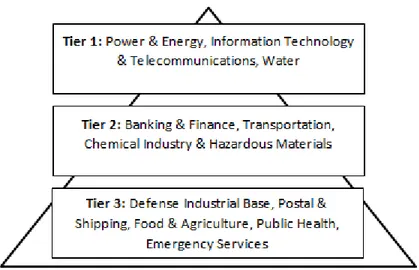
The importance of these infrastructures has long been understood. In Presidential Executive Order 13010, issued in July 1996, President Bill Clinton stated that “Certain national infrastructures are so vital that their incapacity or destruction would have a debilitating impact on the defense or economic security of the United States. These critical infrastructures include telecommunications, electrical power systems, gas and oil storage and transportation, banking and finance, transportation, water supply systems, emergency services (including medical, police, fire and rescue), and continuity of government” (Executive Office of the President, 1996). Naturally, other nation states in the developed world grapple with similar technological risks. More detailed lists of these essential assets have since been proposed, grouping together individual CI sectors into prioritized tiers which attempt to reflect the logical and functional dependencies between sectors, in that the outputs of certain processes provide the inputs to others (Lewis, 2006).
Figure 1.1: Prioritized list of critical infrastructure sectors
Additionally, it has become common practice in modern policy and academic research to include lists of Key Assets alongside summaries of CI sectors. As defined in the 2003 National Security Strategy for the Physical Protection of Critical Infrastructures and Key Assets, Key Assets are the individual physical targets or “high profile events” whose attack could result in large-scale causalities and destruction, but also “profound damage to […] national prestige, morale and confidence” (Department of Homeland Security, 2003). While, individually, certain physical Key
Assets such as dams and nuclear power plants may not be vital to the continuity of critical services, a successful attack may incur significant loss of life or other long-term, adverse public health and safety concerns. Other Key Assets such as national monuments, historical attractions and icons are said to hold “symbolic” value, and their destruction would result in the decline in the public’s moral and sense of safety and wellbeing.
Executive Order 13010 went on to highlight the need for cooperation between the public and private sectors in the development of a strategy for the protection of the critical assets, given that the bulk of these infrastructures are both owned and operated by private industry. In fact, it is estimated that 85% of all CI assets within the United States are held and managed by private business (Brown, Carlyle, Salmerón, & Wood, 2005). As it will become clear in subsequent sections, the information required for the development and implementation of protection methodologies makes the cooperation between government and industry necessary.
1.2 Threats to critical infrastructure
Lastly, and perhaps most importantly, President Clinton established a framework describing the two categories of threat vectors which present risks to CI systems: physical threats and cyber threats. Physical threats are the more conventional vectors that put at risk the integrity of tangible property, while cyber threats are the “threats of electronic, radio-frequency, or computer-based attacks on the information or communications components that control critical infrastructures.”
1.2.1 Physical threats
Physical threats to critical infrastructure are those that cause damage to tangible assets. This definition includes both intentional acts—such as vandalism, sabotage and terrorism—as well as unintentional damage caused by malfunction, natural hazards and technological or industrial accidents. While there may exist certain similarities in the overall outcomes of both hazards and directed attacks, the main distinction is the presence of an intelligent and ill-intention actor, aiming to achieve maximal loss of life or social disruption. It is therefore straightforward to assume that the damage caused by studied and directed attacks will generally cause greater disruption than those caused by the randomness of accidental and undirected events. Any accurate modeling or simulation technique should reflect this.
When considering physical threats to CI systems, non-state actors who view attacks on critical infrastructure as a means of achieving various political or ideological objectives are generally the object of greatest concern. In fact, well known terrorist organizations have advocated such attacks for years. An al-Qa’ida training manual, seized by the Manchester Metropolitan Police during a 2003 raid, notes as its primary mission the “overthrow of godless regimes [by] gathering information about the enemy, the land, the installations, and neighbours [and] blasting and destroying places of amusement, embassies, vital economic centers [and] bridges leading into and out of cities” (United States Air University, 2003).
Energy infrastructure in particular has a long history of being viewed as high-value targets for violent non-state actors. Information compiled by the Energy Infrastructure Attack Database (EIAD) has shown that there were, on average, 400 annual attacks carried out on energy infrastructures over the 2003-2013 timeframe (Giroux, 2013). Given their vital economic importance, striking these assets makes for an effective means of airing grievances and adversely impacting economy and security while garnering international media coverage. The vastness of the infrastructures, which can span long distances, provides a sizeable attack surface, contributing to their attractiveness. The raiding and ensuing hostage crisis at the Tigantourine natural gas facility in Amenas, Algeria in January 2013 was among the most high-profile of such events. A more recent example of politically-motivated attacks directed at energy infrastructure is the November 2015 sabotage of major electrical transmission towers by anti-Russian activists, which caused blackouts affecting 2 million people over several days in Crimea. Here, the objective was not loss of life, but rather a protest of the region’s annexation weeks earlier.
Assuring the physical security of CI systems is a challenging endeavour given the expansiveness of these infrastructures, and the cost associated with methods limiting access to them, such as underground installations, fencing, barricading, other hardening and physical surveillance.
1.2.2 Cyber threats
The rise of cyber security concerns, in the realm of CI protection as in all others, is characteristic of the 21st century international security landscape. And while the term “cyber threats” is typically used to include criminal activities such as fraud, espionage and theft broadly, it is used
here in reference to all electronic, radio-frequency or computer threats directed at control and communication CI networks and subsystems.
As with physical threats, defending against cyber attacks is made difficult by the enormity of the attack surface at which opponents may take aim. This phenomenon was in part enabled by the modernization of industrial processes and the growing trend towards the adoption of digital technologies.
A notable cyber-attack target in the case of CI systems is the industrial control and automation technologies employed throughout many different sectors. These electrical subsystems are used in the automated operation of industrial process equipment, such as machinery (boilers, pumps, valves, etc.) and electrical components (switches, interrupters, variable frequency drives, etc.). The use of industrial control systems obviously provides massive gains in efficiency, speeding up reaction time, automating changes in processes and limiting human intervention and error. Unfortunately however, it also provides hackers with well-known points of access.
The Stuxnet computer virus, now the world’s most infamous cyber weapon, was built with the purpose of targeting and subverting industrial control equipment. Believed to have been jointly developed by American and Israeli intelligence and defence agencies, the computer worm infiltrated the programmable logic controllers (PLCs) used as part of the Iranian nuclear program. Once embedded in the Iranian network, the weapon gathered data on the industrial processes taking place before commanding fast-spinning centrifuges to overrun and self-destruct over time. Perhaps most impressively, the bug did so while displaying normal conditions to the system operators. Studies into the implications of the Stuxnet virus on the security of industrial controls systems have indicated that the worm may be used as a template for future intrusions in various sectors (Karnouskos, 2011). In the case of the Iranian nuclear program, it is believed that Stuxnet was introduced into the target environment via an infected external multimedia device, such as a USB flash drive. However, there exist alternative points of entry which may be exploited in order to gain access to closed networks.
One such alternative is the direct tampering of industrial control components. In his book At the
Abyss, Thomas C. Reed, former Secretary of the U.S. Air Force and advisor to President Ronald
Reagan, claimed that in 1982, the United States successfully inserted malicious software into control equipment purchased by the Soviet Union through Canadian suppliers. When deployed,
the software commanded the pumps and valves installed on a section of a Trans-Siberian gas pipeline to produce pressures exceeding design specifications, resulting in what Reed called “the most monumental non-nuclear explosion and fire ever seen from space.”
Connections to external networks such as the Internet—commonly used as a method of information and data communication—provide yet another point of access for hackers.
The level of sophistication required in the execution of such cyber-attacks leads experts to believe that the implication of state sponsors is required. As more sophisticated and subversive offensive capabilities are developed, the use of cyber-attacks is likely to become an interesting instrument of war for nation states, given the difficulty with attributing blame. While other overt means of coercion such as blockades and sanctions have long existed, cyber-attacks directed at economic interests provide a politically convenient form of economic warfare.
1.3 Critical infrastructure protection
In seeking to defend against physical and cyber threats to critical infrastructure, the cost— financial and social—associated with absolute protection is neither feasible nor desirable. The physical hardening of every last electrical distribution pylon or inch of pipeline does not represent a realistic engineering challenge, and the transformation of modern societies into police states, where barricades and armed guards are posted at every asset of value, is an equally unattractive outcome. Effective attempts at protecting critical infrastructure therefore rest on the careful prioritization and targeted defense of the most crucial assets of a given system. There exist various diverging approaches to assessing the importance of assets included throughout the associated literature. Broadly speaking, diverging asset prioritization schemes are divided along the two ends of the risk assessment spectrum.
Traditional probabilistic risk assessments seek answers to three fundamental questions: What can go wrong? How likely is it to go wrong? How bad would it be if it did? Mathematically,
𝑅𝑖𝑠𝑘 = 𝑃 ∗ 𝐶
where 𝑃 is the probability of an unwanted or adverse event occurring and 𝐶, the associated negative impact. Risk, as defined above, is distinct from its usual meaning in economic or financial contexts, where it values likelihood of deviation from an expected return or macroeconomic condition. Within engineering frameworks, risk estimates expected loss. As
such, efforts at measuring the level of risk—or vulnerability—of a given system must therefore make assessments with respect to the variables above, either attempting to predict the likelihood of failure or quantifying the negative consequences of a given event taking place. Again, the associated literature provides diverging opinions on the two distinct approaches.
1.3.1 Reliability theory
A more traditional approach at addressing the problem of CI protection is contained in the engineering literature in the form of reliability engineering. Reliability engineering is concerned with the probabilistic estimation of component functionality or, inversely, its likelihood of failure, in an effort to characterize the reliability of systems as a whole. Reliability engineers, for instance, study the dependability or availability of physical assets, which is to say their functionality over a given period of time or at a specific point in time, respectively.
A system is said to have failed once it no longer provides a specified level of performance. Overall system performance is necessarily conditional on component functionality, and different measures of reliability can be considered for serial components and parallel components.
A serial system is one in which an input passes through each of a number of components in sequence, such that each one must be functioning for the system to function. Conversely, a parallel system is one in which an input may pass through any one of a number of components, such that only one of the components needs to be functioning for the system to function. Here, we use 𝑃 to denote the reliability of a system and let 𝑝𝑖, 𝑖 = 1,2, … 𝑁 denote the reliability of each of the 𝑁 components of the system. For a serial system with independent probabilities of component reliability,
𝑃 = ∏ 𝑝𝑖 𝑁
𝑖
(1)
whereas for a parallel system with independent probabilities of component reliability, reliability is equal to 1 minus the probability of all parallel elements failing, such that
𝑃 = 1 − ∏(1 − 𝑝𝑖) 𝑁
𝑖
As most real world systems are often composed of both serial and parallel elements, overall reliability can be computed from the individual reliabilities of the serial or parallel components. While estimating reliability is valuable in the context of a physical structure such as the electricity grid—for example, in the scheduling of preventative maintenance efforts—there are several reasons why this approach may be insufficient in characterizing the vulnerability of large complex systems. First, actual failure probabilities may be difficult to characterize. The probability of an earthquake or other natural disaster, for example, is very difficult to estimate accurately. Second, some destructive events of the type that interest us may not be well characterized by probability distributions, as they result from deliberate acts of sabotage or terrorism. Lastly, the probability of failure of a system is only one quantity that we want to discover. We are also interested in the level of functionality that remains following some destructive event and component failure.
1.3.2 Resilience
As the problem of critical infrastructure vulnerability has gained interest in recent years, the concept of resilience has become a prominent approach to assessing the risk of both assets and supply chains, but also broader communities and economic sectors.
As a recent field of study, the idea of resilience has continued to evade a single canonical definition, with researchers prioritizing different aspects of the risk spectrum, and choosing to measure resilience according to diverging approaches. A recent publication from the Argonne National Laboratory entitled Resilience: Theory and Applications provides comprehensive overview of the varied literature on the topic, including both definitions and metrics (Carlson et al., 2012).
As the authors demonstrated, many studies have defined resilience as the ability of a system to recover from the adverse consequences of a disruptive event. However, such definitions fail to acknowledge the effects of preventative actions taken in order to reduce the likelihood or impact of a possible catastrophic event. Taking anticipative actions into account, resilience can be defined as: “the ability of an entity—e.g. an asset, organization, community, region, etc.—to anticipate, resist, absorb, respond to, adapt to and recover from a disturbance.”
Figure 1.2: Aspects of Resilience and the Timing of an Adverse Event
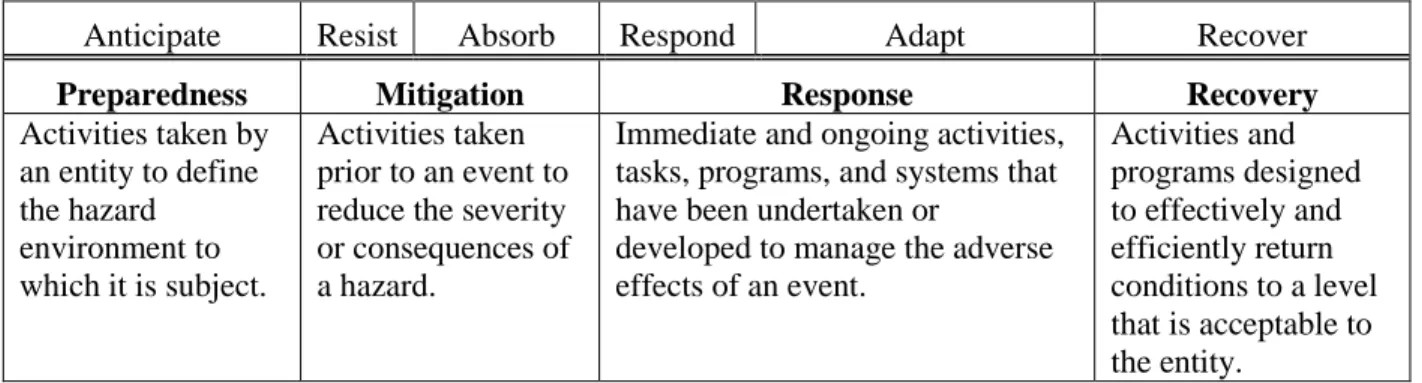
The text goes on to highlight the importance of having a sound methodology for the measurement of asset/facility resilience, given its implications on the resilience of the broader system. Table 2 below provides Argonne’s framework for understanding how the four fundamental resilience-enhancing measures—preparedness, mitigation, response and recovery—contribute to a given asset’s overall resilience.
Table 1.1: Relationship between Aspects of Resilience and Resilience-Enhancing Measures Anticipate Resist Absorb Respond Adapt Recover
Preparedness Mitigation Response Recovery
Activities taken by an entity to define the hazard environment to which it is subject. Activities taken prior to an event to reduce the severity or consequences of a hazard.
Immediate and ongoing activities, tasks, programs, and systems that have been undertaken or
developed to manage the adverse effects of an event. Activities and programs designed to effectively and efficiently return conditions to a level that is acceptable to the entity.
The most frequently cited metric of both component and system resilience is time. More specifically, resilience engineers and analysts are concerned with the delay between the initial disruptive ent and the return to normal operations, or Time to Recovery. For example, a recent literature review published by the United States Environmental Protection Agency presented generic time-based resilience assessments applicable to water distribution networks. These metrics, presented in (Attoh-Okine, Cooper, & Mensah, 2009), (Ayyub, 2014) and others, compute resilience as a function of time (𝑄(𝑡)). Resilience (𝑆) can be tracked and measured as:
𝑆 = ∫ 𝑄(𝑡)𝑑𝑡 𝑡1
𝑡0
100(𝑡0− 𝑡1)
(3)
where 𝑡0 is a time before the hazardous event, and 𝑡1 is a time after the event. The above equation allows for a variety of metrics to be used for 𝑄(𝑡), so long as the variable used is affected by both the initial disruptive event and the restorative measures undertaken.
As with reliability, measures focused on resilience provide worthwhile insights as to the vulnerability of systems. Perhaps most importantly, time-based resilience measures allow system operators to gauge the impact of failures on end-users, and on how to best allocate capital in order to reduce delays until return to normal operations. In fact, for certain CI sectors, such as financial services and emergency response, it is clear that time-based measures provide the most worthwhile consequence assessments.
1.3.3 Robustness
Lastly, a final CI risk assessment approach is one that emphasizes the consequential aspect of the risk equation. As mentioned, while estimations of failure probabilities and recovery times are useful in the context of CI operations and emergency preparedness, we are also interested in the performance of CI systems conditional on a serious destructive event having taken place. Reliability and resilience engineering approaches prevent analysts and researchers from providing consequence-based vulnerability metrics that reflect the negative impacts of destructive events on end-users directly in terms of loss of supply.
There are a number of features that can limit the impact of a destructive event occurring within a given system. For instance, the adverse effect will tend to be less important if another part of the system can directly replace the output of the affected components. Similarly, the impact will be lower if the destructive event can be localized to the portion of the system in which it arose, such that the error propagation is limited. The same can be said for systems where damaged components can easily be replaced, or where neighbouring components can be adapted quickly. Any adequate measure of system robustness should capture these elements.
Broadly speaking, robust networks or systems are described as those that tolerate faults (Schuster, 2008) and provide low performance variation when conditions are perturbed (Gaury & Kleijnen, 1998). The notion of engineering design geared towards the reduction of performance
sensitivity to variation in conditions, as opposed to the pursuit of eliminating variation altogether, is attributed to Taguchi, for example in (Taguchi & Clausing, 1990). These definitions and features of robust system design have become commonly accepted throughout substantial engineering literatures (Sussman, 2008).
In the following work, we adopt robustness as a measure of remaining capacity and output following destructive events, arguing that variability of supply provides the most insightful and generalizable measure of CI vulnerability. Naturally, a complete understanding of a network’s tolerance to component breakdown requires insights into its physical configuration, including vulnerable points such as bottlenecks, production sites and redundant features, as well as its inherent supply and demand dynamics.
1.4 Research objectives
The following research aims to contribute—however modestly—to the ongoing scientific efforts dedicated to the protection of critical infrastructure networks, using robustness as the measure of overall system vulnerability. Given the vastness and complexity of these systems, we recognize that theoretical and practical advances in both critical asset prioritization and overall system risk assessment methodologies are required to maximize society’s efforts and return on investments. Understanding how to best prioritize and defend these infrastructural elements is the aim of this research paper, and our objectives towards achieving this goal can be described thusly:
a. to compare—at a theoretical level—network-based measures (a prominent approach to CI protection) with measures based directly on loss of output, such as entropy-based measures;
b. to determine whether these measures tend towards similar conclusions, despite valuing different aspects of overall CI system functionality, and;
c. to determine empirically whether any substantial differences can be seen when applying these two different approaches to the same real-world systems, and if so to try to interpret these differences.
As such, the subsequent paper is organized in order to convey an understanding of recent scientific advances in the field of CI protection and an exploration of its potential for future improvement.
Chapter 2 presents a critical overview of the current CI modeling and analysis methodologies, as they appear throughout the current cadre of academic and professional research, including economic, agent and system dynamics-based approaches. This literature review is continued in Chapter 3, which focuses solely on network theory-based methods of critical asset prioritization and system vulnerability assessment. Chapter 4 presents a novel approach to the challenge of CI protection, drawing from the field of information theory. Lastly, Chapter 5 is the paper’s chief original contribution, and presents an empirical application of the network and information-theory based methodologies by evaluating the vulnerability of the electrical transmission networks in Canada’s four largest provinces—British Columbia, Ontario, Alberta and Quebec— before concluding with a comparative analysis of the benefits and drawbacks of these two main approaches.
CHAPTER 2
LITERATURE REVIEW
Given their scope and complexity, the development of modeling and simulation methods is often seen as a prerequisite to the real-world design, maintenance, operation, improvement or protection of CI systems. The following section reviews the existing models proposed throughout the CI literature and broadly groups the current schools of thought into three categories: economic theory-based approaches, agent-based approaches and system dynamics-based approaches. Rather than providing a complete and in-depth overview of existing methods, this section is intended to serve as an introduction by highlighting the fundamentals, applications, strengths and weaknesses of available and ongoing research. It should also be noted that the literature review is continued in the subsequent chapter, which is dedicated to network science and provides a more substantive summary of the field’s relevant applications. As the reader will come to understand, empirical applications analyzed later in this work rely on the fundamentals of graph theory and may benefit from a more in-depth introduction to its main tenants and recent advances.
2.1 Economic theory-based approaches
Economic models generally seek simulate the behaviours of principal economic actors including households, producers, government regulators and other decision makers as they exchange goods, services and other resources. Such models can be useful in the modeling of critical infrastructure systems, in that the actions of such stakeholders—producers, consumers and operators—are critical in the proper functioning of balanced and optimal infrastructures. Below, we present the fundamentals and recent advances for two distinct economic modeling approaches: Input-Output models and Computable General Equilibrium models.
2.1.1 Input-Output models
The Input-Output economic model was first submitted by Nobel laureate Wassily Leontief in 1951 (Leontief, 1986). The quantitative framework he proposed depicted inter-relations among different industry sectors for a given region, showing how output from one industrial sector may become an input to another. The model comes together in the form of matrix, where 𝑛 sectors of an economic model are considered as variables of a set of linear equations, with each sector 𝑖 producing a single good 𝑥𝑖. It is assumed that producing a single unit from sector 𝑖 requires 𝑎𝑖𝑗
units delivered from sector 𝑗 and that interdependency between sectors forces them to produce and consume outputs mutually, while also satisfying a demand 𝑑𝑖. The output of sector 𝑖 becomes:
𝑥𝑖 = 𝑎𝑖1𝑥1+ 𝑎𝑖2𝑥2+ ⋯ + 𝑎𝑖𝑛𝑥𝑥+ 𝑑𝑖 (4)
By defining 𝐴 as the matrix of coefficients 𝑎𝑖𝑗, 𝑥 as the vector of total output and 𝑑 as the vector of aggregate demand, the expression for a complete economy becomes:
𝑥 = 𝐴𝑥 + 𝑑 (5)
Following basic re-formulation, it becomes clear that, given a reversible (𝐼 − 𝐴) matrix, the model is a linear system of equations with a unique solution. With a known final demand 𝑑, the required output can be found.
While the application of the Input-Output (IO) model is widespread, its use in the field of critical infrastructure protection is relatively recent. Its first adaptation for the study of failures or
inoperabilities was originally proposed by Haimes and Jiang (Haimes & Jiang, 2001). Where the
traditional IO model was concerned with 𝑛 sectors and 𝑖 resources, their infrastructure model considered a system of 𝑛 critical complex intraconnected and interconnected infrastructures, with the output being their risk of inoperability that can be triggered by one or multiple failures due to complexity, accidents, or acts of terrorism. Inoperability is defined as the inability of a system to complete its intended function, measured in this instance as a continuous variable between 0 and 1, with 0 representing complete functionality and 1, complete failure. In keeping with the established Leontief model, the Inoperability Input-Output model (IIM) can be formulated as:
𝑥 = 𝐴𝑥 + 𝑐𝑘 = (𝐼 − 𝐴)−1𝑐𝑘 (6)
where 𝑥𝑗, 𝑗 = 1,2, … , 𝑛, is the overall risk of inoperability of the complex intraconnected and interconnected 𝑗th infrastructure; 𝑎𝑘𝑗 is the probability of inoperability that the 𝑗th infrastructure
contributes to the 𝑘th infrastructure due to the complexity of their interconnectedness and 𝑐𝑘 the additional risk of inoperability that is inherent in the complexity (i.e., intraconnectedness) of the 𝑘th critical infrastructure. As highlighted above, and assuming (𝐼 − 𝐴) is non-singular, the system of equations can be solved for the overall risk of inoperability of the infrastructures 𝑥.
As with the fundamental Leontief model on which it is based, a series of refined IIM models have subsequently been proposed. The demand-reduction IIM defines perturbations as the reduction of aggregate demand for a set of economic sectors in response to an event, and afterwards deduces the output reduction or inoperability of each involved interdependent economic sector (Santos & Haimes, 2004). Dynamic IIM refines the traditional model by integrating resilience coefficients for individual economic sectors (Lian & Haimes, 2006). Multiregional IIM expands the scope of the original model by including multiregional interdependencies based on the use of geospatial datasets (Crowther & Haimes, 2010).
Advocates of IIM-based modeling often highlight the intuitive interpretations of interdependencies offered by its different variations. Other major strengths of interoperability models are their accuracy in forecasting high-level error propagation among interconnected infrastructures and their insight as to effective mitigation efforts. These models also benefit from widely available existing datasets at both national and regional scales, such as the Bureau of Economic Analysis’s Benchmark Input-Output Data database, thereby facilitating their application. Often-cited applications of IIM-based models include studies of the financial effects of the US Northeast blackout of 2003 (Anderson, Santos, & Haimes, 2007), the catastrophic impact of US Gulf hurricanes in 2005 (Crowther, Haimes, & Taub, 2007), the resilience of telecommunications systems and power distribution infrastructure in the aftermath of Hurricane Katrina (Reed, Kapur, & Christie, 2009) and the effects of September 11th on the global airline industry (Santos, 2006).
The IIM models are, however, not without their weaknesses. While necessary input data is readily available, these datasets reflect the interdependency of sectors during normal economic operations, ignoring real-time infrastructure or industry outputs. IIM-based approaches fail to analyze the interdependencies that exist at the component level, providing instead a snapshot of aggregate for a given economic sector.
2.1.2 Computable General Equilibrium models
Computable General Equilibrium (CGE) models are often viewed as an improvement of the I-O models proposed by Leontief, as they possess the same fundamental features—such as the interdependency of economic sectors—but overcome several of its limitations, such as including the linearity of these interdependencies, and address the lack of behavioral responses to
fluctuations in market resources and prices (Rose, 1995). Within CGE models, producers’ production functions are modified to incorporate economic resilience, allowing for substitution analysis in cases of disruptions to normal market conditions due to external perturbations.
Several recent studies focused on CIS have used CGE as a means to estimate economics losses following disturbances, and to measure the effectiveness of proposed or implemented mitigation efforts.
Notably, work by Rose et al. analyzed the economic impacts of a hypothetical terrorist attack on the power distribution system of the city of Los Angeles. Economic losses were initially estimated at $20.5 billion, but reduced to $2.8 billion following the proposed (theoretical) implementation of various mitigation strategies, such as energy conservation, de-centralized onsite electricity generation and rescheduling of production (Rose, Oladosu, & Liao, 2007). As with traditional (𝐼 − 𝑂) models, the limitations of CGE models are that they provided a high-level, macroeconomic snapshot of the economy, at a discrete point in time and do not offer any insight as to component-level interdependencies or consequences of failure.
2.2 Agent-based approaches
Complex Adaptive Systems (CAS) are also considered among the most promising areas of research pertaining to the modeling of critical infrastructure systems. Within the theoretical CAS frameworks, different components—or agents—which have been programmed into a model according to a prescribed set of rules, interact together in ways that continuously remodel future outcomes. Each agent is said to be an entity with distinct location, capability and memory (Gell-Mann, 1994). The agent-based approach in the study of CAS adopts a bottom-up method and posits that complex behavior or phenomenon arises from many simple and individual interactions (Kaegi, Mock, & Kröger, 2009). This emergent behavior is characteristic of CAS models. Typically, CAS applications in the study of CIS use idealized networks (e.g. small-world networks) to represent infrastructure systems and components whose interdependencies are governed by empirical rules (Dueñas-Osorio, 2005). Perhaps most notably, CAS agent-based models have emerged as the preferred method of CIS modeling for several national laboratories and research centers within the United States.
In the late 1990s, the Sandia National Laboratories, whose chief mandate under the United States Department of Energy is the engineering and testing of non-nuclear components of the country`s nuclear weapons arsenal, developed their first full-scale CAS model. Dubbed Aspen, the model aimed to simulate the behaviors of a large number of individual economic decision-makers at a high level of detail. While imperfect, the model’s outputs in reaction to federal monetary policies provided a detailed analysis of the financial sector, including the banking sector and bond market (Basu, Pryor, & Quint, 1998). In December 2000, an improvement of the original model, titled
Aspen-EE (Electricity Enhancement), was Sandia’s first attempt at modeling infrastructure
interdependencies, with a focus on the electric power system, and included agents representing power markets and their reaction to power outages (Barton, Eidson, Schoenwald, Stamber, & Reinert, 2000). For both Aspen and Aspen-EE, the models proposed represented interactions between sectors, players and assets as so-called message-passing mechanisms, rather than modeling physical infrastructures themselves. A later model, CommAspen, was released in 2004, extended and modified the previous models by accounting for the telecommunications systems and its effect on the previously studied banking, finance and power networks (Cox, Barton, Reinert, Eidson, & Schoenwald, 2004). That same year, the N-ABLE model was published, this time integrating households and economic firms into the model as an added layer of detail (Eidson & Ehlen, n.d.) and in 2008, Sandia went on to study the specific threat of cyber-attacks on basic physical assets (Kelic, Warren, & Phillips, n.d.).
A second federal research center run by the United States Department of Energy, the Argonne National Laboratory, developed its first agent-based CIS model, the Spot Market Agent Research
Tool Version 2.0, in 2000. Unlike models previously developed by Sandia at that time, SMART II
took into consideration the physical layout—or topology—of power grids. Working closely with the Western Area Power Administration, one of the four power marketing administrations of the U.S. Department of Energy, Argonne’s model was capable of detecting the transmissions line configurations which would most likely lead to spikes in prices and therefore contribute to greater market price stability (M. J. North, 2001). An extension to the original model, called
SMART II++, was later developed, adding natural gas marketing and distribution agents to the
simulations. These individual infrastructures were then coupled together, in the form of gas-fired electricity generators, in order to allow for interdependency analysis (M. J. N. North, 2000). Completed simulations demonstrated the need to intelligently monitor the purchase of natural gas
destined for energy production, so as to avoid power network failures from cascading into the natural gas infrastructures.
Lastly, the Idaho National Laboratory proposed their first CIS modeling approach, called the
Critical Infrastructure Modeling System, in 2006 (Dudenhoeffer, Permann, & Manic, 2006). The
CIMS tool used 3D graphical representations of CIS components and their interdependencies in order to anfalyze potential cascades and consequences of their potential failures. In contrast to the models developed by their peers, CIMS modeled infrastructure topologies in great detail and provided decision makers with the ability to easily visualize these interdependencies and their consequences. It became clear to the developers however, that once CIS sizes and interdependencies became increasingly complex, visualization methods were no longer suitable for rigorous analysis.
Complex adaptive systems are ideal as a means to simulate critical infrastructure systems in that they allow for the modeling of various decision makers’ behaviours, system interdependencies and the effectiveness of proposed control strategies. Perhaps most importantly, CAS can be used in tandem with other modeling techniques to provide a more complete understanding of systems and the consequences associated with their failures.
2.3 System dynamics-based approaches
Systems theory is the science of understanding systems—i.e. sets of individual components which interact to form complex processes and complete a specific function—at a conceptual level, and across a broad spectrum of social and technological fields. Systems dynamics is the subfield of systems theory concerned with understanding the behaviour of complex systems over time, using stocks, flows, feedback loops and time delays to model different nonlinearities (MIT, 2016). Stocks are variables which can be quantified at a specific point in time, while flows are variables measured per unit of time. Feedback loops are the name of component outputs which are routed back as inputs, forming a circular process. This so-called feedback is characteristic of the system dynamics approach, and is particularly relevant in the study of self-regulating or self-correcting systems.
Put simply, while the agent-based approaches described above attempt to model the decision-making mechanisms of system subcomponents, systems dynamics models are interested in the processes occurring between them.
Originally developed by Jay Forrester in the 1950s to describe the dynamics of organizations, system dynamics modeling today provides a relevant, “blank canvas” approach to the modeling of CI interdependencies (Forrester, 1971) The most notable and frequently-cited application of systems dynamics modeling to CI protection is the Critical Infrastructure Protection/Decision Support System (CIP/DSS), developed by (Bush et al., 2005). As described by the authors, the tool models the interactions and dynamics of both the individual components and whole systems, according to their interdependencies. For example, “repairing damage to the electric power grid in a city requires transportation to failure sites and delivery of parts, fuel for repair vehicles, telecommunications for problem diagnosis and coordination of repairs, and the availability of labor. The repair itself involves diagnosis, ordering parts, dispatching crews, and performing work.”
The dynamics processes involved are modeled according to governing rules—e.g. differential equations—and the output metrics are often estimates of disruption to, say, health, economic or environmental effects.
A relevant application of the model is the analysis of Hurricane Katrina on critical infrastructures of Baton Rouge (Santella, Zoli, & Steinberg, 2011). In the study, authors provided a framework establishing the infrastructure systems which proved most resilient, offering policy and engineering avenues for improvement.
While the systems dynamics approach provides a flexible approach to CI modeling, an over-reliance on expert judgment and a failure to provide insights as to component-level performance render the model incomplete. As with CAS approaches however, systems dynamics models can easily be integrated into other modeling methodologies.
CHAPTER 3
NETWORK SCIENCE
Networks are intuitive structures with which to model the form and function of real-world systems and processes. From supply chains to financial institutions and disease transmission pathways, the number of systems involving the distribution of goods and services between individual components is seemingly endless. And while its list of applications is difficult to summarize, the study of network science as a scientific discipline is today defined along three main pillars of research.
First, considerable efforts are dedicated to the characterization of network structures. This subset of academic research relies heavily on the mathematics branch of graph theory and involves mapping out the physical configurations of complex networks with the specified aim of understanding how they emerge and develop over time. Advances in this field have led to network generation algorithms, which allow researchers to build and experiment with ideal synthetic networks governed by the same laws as their real-world social, technological or biological counterparts.
Second, considerable resources are dedicated to the analysis of networks and the processes occurring within them, using mathematical tools and statistical mechanics. Together with the first pillar of research, the tools developed arm the designers and operators working on these various complex systems with the analytic and predictive tools necessary to manage these networks, and provide insight as to their improvement and future development.
Lastly, once empirical information pertaining to such networks has been aggregated and characterized, it is reasonable to question the feasibility of the tools at hand, given the scale of data being treated and computing times of algorithms involved. The third school of research in network science devotes itself to the computational implementation of theoretical advances made in the field, addressing limitations in data mining, computing efficiency and data visualization techniques. This line of research is left to a different author, and will go unmentioned throughout this work.
The following section provides an overview of the school of thought called network science, including its history and fundamental theory, which is required in order to conduct a critical review of current network-based models in the field of CI protection.
3.1 Historical review
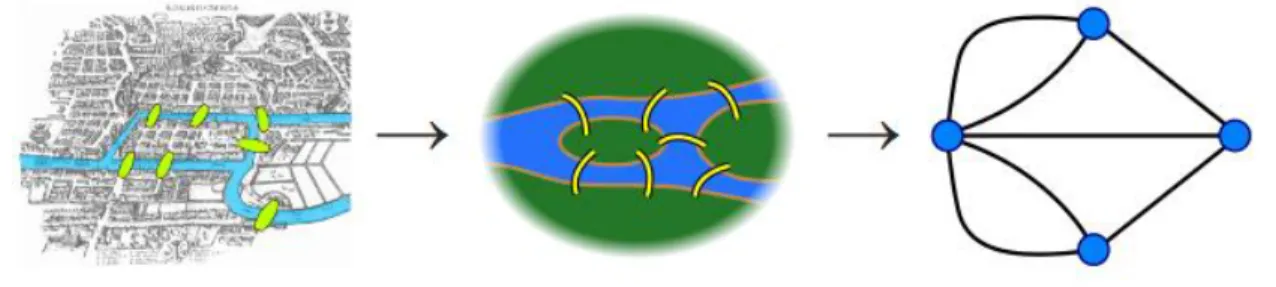
Any historical review of the discipline of network science begins with famed mathematician Leonard Euler’s resolution of the classic Konigsberg Seven Bridges problem in 1736. The problem challenged thinkers to find routes around Konigsberg requiring travelers to cross each of the city’s seven bridges only once. Euler’s analysis of the problem was the first to reformulate the challenge so as to summarize it to include only the individual lands masses, represented as points, and the links (bridges) connecting them, as illustrated in the figure below taken from (Wikipedia, 2016).
Figure 3.1: Euler's simplification of the Konigsberg bridge problem
In his paper on the topic, Euler laid down the fundamentals of graph theory and definitively demonstrated that the stated problem could not be solved (Sachs, Stiebitz, & Wilson, 1988). Subsequent improvements in the field attempted to emulate Euler’s approach, aiming to accurately model and understand the structure and dynamics of real-world networks.
Subsequent advances were not made until much later, as research into networks became common in the health, social and pure & applied sciences. As it will become clear throughout the following section, research into these real-world networks resulted in them now being considered as part of three separate camps—random networks, scale-free networks and small-world networks—each with unique characteristics.
Random networks, as their name suggests, are networks for which connectivity between a given
set of nodes occurs according to a random process, or other fixed probability distribution. A first random network model was proposed by Edgar Gilbert and described a wiring process by which each possible edge for a given set of nodes occurs independently with a probability between 0 and 1 (Gilbert, 1959). A second model for random networks was published contemporaneously by mathematicians Paul Erdos and Alfred Rényi, and described a connectivity model for which all
graphs possible given a fixed set of vertices and edges were considered equally probable (Erdös & Rényi, 1959). A main limitation of the ER model however, given its Poisson degree distribution, is that it fails to reflect the characteristics of certain real-world networks of interest.
One such characteristic is the presence of certain highly-connected “hubs” within networks. This phenomenon results in a Power Law degree distribution, as opposed to a Poisson distribution, and has clear repercussions on the function and robustness on the concerned systems. Recent study into these so-called scale-free networks began with the mapping of the World Wide Web led by researcher Albert Barabasi (Barabási & Albert, 1999). The Internet’s configuration, Barabasi noticed, indicated that certain key nodes within the system—presumably those performing essential functions—were disproportionality well connected when compared to others. Subsequent work demonstrated that this was true for a variety of complex biological, social and technological systems (Barabási, 2003). While previous models were composed of a fixed set of nodes and edges, Barabasi and Albert argued that these complex systems continue to grow over time and that new nodes would attach preferentially to pre-existing nodes of greater importance. To capture this selective growth pattern, the authors proposed a generative graph model, now known as the Barabasi-Albert model, where the probability (𝜋) of a new node connecting to an existing node 𝑖 depends on the degree 𝑘𝑖 of that node, such that:
𝜋(𝑘𝑖) = 𝑘𝑖
∑ 𝑘𝑗 𝑗 (7)
where 𝑗 represents all other pre-existing nodes (R. Albert & Barabási, 2002).
Finally, the Watts-Strogatz model, proposed in 1998, offered an algorithmic approach to building a final sub-category of graphs: small-world networks. As will be discussed below in greater technical detail, the small-world phenomenon was brought to prominence by social scientist Stanley Milgram in the now-infamous “six degrees of separation” experiment, and demonstrated that within certain networks, any two given nodes are connected by a characteristically sort path (Milgram, 1967). Watts and Strogatz produced a model that addressed certain limitations of previous random graph models, and consisted of a wiring process that interpolated between an
ER attachment scheme and a regular ring lattice (a graph which is obtained by beginning with a
circular graph consisting of a single cycle and connecting each vertex to its neighbors two steps away (Singer, 2016)) (Watts & Strogatz, 1998).
3.2 Fundamentals of network theory
A given network– or graph, as it is commonly referred to in mathematical literature– is a collection of dots, called nodes or edges, and lines, called vertices, interconnecting them. Let us consider 𝐺 = (𝑉, 𝐸), any graph made up of vertices 𝑉(𝐺) = {𝑣1, 𝑣2, … , 𝑣𝑛} and edges 𝐸(𝐺) = {𝑒1, 𝑒2, … , 𝑒𝑛}. The number of vertices for each graph is its order, noted 𝑛, and the number of edges its size, 𝑚. Each graph can be mathematically summarized by its adjacency matrix A, for which:
𝑎𝑖𝑗∶= {1 𝑖𝑓 𝑣𝑖𝑣𝑗 ∈ 𝐸
0 𝑜𝑡ℎ𝑒𝑟𝑤𝑖𝑠𝑒 (8)
Obviously, 𝐴 is symmetric, as any edge between 𝑣𝑖 and 𝑣𝑗 is also an edge between 𝑣𝑗 and 𝑣𝑖. Hence, 𝑎𝑖𝑗 = 𝑎𝑗𝑖. Alternatively, graphs are often summarized by their incidence matrix 𝐵, for which:
𝑏𝑖𝑗 = {1 𝑖𝑓 𝑣𝑖 ∈ 𝑒𝑖
0 𝑜𝑡ℎ𝑒𝑟𝑤𝑖𝑠𝑒 (9)
A path is a sequence of vertices traversed by following edges from one to another across a network. Mathematically, it is a non-empty sub-graph 𝑃 = (𝑉, 𝐸) of the form 𝑉 = {𝑣0, 𝑣1, … , 𝑣𝑘} and 𝐸 = {𝑣0𝑣1, 𝑣1𝑣2, … , 𝑣𝑘−1𝑣𝑘} where all 𝑣𝑖 are distinct (Dueñas-Osorio, 2005). The length of a path is the number of edges it traverses. The distance 𝑑𝑖𝑗—or geodesic path— is the shortest path that exists between nodes 𝑖 and 𝑗. If no such path is present, which is to say if 𝑖 and 𝑗 exist on different sub-graphs for which no physical link exists, 𝑑𝑖𝑗∶= ∞. It is also important to note that distances need not be unique between nodes 𝑖 and 𝑗, as two distinct paths may be of the same length.
Figure 3.2: Graph G - an unweighted and undirected graph
It is made up of 6 vertices (or nodes) and 9 unweighted, undirected edges (or lines). Mathematically, 𝐺 = (𝑉, 𝐸), where: 𝑣1 = 1 𝑣2 = 2 𝑣3 = 3 𝑣4 = 4 𝑣5 = 5 𝑣6 = 6 And 𝑒1 = (𝑣1, 𝑣2) 𝑒2 = (𝑣1, 𝑣3) 𝑒3 = (𝑣1, 𝑣5) 𝑒4 = (𝑣2, 𝑣4) 𝑒5 = (𝑣2, 𝑣5) 𝑒6 = (𝑣3, 𝑣4) 𝑒7 = (𝑣3, 𝑣5) 𝑒8 = (𝑣4, 𝑣6) 𝑒9 = (𝑣5, 𝑣6)
Graph 𝐺 can also be represented by its adjacency matrix 𝐴𝐺 𝐴𝐺 = ( 0 1 1 0 1 0 1 0 0 1 1 0 1 0 0 1 1 0 0 1 1 0 0 1 1 1 1 0 0 1 0 0 0 1 1 0)
as well as its incidence matrix 𝐵𝐺
𝐵𝐺 = ( 1 1 1 0 0 0 0 0 0 1 0 0 1 1 0 0 0 0 0 1 0 0 0 1 1 0 0 0 0 0 1 0 1 0 1 0 0 0 1 0 1 0 1 0 1 0 0 0 0 0 0 0 1 1)
In more detailed graphs, edges can be attributed values—or weighted—to characterize the processes taking place across the various arcs in question. In such cases, non-zero elements of the adjacency matrix can contain values other than 1, indicating stronger or weaker connections. A typical example of such weighted graphs is the flow or value of commodities being transited along elements of a supply chain. Similarly, directed graphs, are those which specify the direction of edges between vertices. Directed graphs can be represented by asymmetric adjacency matrixes for which 𝑎𝑖𝑗 = 1 or 𝑎𝑖𝑗 = −1 indicate an edge pointing in a direction specified by convention.
3.2.1 Network characterization
Characterizing networks allows us to gain an understanding of the physical configurations—or
topologies—of different graphs. Using simple metrics as a means of describing graphs facilitates
the comparison of different types of networks. The following section provides a brief overview of traditional parameters used in network characterization, as well as some of the most useful contemporary ones.
3.2.1.1 Average Path Length (𝑳)
For undirected graphs, the average path length—sometimes referred to as mean distance—is defined as: