UNIVERSITÉ DE MONTRÉAL
LOCALIZATION OF SOLID MICRO AND NANO-INCLUSIONS IN
HETEROPHASE BIOPLASTIC BLENDS
EBRAHIM JALALI DIL
DÉPARTEMENT DE GÉNIE CHIMIQUE ÉCOLE POLYTECHNIQUE DE MONTRÉAL
THÈSE PRÉSENTÉE EN VUE DE L’OBTENTION DU DIPLÔME DE PHILOSOPHIAE DOCTOR
(GÉNIE CHIMIQUE) AOÛT 2015
UNIVERSITÉ DE MONTRÉAL
ÉCOLE POLYTECHNIQUE DE MONTRÉAL
Cette thèse initulée:
LOCALIZATION OF SOLID MICRO AND NANO-INCLUSIONS IN
HETEROPHASE BIOPLASTIC BLENDS
présentée par : JALALI DIL Ebrahim
en vue de l’obtention du diplôme de : Philosophiae Doctor a été dûment acceptée par le jury d’examen constitué de :
M. VIRGILIO Nick, Ph. D., président
M. FAVIS Basil, Ph. D., membre et directeur de recherche M. AJJI Abdellah, Ph. D., membre
DEDICATION
ACKNOWLEDGMENTS
First and foremost, praise and thanks to Almighty God for his guidance and blessing throughout my life.
I would like to express my deepest gratitude to my supervisor, Professor Basil Favis, for his support, patience, immense knowledge and for providing me with a friendly and comfortable atmosphere for doing research. His vision and motivation have deeply inspired me and it was a great privilege to work and study under his guidance.
I also would like to thank Professor Pierre Carreau for his insightful comments and suggestions on the first part of the project.
A special word of thanks is owed to Dr. Vahid Khoshkava, Dr. Amir Saffar, Dr. Amirhossein Maani and Dr. Hesam Ghasemi for their help during this study.
I also would like to thank Professor Uttandaraman Sundararaj, Dr. Mohammad Arjman and Yan Li for their help and comments on the collaborative part of the project.
I would like to extend my gratitude to my friends Arash, Richard, Ali, Vahid and Jun for the fruitful discussions we have had. I greatly value their friendship and I deeply appreciate their help.
I also would like to thank the technical and administrative staff of the Chemical Engineering Department of École Polytechnique de Montréal.
Last but not least, I would like to thank my parents and sisters, who have always supported me throughout my life. A special thanks to my wife, Zahra, who has always stood by me and supported me through the good times and bad.
RÉSUMÉ
Le mélange de poly (acide lactique), PLA, et autres bioplastiques à haute résistance à l’impact a été introduit en tant que méthode efficace pour améliorer la ténacité du PLA. Toutefois, cette stratégie réduit considérablement le module d’Young et la résistance mécanique du PLA. L'ajout de particules solides est une méthode bien connue pour réconcilier l'équilibre rigidité / ténacité des matrices polymères. Bien que l'importance de contrôler la localisation des inclusions solides dans des mélanges de polymères soit mise en évidence, la littérature échoue à fournir une analyse détaillée des mécanismes de migration et n'identifie pas en détail les conséquences des paramètres thermodynamiques et cinétiques relatifs à la localisation de particules solides dans des mélanges de polymères.
Dans ce mémoire, la localisation et la migration des particules de micro- et nano-silice sphériques dans deux mélanges de bioplastiques, soit : PLA / polyéthylène basse densité (LDPE) et PLA / poly (butylène adipate-co-téréphtalate), PBAT, ont été étudiés.
Dans la première partie de ce travail, une étude détaillée de la miscibilité et du développement de la morphologie dans le mélange PLA / PBAT a été réalisée. Une tension interfaciale de 0,6 ± 0,15 mN / m a été déterminée pour le couple PLA et PBAT en ajustant le modèle de Palierne sur les données rhéologiques. La miscibilité du PLA / PBAT a ensuite été examinée en étudiant le décalage de la température de transition vitreuse (Tg) des phases de polymère à différentes compositions. Les résultats obtenus indiquent une miscibilité partielle unidirectionnelle limitée des molécules de PBAT dans la phase riche en PLA. Cette miscibilité partielle dépend significativement du poids moléculaire du PBAT, qui reflète son caractère entropique. L'analyse de la morphologie des échantillons a montré que la phase dispersée dans les mélanges de PLA / PBAT existe sous la forme de fibres, même à basse composition de 1% en vol. de la phase dispersée. Enfin, la région de co-continuité dans les mélanges de PLA / PBAT a été déterminée en utilisant une approche rhéologique. Il a été montré que le mélange PLA / PBAT a une région de co-continuité symétrique large située entre 30 à 40 et 60 à 70 vol.% de PBAT.
Dans la deuxième partie de ce projet, la localisation et la migration des particules de silice dans les mélanges de PLA / PBAT ont été étudiés. Basé sur les énergies de surface mesurées du PLA et PBAT, le modèle d'Young prédit que la position d'équilibre thermodynamique des particules de silice se situe dans la phase de PBAT. Suite à l'ajout de particules de silice au PLA / PBAT
fondu, les particules de micro- et nano-silice ont été localisées dans la phase de PBAT quelle que soit la viscosité de la phase de PLA. Il a été démontré que cette localisation sélective se produit lors des premières étapes de mélange et a été attribuée à la tension interfaciale inférieure du couple PBAT / silice par rapport au couple PLA / silice. L'influence des paramètres cinétiques a été étudié en effectuant le pré-mélange des particules de silice avec la phase PLA, ainsi, les particules étaient localisées dans la phase thermodynamiquement défavorable. Il a été constaté que la migration des particules de micro-silice à partir de la phase PLA à l'interface dépend fortement de la viscosité de la phase PLA, du taux de cisaillement lors du mélange et de la taille des particules de silice. Ces résultats mettent en évidence le rôle critique de l'étape du retrait du film de PLA entre les particules de micro-silice et l'interface. Suite au pré-mélange de particules de nano-silice dans la phase PLA, une localisation stable à l'interface PLA/PBAT a été constatée, quel que soit la viscosité de la phase PLA. En utilisant un modèle semi-empirique récemment mis au point pour déterminer la vitesse de migration de particules sphériques à l'interface, il a été montré que la localisation stable des particules de silice à l'interface est dû à la vitesse de migration très lente à l'interface, qui provient de la faible tension interfaciale entre le PLA et le PBAT.
Dans la dernière partie de cette thèse, les effets des paramètres thermodynamiques et cinétiques sur la migration et la localisation des particules de micro- et nano-silice dans un mélange à haute tension interfaciale de PLA / LDPE ont été étudiés. La surface des particules de micro-silice a été modifié par greffage de (2-Dodecen-1-yl) d'anhydride succinique en utilisant une nouvelle approche de réaction en phase gazeuse. Les localisations d'équilibre thermodynamique de particules de silice non-modifiées et modifiées ont été déterminées comme étant dans la phase PLA et à l'interface, respectivement. Il a été constaté que l'addition de particules de silice non-modifiées et non-modifiées à une masse fondue de PLA et de LDPE haute viscosité (H-LDPE) résulte en l'encapsulation préférentielle des particules de la phase avec laquelle ils ont la plus faible tension interfaciale. Les effets des paramètres cinétiques ont été étudiés en pré-mélangeant des particules de silice avec la phase H-LDPE suivi du mélange avec le PLA. Il a été constaté que le retrait du film de LDPE entre les particules et l'interface joue un rôle critique dans l'inhibition de la migration des particules de micro-silice non-modifiées et modifiées vers le PLA et l'interface, respectivement. D'autre part, lorsque les particules de nano-silice ont été utilisées, les particules individuelles de silice ont pu migrer vers la phase PLA , tandis que les agrégats de
nano-silice sont restés dans la phase H-LDPE. Ces résultats indiquent que la localisation de nanoparticules bien dispersées dans un mélange de polymères à haute tension interfaciale est peu susceptible d'être influencée par les effets cinétiques.
En comparant les résultats obtenus pour la localisation des particules de silice dans les mélanges PLA/PBAT et PLA/LDPE, une perspective générale des paramètres importants dans le contrôle de la migration et de la localisation des particules dans les mélanges de polymères est présenté
ABSTRACT
Blending poly(lactic acid), PLA, with other high impact bioplastics has been introduced as an effective method for improving the toughness of PLA; however, this strategy considerably reduces the modulus and mechanical strength of PLA. The addition of solid particles is a well-known method for tuning the stiffness/toughness balance in toughened polymer matrices. Notwithstanding the significance of controlling the localization of solid inclusions in polymer blends, the literature is lacking a detailed analysis of the migration mechanisms and the effects of thermodynamic and kinetic parameters on the localization of solid particles in polymer blends. In this dissertation, the localization and migration of spherical micro- and nano-silica particles in two bioplastic blends of PLA/low density polyethylene (LDPE) and PLA/poly(butylene adipate-co-terephthalate), PBAT, were studied.
In the first part of this work, a detailed study on the miscibility and morphology development in the PLA/PBAT blend was carried out. The interfacial tension between PLA and PBAT was determined to be 0.6 ± 0.15 mN/m by fitting Palierne’s model on the rheological data. The miscibility of PLA/PBAT was then examined by studying the shift in the glass transition temperature (Tg) of the polymer phases at different blend compositions. The obtained results indicate a limited one-way partial miscibility of PBAT molecules in the PLA-rich phase. This partial miscibility depends significantly on the molecular weight of PBAT, which underlines its entropic nature. The morphology analysis of the blend samples revealed that the dispersed phase in PLA/PBAT blends exists in the form of fibers, even at low compositions of 1 vol.% of the dispersed phase. Finally, the co-continuity region in PLA/PBAT blends was determined using a rheological approach and it was shown that PLA/PBAT has a wide symmetric co-continuous region located between 30-40 and 60-70 vol.% of PBAT.
In the second part of this project, the localization and migration of the silica particles in PLA/PBAT blends were studied. Based on the measured surface energies of PLA and PBAT, Young’s model predicts that the thermodynamic equilibrium localization of the silica particles should be in the PBAT phase. When the silica particles were added to a PLA/PBAT melt, micro- and nano-silica particles were localized in the PBAT phase irrespective of the PLA phase viscosity. This selective localization was shown to occur at the early stages of mixing and was attributed to the lower interfacial tension of PBAT/silica compared to PLA/silica. The influence
of kinetic parameters was imposed by the premixing of the silica particles with the PLA phase, which is the least thermodynamically preferred phase. It was found that the migration of micro-silica particles from the PLA phase to the interface depends strongly on the viscosity of the PLA phase, the shear rate of mixing and the particle size of the silica. These results point to the critical role of the PLA film draining between micro-silica particles and the interface. When nano-silica particles were premixed in the PLA phase, they were localized at the interface in a stable fashion irrespective of the PLA phase viscosity. Using a newly developed semi-empirical model for the migration velocity of spherical particles at the interface, it was shown that the stable localization of silica particles at the interface is due to the very slow migration velocity at the interface, which originates from the low interfacial tension between PLA and PBAT.
In the last part of the thesis, the effects of thermodynamic and kinetic parameters on the migration and localization of micro- and nano-silica particles in a high interfacial tension blend of PLA/LDPE were studied. The surface of the micro-silica particles was modified by the grafting of (2-dodecen-1-yl) succinic anhydride using a new gas phase reaction approach. The thermodynamic equilibrium localizations of unmodified and modified silica particles were determined to be in the PLA phase and at the interface, respectively. It was found that the addition of unmodified and modified silica particles to a melt of PLA and high viscosity LDPE (H-LDPE) results in the preferential encapsulation of the particles by the phase with which they have the lowest interfacial tension. The effects of kinetic parameters were studied by premixing silica particles with the H-LDPE phase followed by mixing with PLA. It was found that the draining of the LDPE film between the particles and the interface plays a critical role in inhibiting the migration of both unmodified and modified micro-silica particles toward the PLA phase and the interface, respectively. On the other hand, when nano-silica particles were used, individual nano-silica particles could migrate to the PLA phase, while the nano-silica aggregates remained in the H-LDPE phase. These results indicate that the localization of well-dispersed nanoparticles in a high interfacial tension polymer blend system is unlikely to be significantly influenced by the kinetic effects.
By comparing the obtained results on the localization of silica particles in PLA/PBAT and PLA/LDPE, a general perspective of the important parameters in controlling the migration and localization of the particles in polymer blends is presented.
TABLE OF CONTENTS
DEDICATION ... III ACKNOWLEDGMENTS ... IV RÉSUMÉ ... V ABSTRACT ... VIII TABLE OF CONTENTS ... X LIST OF TABLES ... XVI LIST OF FIGURES ... XVII LIST OF SYMBOLS AND ABBREVIATIONS... XXVICHAPTER 1 INTRODUCTION ... 1
1.1 Objectives ... 3
CHAPTER 2 LITERATURE REVIEW ... 4
2.1 Bioplastics ... 4
2.1.1 Poly (lactic acid) ... 5
2.1.2 Poly (butylene adipate-co-terephthalate) ... 6
2.1.3 Bio-Based Polyethylene ... 6
2.1.4 Blends of PLA and Other Bioplastics ... 7
2.2 Polymer Blends ... 7
2.2.1 Thermodynamics of Polymer Blends ... 7
2.2.2 Surface Tension ... 8
2.2.3 Interfacial Tension ... 9
2.2.4 Morphology Development in Heterophase Polymer Blends ... 12
2.2.5 Compatibilization of Polymer Blends ... 15
2.3.1 PLA/PBAT Blends ... 17
2.3.2 PLA/PE Blends ... 19
2.4 Polymer Nanocomposites ... 21
2.4.1 Thermodynamic of the Localization of Solid Inclusions in Polymer Blends ... 21
2.4.2 Kinetics of the Migration and Localization ... 24
2.4.3 The Effect of Different Localizations of Solid Particles on the Morphology of Polymer Blends ... 34
CHAPTER 3 ORGANIZATION OF ARTICLES ... 43
CHAPTER 4 ARTICLE 1: MORPHOLOGY, MISCIBILITY AND CONTINUITY DEVELOPMENT IN POLY(LACTIC ACID)/POLY(BUTYLENE ADIPATE-CO-TEREPHTHALATE) BLENDS ... 45
4.1 Abstract ... 45
4.2 Introduction ... 46
4.3 Experimental ... 47
4.3.1 Materials ... 47
4.3.2 Molecular weight and Gel permeation chromatography (GPC) ... 48
4.3.3 Proton nuclear magnetic resonance (1HNMR) ... 48
4.3.4 Blend preparation ... 48
4.3.5 Field emission scanning electron microscopy (FE-SEM) ... 48
4.3.6 Atomic force microscopy (AFM) ... 49
4.3.7 Image analysis ... 49
4.3.8 Rheological analysis ... 50
4.3.9 Interfacial tension measurement ... 51
4.3.10 Temperature-Modulated dynamic scanning calorimetry (TMDSC) ... 52
4.4.1 Molecular Weight and Rheological Characterization of the Neat Polymers ... 52
4.4.2 PLA/PBAT Interfacial Tension ... 54
4.4.3 Miscibility ... 56
4.4.4 Morphological Characterization of PLA/L-PBAT Blends ... 59
4.5 Conclusions ... 67
4.6 Acknowledgements ... 68
4.7 References ... 68
CHAPTER 5 ARTICLE 2: LOCALIZATION OF MICRO- AND NANO- SILICA PARTICLES IN HETEROPHASE POLY(LACTIC ACID)/ POLY(BUTYLENE ADIPATE-CO-TEREPHTHALATE) BLENDS ... 71
5.1 Abstract ... 71
5.2 Introduction ... 72
5.3 Experimental ... 74
5.3.1 Materials ... 74
5.3.2 Surface tension measurements ... 74
5.3.3 Blend preparation ... 75
5.3.4 Atomic force microscopy (AFM) ... 76
5.3.5 Field emission scanning electron microscopy (FE-SEM) ... 76
5.3.6 Image analysis ... 76
5.3.7 Rheological analysis ... 76
5.3.8 Temperature-modulated dynamic scanning calorimetry (TMDSC) ... 77
5.4 Results and Discussion ... 77
5.4.1 Rheological Characterization and Surface Tension Measurements of Neat Materials .. ... 77
5.4.3 Effect of mixing strategy ... 82
5.4.4 Effect of the Viscosity of the PLA Phase ... 84
5.4.5 Effect of the Shear Rate of Mixing ... 86
5.4.6 Mechanism of Localization of Silica Particles in Pr1 ... 87
5.4.7 Mechanism of Migration of Silica Particles from PLA to PBAT ... 89
5.5 Conclusions ... 95
5.6 Acknowledgment ... 96
5.7 References ... 96
CHAPTER 6 ARTICLE 3: LOCALIZATION OF MICRO AND NANO- SILICA PARTICLES IN A HIGH INTERFACIAL TENSION POLY(LACTIC ACID)/ LOW DENSITY POLYETHYLENE SYSTEM ... 100
6.1 Abstract ... 100
6.2 Introduction ... 101
6.3 Experimental ... 103
6.3.1 Materials ... 103
6.3.2 Surface modification of micro-silica particles ... 103
6.3.3 Surface energy measurements and interfacial tensions ... 104
6.3.4 X-ray photoelectron spectroscopy (XPS) ... 105
6.3.5 Rheological characterization ... 105
6.3.6 Blend preparation ... 105
6.3.7 Field emission scanning electron microscopy (FE-SEM) ... 106
6.3.8 Atomic force microscopy (AFM) ... 106
6.3.9 Image analysis ... 106
6.4 Results and Discussion ... 107
6.4.2 Thermodynamics of the Localization of Silica Particles in PLA/PE Blends ... 110
6.4.3 Effect of the Surface Energy of Micro-Silica Particles ... 113
6.4.4 Effect of the Mixing Strategy ... 114
6.4.5 Effect of the Shear Rate ... 115
6.4.6 The Effect of the Viscosity of the LDPE Phase ... 116
6.4.7 Effect of the Particle Size of Silica ... 117
6.4.8 The Mechanism of Migration of Silica Particles ... 119
6.4.9 Comparison between the Migration and Localization in Low and High Interfacial Tension Blends ... 122
6.5 Conclusions ... 123
6.6 Acknowledgment ... 124
6.7 References ... 124
CHAPTER 7 GENERAL DISCUSSIONS ... 127
CHAPTER 8 CONCLUSIONS AND RECOMMENDATIONS... 129
8.1 Conclusion ... 129
8.2 Original Contributions ... 131
8.3 Recommendations for Future Works ... 133
REFERENCES ... 135
ANNEX 1 SUPPORTING INFORMATION FOR ARTICLE 1... 145
ANNEX 2 EFFECTS OF DIFFERENT LOCALIZATIONS OF MICRO- AND NANO- SILICA PARTICLES ON MORPHOLOGY, RHEOLOGY AND MECHANICAL PROPERTIES OF POLY(LACTIC ACID)/POLY(BUTYLENE ADIPATE-CO-TEREPHTHALATE) BLENDS ... 148
ANNEX 3 COMPATIBILIZATION OF PLA-PBAT INTERFACE BY SOLID STATE SHEAR PULVERIZATION (SSSP) ... 165
ANNEX 4 EFFECT OF MICRO-SILICA PARTICLES ON THE MORPHOLOGY OF PLA/H-LDPE BLENDS ... 169
ANNEX 5 LOCALIZATION OF COPPER NANO-WIRES IN POLY(LACTIC
ACID)/LOW DENSITY POLYETHYLENE BLENDS ... 175
LIST OF TABLES
Table 2-1. The surface energy of different nano-particles reported in the literature. ... 22 Table 4-1. The molecular characteristics of PLA, L-PBAT and H-PBAT. ... 53 Table 5-1. Surface energy data of PLA, PBAT and silica at 25 and 180 ℃ and the estimated
interfacial tensions between the components at the processing temperature. ... 78 Table 5-2. The quantified localizations of micro- and nano-silica particles in PLA/PBAT samples
with the associated standard deviation (std). ... 81 Table 5-3. Glass transition temperatures (Tgs) of the neat polymers and polymer blends and
composites with 1 wt.% of micro-silica particles. ... 82 Table 6-1. Rheological characteristics of the neat polymer components ... 107 Table 6-2. The relative atomic% of different groups in the high resolution XPS spectra of U-micro-silica and M-U-micro-silica particles. ... 109
34TU
Table 6-3. Surface energies of PLA, LDPE, silica and M-micro-silica particles and the estimated interfacial tensions between the components.U34T ... 110
Table 6-4. The quantified localizations of 1% U-micro-silica, M-micro-silica and nano-silica particles in PLA/LDPE blends with the associated standard deviation (std). ... 112 Table 6-5. The kinetic parameters that control the migration and localization of micro- and nano-silica in high and low interfacial tension polymer blends. ... 122 Table A.2.1. The effect of different localizations of nano-silica on the mechanical properties of L-PLA/PBAT(70/30) ... 160
LIST OF FIGURES
Figure 2.1. Modulus versus elongation at break for bioplastics and commodity polymers. The red symbols and the green symbols indicate synthetic polymers and bioplastics, respectively[33]. ... 5 Figure 2.2. The molecular structure of PLA. ... 5 Figure 2.3. The molecular structure of PBAT. ... 6 Figure 2.4. Different morphologies of immiscible polymer blends with their potential
applications [45]. ... 8 Figure 2.5. From left to right: the breakup process of a PA6 thread with a diameter of 55 µm
embedded in a PS matrix at 230 ℃ [56]... 11 Figure 2.6. Cacrit versus viscosity ratio (p) in the shear and elongation flows [61] ... 13
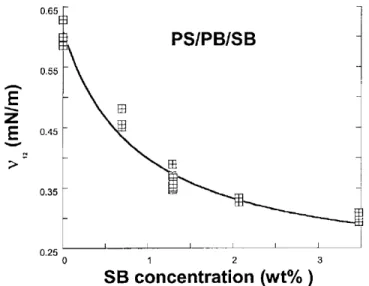
Figure 2.7. The effect of the torque ratio on the number average diameter (Dn) of the dispersed phase in the blends of PC/PP [60] ... 13 Figure 2.8.Effect of the addition of a SB copolymer on the interfacial tension (υ12) between PS
and PB [72]. ... 16 Figure 2.9. The effect of the addition of a hydrogenated styrene-butadiene-styrene tri-block
copolymer on the phase size of PS/Ethylene-propylene rubber (EPR) (90/10%) [73]. ... 17 Figure 2.10. The mechanical properties of PLA/PBAT blends at different compositions: (a)
tensile strength and modulus, (b) impact strength [12]. ... 18 Figure 2.11. (Left) the effect of the addition of a PLLA-b-PE copolymer on the morphology of
PLLA/LDPE (80/20) blends at (a) 0, (b) 2, (c) 5 and (d) 10 wt.% of the copolymer (based on the total weight of the blend); (right) the tensile properties of the blends [78]. ... 20 Figure 2.12. The effect of PLLA-b-PE content on the dispersed phase size and impact strength of
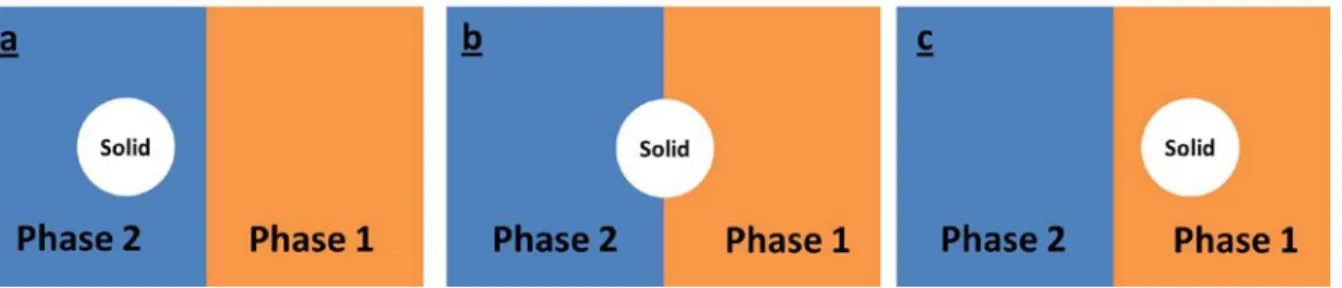
PLLA/LLDPE (80/20)[77]. ... 20 Figure 2.13. Different localizations of solid inclusions based on the wetting parameter(ω): (a) in
Figure 2.14. The effect of the viscosity of the PMMA phase in PP/PMMA(73/27): (a) high viscosity PMMA, (b) low viscosity PMMA. PMMA is always the brighter phase[119]. ... 26 Figure 2.15. Schematic representation of a particle at the PP/PCL blend interface. Fd and Fm are
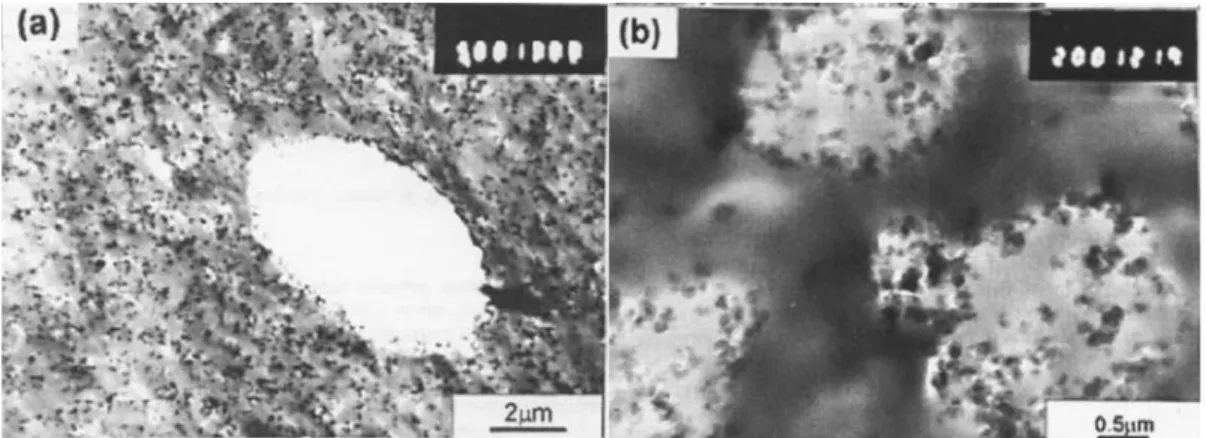
the drag forces applied by PCL and PP, respectively[120]. ... 26 Figure 2.16. The localization of hydrophobic silica in PP/EVA blends by the simultaneous
addition of components: (a) high viscosity EVA, (b) low viscosity EVA[91]. ... 27 Figure 2.17. TEM images of PCL/TPS/CNT nanocomposites prepared by premixing CNT with
PCL. (Left) sample prepared in the internal batch mixer; (right) sample prepared in the twin-screw extrude [104]. ... 28 Figure 2.18. (a) Electrical resistivity of the PS/PE (55/45) blend with 1 wt.% CB particles as a
function of mixing time, (b) the localization of CB particles after 2 minutes of mixing. [121]. ... 29 Figure 2.19. TEM images of the PLA/PCL(50/50) blend with 0.25 wt% CNT premixed with: (a)
after 1 min of processing, (g) after 20 min of processing. (b) and (h) show higher magnifications of (a) and (g) respectively[113]. ... 29 Figure 2.20. TEM images of PBT/PS disk samples showing the migration of organoclay in a
PBT/PS nanocomposite at a shear rate of 1 s-1 at different times: a) 700 s; b) 1800 s [122]. 30 Figure 2.21. TEM images of PBT/(PS/organoclay) after 700 s at shear rates of (a) 10 s-1 and (b)
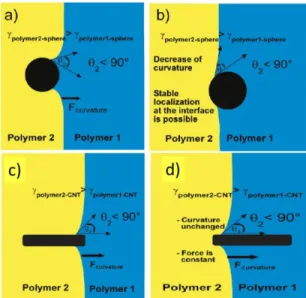
50 s-1 [122]. ... 31 Figure 2.22. The migration of a low and a high aspect ratio particle at the interface: (a,c) at the
beginning of the migration, (b,d) at the end of the migration. θ indicates the interface curvature[110]. ... 32 Figure 2.23. The effect of organoclay content on the morphology of HDPE/PA6 (75/25) blends:
a) 0 wt.%; b) 1 wt.%; d) 5 wt.% [5]. ... 35 Figure 2.24. Mechanism of the formation of a continuous structure pf PA6 in HDPE/PA6 (75/25)
blends: a) without organoclay; b) at low organoclay content; c) at high organoclay content [125]. ... 35
Figure 2.25. SEM images of ABS/PA6 (60/40) blend: (a) without CB particles (PA6 was extracted), (b) with 7.5 phr CB (ABS was extracted)[126]. ... 36 Figure 2.26. TEM images of a PE/PBT (90/10) blend with (a) 1 wt.%, (b) 5 wt.% and (c) 10 wt.%
of organoclay [127]. ... 36 Figure 2.27. The effect of organoclay content on the mechanical properties of PP/EOR blends: (a)
tensile modulus, (b) impact strength, (c) average particle size and inter-particle distance [79]. ... 37 Figure 2.28. Volume (Dvs) and number (Dn) average diameter of EPR dispersed phase in a
PA6/EPR blend as a function of organoclay content[130]. ... 38 Figure 2.29. The effect of the quiescent annealing on the morphology of (PP+PP-g-MA)/EOC
(60/40) in (A) the neat blend, (B) blend with 5 wt.% of nano-silica [81]. ... 39 Figure 2.30. SEM images of (a): PP/PS (70/30) blend; (b) the blend with 3 wt.% fumed silica, (c)
TEM image showing the localization of fumed silica at the interface[88]. ... 40 Figure 2.31. TEM (a) and SEM (b) image of the CNT shell around the PA phase in EA/PA6[90]. ... 40 Figure 2.32. TEM images of PP/EVA(80/20) with 3 wt.% silica particles localized at the
interface[91]. ... 41 Figure 2.33. The proposed mechanisms for the enhancement of the compatibility of polymers due
to the localization of nanoclay particles at the interface [138]. ... 41 Figure 4.1. The effect of different cutting angles with respect to a fiber axis on the observed
cross-sectional area in the microtomed surface. θi is the cut angle with the respect to the
fiber axis and R is the fiber radius. ... 50 Figure 4.2. The 1HNMR spectra of (a) PLA, (b) L-PBAT. The red labels indicate the different
hydrogen with the associated peaks. ... 53 Figure 4.3. The complex viscosity of the polymer components as a function of angular frequency.
The dashed line represents the average shear rate of mixing (25 s-1) estimated using the equation presented in ref.[26]. ... 54
Figure 4.4. Fitting of the Palierne model on the storage modulus of PLA/L-PBAT blends. (a) PLA/L-PBAT (80/20), the solid line shows the Palierne fit with γ/d=444, (b) PLA/L-PBAT (20/80), the solid line shows the Palierne fit with γ/d=232.5. ... 55 Figure 4.5. The morphology of the cross-section of PLA/L-PBAT(80/20) disk sample after
decreasing the gap to 1mm and annealing for 5 minutes at 180 ℃: a) AFM phase image, b) FE-SEM image of the fractured surface. The scale bars show 10 µm. ... 55 Figure 4.6. (a) Glass transition temperatures of PLA and PBAT phases in the blend samples
determined from TMDSC results: (■) L-PBAT phase in PLA/L-PBAT blends; (●) PLA-rich phase in PLA/L-PBAT blends; (▲) H-PBAT in PLA/H-PBAT blends; (▼) PLA-rich phase in PLA/H-PBAT blends. (b): wt.% of PBAT in PLA-rich phase determined from the Fox equation: (□) wt.% of L-PBAT in PLA-rich phase in PLA/L-PBAT blends; (►) wt.% of H-PBAT in PLA-rich phase in PLA/H-PBAT blends. The dashed line in (a) shows the Tg of a miscible blend based on the Fox equation. ... 57 Figure 4.7. Comparison between different microscopy techniques in the analysis of the
morphology of PLA/L-PBAT blends with different compositions. All the white scale bars indicate 5 µm. ... 60 Figure 4.8. FE-SEM images of the fractured surfaces of PLA/L-PBAT blends with different
compositions showing the fibrillar morphology of blend samples. ... 61 Figure 4.9. AFM images of PLA/L-PBAT blends at different blend compositions. The darker
phase is the L-PBAT phase and the brighter phase is the PLA phase in all images. All the micrographs are 30 μm×30 μm. ... 63 Figure 4.10. The volume average (■) and number average (●) fiber diameter in PLA/L-PBAT
blends with different L-PBAT compositions. The dashed lines show the “no-coalescence” baseline. The error bars show the standard deviation of the measured dispersed fiber diameters. ... 63 Figure 4.11. Storage modulus (G’) as a function of frequency in PLA/L-PBAT blends with
Figure 4.12. Cole-Cole plot of PLA/L-PBAT blends with different blend compositions at 180 ℃. ... 66 Figure 5.1. The complex viscosity of polymer components as a function of angular frequency: (■)
H-PLA; (▼) L-PLA; (●) PBAT. The dashed lines show the angular frequencies which correspond to the shear rates of 25s-1 and 47 s-1. ... 78 Figure 5.2. Localization of silica particles in L-PLA/PBAT (70/30)/ 1 wt.% micro-silica:(a) AFM image of the sample prepared by Pr1, (b) AFM image of the sample prepared by Pr2. (c) and (d) show SEM images of the fracture surfaces of (a) and (b), respectively. The scale bars show 2µm. ... 80 Figure 5.3. Effect of mixing strategy on the localization of micro-silica particles in L-PLA/PBAT
(70/30)/ 3 wt.% micro-silica:(a) SEM image of the fracture surface of the sample prepared by Pr1, (b) SEM image of the fracture surface of the sample prepared by Pr2. All the white scale bars show 2µm. ... 83 Figure 5.4. Effect of mixing strategy on the localization of nano-silica particles in L-PLA/PBAT
(70/30)/ 3 wt.% nano-silica:(a) AFM image of the sample prepared by Pr1, (b) AFM image of the sample prepared by Pr2. (c) and (d) show SEM images of the fracture surfaces of (a) and (b) respectively. The scale bars show 2µm. ... 84 Figure 5.5. SEM images showing the localization of micro-silica particles in H-PLA/PBAT
blends containing:(a) 1 wt.% micro-silica prepared by Pr1, (b) 1 wt.% micro-silica prepared by Pr2, (c) 3 wt.% micro-silica prepared by Pr1, (d) 3 wt.% micro-silica prepared by Pr2. The scale bars show 2µm. ... 85 Figure 5.6. The localization of nano-silica particles in H-PLA/PBAT blends containing 1 wt.%
nano-silica particles:(a) prepared by Pr1, (b) prepared by Pr2. The scale bars show 2µm. ... 85 Figure 5.7. The effect of shear rate on the localization of silica particles in the samples prepared
by Pr2 at 47 s-1, (a) micro-silica particles in H-PLA/PBAT, (b) micro-silica particles in L-PLA/PBAT, (c) nano-silica particles in L-PLA/PBAT. The arrows point to selected micro- and nano-silica particles. The scale bars show 2µm. ... 87
Figure 5.8. Nano-silica agglomerate in L-PLA/PBAT blend prepared by Pr1 after 30 s of mixing (a) SEM image of the fracture surface, (b) AFM image of the microtomed surface. (c) and (d) show higher magnifications of the marked areas in (a) and (b) respectively. The scale bars show 2 µm. ... 88 Figure 5.9. The migration mechanism of a silica particle from PLA phase to PBAT phase in the
samples prepared by Pr2, (a) migration from the bulk of PLA phase toward the interface, (b) draining of PLA film between the particle and the interface, (c) migration at the interface. 89 Figure 5.10. AFM image showing a micro-silica particle at L-PLA/PBAT interface in the sample
prepared by Pr2. The pointers aim to the three-phase contact line on the surface of silica particle. The scale bar shows 1 µm. ... 92 Figure 6.1. Complex viscosities of the neat polymer components. The dashed line represents the
average shear rates of mixing [29]. ... 107 Figure 6.2. (a) AFM image of the surface of the cast M-micro-silica film, the white scale bar
shows 2µm. (b) the evolution of the water contact angle (θ) on the M-micro-silica film as a function of reaction time. ... 108 Figure 6.3. (a) XPS survey spectra of U-micro-silica and M-micro-silica particles, (b) High
resolution XPS spectra of the carbon regions of M-micro-silica particles ... 109 Figure 6.4. The localization of silica particles in the samples prepared by Pr1: (a) PLA/H-LDPE
(80/20) with 1 wt.% of U-micro-silica, (b)PLA/H-LDPE with 1 wt.% of nano-silica. The white scale bars show 5 µm. ... 112 Figure 6.5. The localization of U-micro-silica particles in PLA/H-LDPE (5/95) with 3 wt.% of
the silica particles prepared by Pr1. ... 112 Figure 6.6. The localization of 1 wt.% of M-micro-silica particles in PLA/H-LDPE(80/20) blend
prepared by Pr1. ... 114 Figure 6.7. The localization of 1 wt.% of U-micro-silica particles in PLA/H-LDPE (80/20)
prepared by Pr2. ... 115 Figure 6.8. The effects of shear rate on the localization of U-micro-silica particles in PLA/H-LDPE (80/20) blend prepared by Pr2 at the shear rate of 47 s-1. ... 115
34TU
Figure 6.9. The effect of the viscosity of the LDPE phase on the localization of 1 wt.% of U-micro-silica particles in PLA/L-LDPE blend prepared by Pr2.U34T ... 116
Figure 6.10. The localization of M-micro-silica particles in PLA/L-LDPE (80/20) blends prepared by Pr2: (a) before and, (b) after the extraction of the L-LDPE phase by boiling cyclohexane. The scale bars in (a) and (b) show 5 µm and 2µm respectively. ... 117 Figure 6.11. The localization of nano-silica particles in PLA/H-LDPE blend prepared by Pr2, (a)
SEM image of nano-silica aggregates in H-LDPE, (b) AFM image of nano-silica aggregates in H-LDPE phase. All the white scale bars show 1 µm. ... 118 Figure 6.12. The effect of shear rate on the localization of nano-silica particles in PLA/H-LDPE
blend prepared by Pr2 at the shear rate of 47 s-1. ... 118 Figure 6.13. The migration mechanism of a silica particle from the LDPE phase to the PLA phase
in the samples prepared by Pr2, (a) migration from the bulk of the LDPE phase towards the interface, (b) draining of the LDPE film between the particle and the interface, (c) migration at the interface. ... 119 Figure 6.14. The localization of U-micro-silica particles in PLA/H-LDPE(90/10) prepared by
Pr2: (a) 1 wt.% of U-micro-Silica, (b) 3 wt.% of U-micro-silica. The white scale bars show 5 µm. ... 120 Figure A.1.1. (a) 2D and (b) 3D schematic of the geometry of a spherical particle at the interface,
The red line in (b) shows the three-phase contact line on the surface of silica. x is the penetration depth of the particle into the PBAT phase and a=𝑥(2𝑅 − 𝑥)34T ... 145 Figure A.2.1. The complex viscosity and storage modulus of H-PLA, L-PLA, PBAT and their
mixtures with micro- and nano-silica: (■) H-PLA, (□) H-PLA with 4.3 wt.% micro-silica, (◆) L-PLA, (●) PBAT, (●) PBAT/10 wt.% micro-silica, (▲) PBAT/10 wt.% nano-silica ... 152 Figure A.2.2. Different localizations of micro- and nano-silica particles in PLA/PBAT (70/30). ... 153 Figure A.2.3. The effect of the localization of micro-silica particles in the PLA phase on the
Figure A.2.4. The effect of localization of micro-silica particles in the H-PLA phase on the rheological properties of H-PLA/PBAT (70/30): (a) complex viscosity, (b) storage modulus, (c) Cole-Cole plot. ... 154 Figure A.2.5. The effect of selective localization of micro- and nano-silica in the PBAT phase in
L-PLA/PBAT (70/30): (a) the neat blend, (b) the blend with 3 wt.% of micro-silica, (c) the blend with 3 wt.% of nano-silica. ... 155 Figure A.2.6. The effect of the localization of micro- and nano-silica in the PBAT phase on the
rheological properties of L-PLA/PBAT (70/30) blend. (■) the neat blend, (●) the blend with 3 wt.% of micro-silica, (▲) the blend with 3 wt.% of nano-silica. ... 156 Figure A.2.7. The localization of micro- and nano-silica in PLA/PBAT(70/30): (a) neat blend, (b)
3 wt.% of micro-silica, (c) 3 wt.% of nano-silica. ... 157 Figure A.2.8. The rheological analysis of L-PLA/PBAT(70/30) blends with micro- and nano-silica particles localized at the interface, (a) complex viscosity, (b) storage modulus, (c) Cole-Cole plot. (■)L-PLA/PBAT(70/30) blend,(●)the blend with 3 wt.% of micro-silica, (▲)the blend with 3 wt.% of nano-silica, (▼) L-PLA/PBAT(50/50). The subplot in (c) shows the full range of the data. ... 158 Figure A.2.9. Stabilization mechanism of the PBAT dispersed phase in the blend with nano-silica
localized at the interface: (a) a PBAT fiber with nano-silica at the interface, (b) deformation of the PBAT fiber by hydrodynamic forces, (c) stabilization of the deformed PBAT fiber by migration of nano-silica from PLA. ... 159 Figure A.2.10. The effect of different localizations of nano-silica particles on the tensile stress-strain curve of L-PLA/PBAT(70/30). ... 160 Figure A.3.1. The effect of different SSSP strategy on the morphology of PLA/PBAT(60/40): a)
Procedure1, (b)Procedure 2 ... 166 Figure A.4.1. The effect of the selective localization of micro-silica in the PLA phase at different
silica contents on the morphology of PLA/H-LDPE blends. The silica contents are shown on the headers of the columns. The H-LDPE phase was extracted in PLA/H-LDPE(70/30); the PLA phase was extracted in PLA/H-LDPE(30/70) and (20/80). The white scale bars show 20 µm. ... 169
Figure A.4.2. The continuity development diagram in PLA/H-LDPE blends with different micro-silica contents: (■)H-LDPE phase in the neat blend,(●) H-LDPE in the blend with 5 wt.% of micro-silica, (▲) H-LDPE in the blend with 15 wt.% of micro-silica, (□)PLA in the neat blend, (○) PLA in the blend with 5 wt.% of micro-silica, (△) PLA in the blend with 15 wt.% of micro-silica. ... 170 Figure A.4.3. Complex viscosities and storage moduli of the neat polymer components and
PLA/micro-silica mixtures at 180oC: (-) neat PLA, (▲)PLA with 5 wt.% of micro-silica, (■) PLA with 15 wt.% of micro-silica, (□) L-PE, (○) H-PE. The dashed line represents the average shear rate of mixing at 25 s-1[6]. ... 171
Figure A.4.4. SEM image of PLA/H-LDPE (10/90) with 15 wt.% of micro-silica ... 172 Figure A.5.1. SEM image of (a) template with cylindrical pores; (b) synthesized CuNWs. ... 177 Figure A.5.2. The complex viscosities of PLA, LDPE and their composites with CuNW particles.
The dashed line represents the average shear rate of mixing[1]. ... 178 Figure A.5.3. Dispersion of CuNW particles in: (a) LDPE/ 4 wt.% CuNW masterbatch, (b)
PLA/1.2 wt.% CuNW masterbatch. ... 178 Figure A.5.4. TEM image of PLA/LDPE (70/30) blend prepared by: (a) Pr1, (b) Pr2. The white
scale bars show 2µm. ... 180 Figure A.5.5. The localization of CuNW particles in PLA/LDPE (70/30) prepared by P2 at 100
RPM. The white scale bar shows 2µm. ... 181 Figure A.5.6. The effect of mixing time on the localization of CuNW particles in
PLA/LDPE(70/30)/CuNW prepared by Pr2 at 20 min of mixing. ... 181 Figure A.5.7. The effect of different localization of CuNW particles on the morphology of
PLA/LDPE(70/30): (a) No CuNW, (b) 1 wt.% CuNW in PLA phase (prepared by Pr1), (c) CuNW in the PLA and LDPE phase (prepared by Pr2). The white scale bars show 10 µm. ... 182
LIST OF SYMBOLS AND ABBREVIATIONS
English Letters:Ca capillary Number
Cacrit critical Capillary Number
G* complex modulus
G’ storage Modulus
p dispersed phase/matrix viscosity ratio Tg glass transition temperature
Mw molecular weight Wa work of adhesion
D diameter
Pr probability of a successful collision in coalescence
EDK bulk breaking energy of dispersed phase
Wi weight percent of component i
Af surface area of the film in film draining
Fc contact force of a particle to the interface
Greek letters:
∆Gm Gibbs free energy of mixing
χ𝐴𝐵 Flory-Huggins interaction parameter
ρ density
φ volume fraction
∆H enthalpy of mixing
𝛾𝑖 surface tension of component i
𝛾𝑖𝑑 non-polar (dispersive) component of surface energy of component i
𝛾𝑖𝑝 polar component of surface energy of component i 𝛼 amplitude of sinusoidal distortions in breaking thread ηRm matrix viscosity
η0 zero-shear viscosity η* complex viscosity
η’ real part of the complex viscosity η” imaginary part of the complex viscosity
τ shear stress
𝜔 wetting parameter
𝛾̇ Shear rate
δC critical film thickness in film draining
δC initial film thickness in film draining
List of Abbreviations:
PLA poly(lactic acid) PHA polyhydroxyalkanoate
PE polyethylene
PA polyamide
PBAT poly(butylene adipate-co-terephthalate) PBS poly(butylene succinate)
PCL polycaprolactone PLLA poly(L-lactic acid)
PET polyethylene terephthalate HDPE high density polyethylene LDPE low density polyethylene LLDPE linear low density polyethylene SAN styrene–acrylonitrile
PS polystyrene
PP polypropylene
EPDM ethylene propylene diene monomer
PC polycarbonate
DMA dynamic mechanical analysis GMA glycidyl methacrylate
XPS x-ray photoelectron spectroscopy TPS thermoplastic starch
ABS acrylonitrile butadiene styrene MA maleic anhydride
EPR ethylene propylene rubber
CB carbon black
CNT carbon nanotube
PBT polybutylene terephthalate TGA thermogravimetric analysis POE polyolefin elastomer MMT organoclay
PEO polyethylene oxide EOC poly(ethylene-co-octene)
PA6 polyamide 6 or nylon 6 PA11 polyamide 11
PA12 polyamide 12
CHAPTER 1
INTRODUCTION
Polymers from renewable resources have received an increasing amount of attention over the last two decades due to environmental concerns and finite petroleum resources[1]. As a result, the production of bioplastics has increased significantly in recent years. According to the latest annual report of the European Bioplastic Organization[2], the global production capacity of bioplastics in 2012 reached 1.5 million tons per year and is expected to grow by 400% in 2017. Therefore, in the near future, bioplastics will be a key player in the polymer market.
Among different bioplastics, poly(lactic acid), PLA, has attracted considerable attention as it is not only a bio-based polymer but also can be composted in industrial plants [1, 3]. The most important weaknesses of PLA are its poor impact properties, low heat deflection temperature (HDT), moisture sensitivity and thermal degradation [3]. Different strategies have been used to improve the poor toughness and impact strength of PLA such as plasticization, copolymerization with other polyesters and blending with other bioplastics [4-26]. Among them, the blending of PLA with other bioplastics has received much attention as it is economical and through using this method not only the brittleness but also other properties of PLA can be modified[6]. Among blends of PLA with bioplastics, blends of PLA with polycaprolactone (PCL) and poly(butylene adipate-co-terephthalate) (PBAT) have been studied extensively as these two bioplastics have much higher impact strength and elongation at break compared to most bioplastics. Moreover, PCL and PBAT are produced in an industrial scale and are available in the market, which makes them potential candidates for achieving a high performance PLA blend at a reasonable price. On the other hand, the low melting temperature of PCL limits the application of PLA/PCL blends and, therefore, PLA/PBAT blends can offer a much wider application range. Presenting blends of PLA/PBAT under the trademark of Ecovio by BASF is clear evidence of this claim. However, many important aspects of PLA/PBAT such as miscibility and morphology have not yet been studied in detail. Therefore, it is necessary to carry out a comprehensive analysis of these aspects of PLA/PBAT. In addition, the commercial production of bio-based polyethylene (bio-PE) using ethylene manufactured from sugar cane ethanol has recently been undertaken. According to the annual report of the European Bioplastics Organization [2], the global production capacity of bio-PE has passed that of PLA in 2013. Currently, bio-based HDbio-PE and bio-based LDbio-PE (bio-LDbio-PE) exist in the market. Considering the higher impact and elongation at break of bio-LDPE, blends
of PLA/bio-LDPE have a significant commercial potential to be introduced as a fully bio-based high performance polymer blend.
Due to all the factors mentioned above, blends of PLA/PBAT and PLA/LDPE were chosen as the bioplastic blends in this study. However, due to the limited access to bio- LDPE, petroleum-based LDPE was used in this research study. It is worth mentioning that the processing and final properties of bio-LDPE are similar to petroleum-based LDPE.
The most important drawback of blending PLA with PBAT or LDPE is the drop in the mechanical strength and stiffness compared to neat PLA. The addition of solid inclusions is a well-known method for achieving a balance between toughness and stiffness in polymer blends [27-29]. Moreover, it has been shown that the addition of conductive solid particles such as carbon nanotubes not only improves the mechanical properties but also can enhance electrical conductivity[30]. However, all previous studies point to the important role of controlling the localization of solid particles in achieving the desired mechanical properties and/or electrical conductivity [31, 32]. Despite previous attempts, little knowledge exists on the mechanism of the migration and localization of solid particles in polymer blends. This can be attributed to the complexity of the analysis of the systems incorporating solid particles. For example, the rheology of these systems can be affected considerably by the addition of the particles. In addition, the complex shape of the particles and particle size distribution increase the complexity of interpreting the results. In addition, the level of the dispersion of the particles can also affect the results.
To eliminate these issues, spherical silica particles with a narrow particle size distribution (D90/D10 = 1.3) and a good dispersion were used in this study. Note that D90 and D10 refer to the
particle diameters at 90% and 10% from the cumulative percent curve, respectively. Moreover, the spherical shape of these particles allowed us to use the rheological and thermodynamic equations that have been developed in the field of filled polymers, which are mainly based on the mono-dispersed spherical particle assumption. Two types of spherical silica with individual particle sizes of 100 nm and 300 nm were used to study the effect of the particle size on the migration and localization. These particles will be referred to as nano- and micro-silica, respectively. Note that according to ISO/TS 27687 and ASTM E2456-06, nanoparticles are defined as particles with at least one length dimension smaller than 100 nm. Therefore, in this
study the localization of spherical micro- and nano-silica particles in two bioplastic blends of PLA/PBAT and PLA/LDPE are studied. Considering all the aforementioned, the main objectives of this work are presented in the following section.
1.1 Objectives
The main objective of this project is to control the preferential location of spherical micro- and nano-silica particles in heterophase bioplastic blends. Thus, the following specific objectives are defined as the main milestones to achieving the main objective of this work:
Investigate the miscibility and morphology development in PLA/PBAT blends.
Determine the effect of thermodynamic and kinetic parameters on the localization and migration of micro- and nano-silica in a low interfacial tension system of PLA/PBAT. Study the localization and migration of micro- and nano-silica particles in a high
interfacial tension PLA/LDPE blend.
CHAPTER 2
LITERATURE REVIEW
2.1 Bioplastics
Each year more than 300 million tons of plastics, mostly non-biodegradable or compostable, are produced. The disposal of plastic waste into landfills has short and long-term negative ecological impacts. Despite the growing demand on the recycling of plastics as a solution, recycling cannot solely resolve this issue due to its cost and limited capacity. In addition, most of the commodity polymers are petroleum–based materials; therefore, limited oil and gas resources underline the need for these materials to be replaced by the plastics produced from renewable resources. Bioplastic materials have emerged as a new class of polymers that are bio-based and/or biodegradable. These unique characteristics of bioplastics have motivated the plastic industries and even consumers to consider them as the next generation of polymer materials. This new class of polymers is generally classified into three main categories:
1) bio-based and biodegradable (or compostable) polymers, such as starch, poly(lactic acid) or PLA, and polyhydroxyalkanoate (PHA).
2) bio-based or partially bio-based but non-biodegradable (or non-compostable) polymers, such as bio-polyethylene (bio-PE) and bio-polyamide 11 (bio-PA11).
3) petroleum-based but biodegradable (or compostable) polymers, such as poly(butylene adipate-co-terephthalate) or PBAT, poly(butylene succinate) or PBS, and polycaprolactone (PCL).
Despite the great potential of bioplastics, they have not been widely used in the plastic industry mainly due to their higher price and poor mechanical properties. Improving the production technology and increasing the production capacity of bioplastics are likely to reduce their final cost; however, the poor mechanical properties of these materials will still be a limiting factor. Figure 2.1 compares the modulus and elongation at break of some bioplastics. As can be seen, almost all bioplastics have either a low modulus or a low elongation at break, which indicates the lack of a balance between stiffness and toughness in these materials.
Figure 2.1. Modulus versus elongation at break for bioplastics and commodity polymers. The red symbols and the green symbols indicate synthetic polymers and bioplastics, respectively[33].
2.1.1 Poly (lactic acid)
Compared to other biodegradable polyesters, PLA has one of the highest commercial potential due to its availability in the market, its mechanical properties and its price [34]. The molecular structure of PLA is shown in Figure 2.2.
Figure 2.2. The molecular structure of PLA.
The most common method for the production of PLA is the ring opening polymerization (ROP) of cyclic lactide dimers [1]. Therefore, almost all commercial PLAs available in the market are polylactides. The properties of PLA are highly related to the ratio between its D and L mesoforms. At present, 100% L-PLA, PLLA, which is a highly crystalline polymer and copolymers of poly (L-lactic acid) and poly (D -lactic acid), which are rather amorphous, are commercially available. As can be seen in Figure 2.1, PLA is among the few bioplastics that have a mechanical strength comparable with the commodity polymers such as polystyrene (PS) and polyethylene terephthalate (PET). The main weaknesses of PLA are its brittleness, low barrier properties and low crystallization rate [1]. Anderson et al. [6] and Rasal et al. [26] reviewed different strategies for increasing the toughness of PLA including the variation of the ratio of D and L mesoforms, plasticization, copolymerization with other polyesters and blending with other
bioplastics. Among these approaches, blending with other bioplastics has received much attention as it is economical and through using this method not only the brittleness but also other properties of PLA can be improved [6]. The blending of PLA with other bioplastics will be discussed later in this chapter.
2.1.2 Poly (butylene adipate-co-terephthalate)
PBAT is a petroleum-based biodegradable aliphatic-aromatic copolyester which was first produced industrially by BASF in 1997. The molecular structure of PBAT consists of butylene terephthalate (BT) and butylene adipate (BA) segments as shown in Figure 2.3.
Figure 2.3. The molecular structure of PBAT.
PBAT is mainly manufactured for packaging applications and has processability, impact strength and elongation at break comparable to low density polyethylene (LDPE) [19]. On the other hand, unlike LDPE, the polyester nature of PBAT provides good compatibility with hydrophilic materials. Witt et al.[35] studied the biodegradability of PBAT and found no sign of environmental risk (eco-toxicity) after degradation.
2.1.3 Bio-Based Polyethylene
The low price, excellent chemical resistance, easy processing, high elongation at break and electrical insulation make polyethylene (PE) an excellent candidate for a wide range of applications. Recently, Braskem started the commercial production of bio-based high density polyethylene (bio-HDPE) and bio-based low density polyethylene (bio-LDPE) using ethylene manufactured from sugar cane ethanol. It is worth mentioning that the mechanical properties and performance of bio-PE are similar to those of petroleum-based PE. Braskem has also announced that they will use this approach to produce bio-based polypropylene (bio-PP). Therefore, it can be seen that bio-based polyolefins will soon be an important component of the bioplastics market.
2.1.4 Blends of PLA and Other Bioplastics
As mentioned before, the blending of PLA with other bioplastics has been introduced as an effective approach for improving the toughness of PLA. Blends of PLA with PCL [9, 36-38] and PBAT [10-12, 14-21, 39-42] have received much attention due to their high impact strength and elongation at break of PCL and PBAT. Moreover, the polyester nature of these polymers provides good compatibility with PLA. However, considering the low melting temperature of PCL (∼60 o
C), PLA/PBAT blends can offer a much wider range of applications as a high performance compostable bioplastic material. On the other hand, the high impact strength and renewable resource of bio-PE indicate the potential of the PLA/bio-PE blend as a fully bio-based blend with improved mechanical properties [5, 7, 8, 43, 44]. Before reviewing the literature on PLA/PBAT and PLA/PE blends, some general concepts of polymer blends will first be reviewed in the next section.
2.2 Polymer Blends
2.2.1 Thermodynamics of Polymer Blends
The thermodynamics of mixing in binary polymer mixtures can be expressed by the Gibbs free energy of mixing:
∆G𝑚 = 𝑅𝑇χ𝐴𝐵. 𝜑𝐴𝜑𝐵+ 𝑅𝑇 �𝜌𝐴𝜑𝑀𝑤𝐴ln 𝜑𝐴
𝐴 +
𝜌𝐵𝜑𝐵ln 𝜑𝐵
𝑀𝑤𝐵 �
Here, ∆Gm is Gibbs mixing energy, χAB is the Flory-Huggins interaction parameter, φi is the
volume fraction of the polymer components, ρi is the density of polymers, and Mwi is the
molecular weight of the polymers. The first term on the right side of this equation shows the enthalpy of mixing, ∆Hm, according to Hilbrand-Scatchard-van Lard theory and the terms in the
brackets represent the combinational entropy of mixing based on Flory-Huggins lattice theory. Based on Gibbs free energy of mixing, binary polymer blends are categorized into three main groups: (i) miscible polymer blends: when ∆Gm < 0 and 𝜕
2∆𝐺
(ii) partial miscible polymer blends when ∆Gm < 0 but 𝜕
2∆𝐺
𝜕𝜑2 < 0 in some compositions; (iii)
immiscible polymer blends when ∆Gm > 0 over the full composition range. In miscible polymer
blends, both components are miscible down to the molecular scale while in immiscible polymer blends, two separate phases of the polymers are formed. In partially miscible systems, again, two phases are formed but each phase is a miscible mixture of both polymer components. The negligible entropy of mixing in polymers mixtures (due to their high molecular weights) and the positive enthalpy of mixing (in the absence of any specific interaction) results in the immiscibility of most polymer mixtures. However, achieving miscibility in polymer blends is not always desired as some unique properties can only be obtained in immiscible polymer systems. The final properties of immiscible polymer blends strongly depend on their morphology. Figure 2.4 shows the different morphologies of binary polymer blends with their potential properties.
Figure 2.4. Different morphologies of immiscible polymer blends with their potential properties [45].
It has been shown that the morphology of immiscible polymer blends depends strongly on the interfacial tension between the phases [46]. On the other hand, the interfacial tension between two polymers is directly related to their surface tension (energy). The surface tension and interfacial tension will be discussed below.
2.2.2 Surface Tension
Surface tension is defined as the work required to increase the surface area of a solid or a liquid by the unit of area [47]. The unit of the surface tension is J/m2 or N/m. The surface tension
originates from the imbalanced molecular forces at the surface compared to the bulk. Among different techniques, the contact angle method [48] is the most common method used to measure the surface tension of polymers in the solid state. On the other hand, the pendant drop technique has been widely used in determining the surface tension of polymer melts [49, 50]. This method can be used for both Newtonian and viscoelastic fluids and provides a high accuracy and small range of error [51].
2.2.3 Interfacial Tension
The interface is the boundary between two phases and plays a critical role in the morphology and final properties of heterophase polymer blends [52]. The interfacial tension is defined as the reversible work required to increase the interfacial area by the unit of area[47]. The interfacial tension can also be defined as the rate of the change in the interfacial energy of a system by increasing the interfacial area. The interfacial tension has the same unit as the surface tension (J/m2 or N/m) and originates from the imbalanced forces at the interface. Different techniques that have been used to determine the interfacial tension between polymer pairs will be reviewed below.
2.2.3.1 Estimation of the Interfacial Tension from the Surface Energy Data
The interfacial tensions between two polymer melts or a polymer melt and a solid can be estimated from the surface energy of the components. Good and Girifalco [53] estimated the interfacial tension using the work of adhesion concept as:
𝛾12= 𝛾2+ 𝛾1− 𝑊𝑎
Where γ12 is the interfacial tension between the components, γ1 is the surface tension of the
component 1, γ2 is the surface tension of the component 2 and Wa is the work of adhesion
between the components. Wu [54] applied the energy additivity concept and estimated the contributions of polar and nonpolar interactions in the work of adhesion using the Harmonic Mean approach: 𝑊𝑎 = 4 � 𝛾2 𝑑𝛾 1𝑑 𝛾2𝑑 + 𝛾 1𝑑+ 𝛾2𝑝𝛾1𝑝 𝛾2𝑝+ 𝛾1𝑝�
Here 𝛾𝑖𝑑 and 𝛾𝑖𝑝 are the nonpolar (or dispersive) and polar components of the surface energy, respectively. On the other hand, Wu [55] found that the Harmonic Mean equation cannot accurately estimate the interfacial tension between two materials with highly different polarity (such as the interfacial tension between mercury and organic polymers) and showed that the estimation of the work of adhesion by the Geometric Mean approach results in much better predictions of the interfacial tension in those systems. The work of adhesion by the Geometric Mean equation is defined as:
𝑊𝑎 = 2 ��𝛾2𝑑𝛾1𝑑+ �𝛾2𝑝𝛾1𝑝�
2.2.3.2 The Breaking Thread Method
If a high aspect ratio thread of a liquid is embedded in another liquid, in the absence of flow, sinusoidal distortions form and grow exponentially at the interface of the liquids and finally cause the thread to break up into a number of smaller droplets. The formation and growth of the sinusoidal distortions occur due to the tendency of two immiscible liquids to minimize their interfacial area. The breakup of a nylon 6 (PA6) thread embedded in a polystyrene (PS) matrix is shown in Figure 2.5. According to Tomotika’s model, the amplitude of the sinusoidal distortions grows exponentially over time as:
𝛼 = 𝛼0. 𝑒𝑞𝑡
where α0 is the amplitude of the initial distortions and q is defined as[56]:
𝑞 = η𝛾12Ω
0𝐷0
here γ12 is the interfacial tension between the liquids, η0 is the zero-shear viscosity of the matrix,
Figure 2.5. From left to right: the breakup process of a PA6 thread with a diameter of 55 µm embedded in a PS matrix at 230 ℃ [56].
The interfacial tension can be determined from the slope (q) of the log-log plot of the amplitude of the distortions (α) versus time. It should be considered that the breaking thread method can only be used if both polymers exhibit a Newtonian plateau at low frequencies.
2.2.3.3 Rheological Analysis
Palierne [57] presented a model to predict the rheological properties of viscoelastic emulsions with a narrow droplet size distribution in the small amplitude oscillation shear (SAOS). According to his model, the complex modulus of a polymer blend can be written as:
𝐺∗ = 𝐺
𝑚∗ 1 + 3𝜑𝐻1 − 2𝜑𝐻
In this equation, H is defined as:
𝐻 = (𝐺𝑑
∗− 𝐺
𝑚∗)(19 𝐺𝑑∗ + 16 𝐺𝑚∗) + 4 𝛾𝑅 (5 𝐺12 𝑑∗ + 2 𝐺𝑚∗)
(2 𝐺𝑑∗ + 3 𝐺𝑚∗)(19 𝐺𝑑∗ + 16 𝐺𝑚∗) + 40 𝛾𝑅 (𝐺12 𝑑∗+ 𝐺𝑚∗)
here G*is the complex modulus of the blend, G*m is the complex modulus of the matrix, G*d is
the complex modulus of the dispersed phase, γ12 is the interfacial tension between the matrix and
the dispersed phase, R is the volume average dispersed phase diameter and φ is the volume fraction of the dispersed phase. In this method, 𝛾12
rheological data. The estimation of the interfacial tension by the rheological method is limited to systems where the second plateau in the storage modulus is experimentally accessible.
2.2.4 Morphology Development in Heterophase Polymer Blends
The final morphology in a heterophase polymer blend is a result of the competition between the disintegration and breakup on one hand and the coalescence of the dispersed phase on the other. These two processes will be briefly reviewed below.
2.2.4.1 Droplet Breakup
Droplet breakup in a Newtonian emulsion under the elongation and shear flow was first studied by Taylor [58]. He found that by increasing the elongation rate, the shape of the dispersed droplet changed from a sphere to a thread and finally broke down into a number of smaller droplets after the secession of the flow. This is similar to the thread breakup experiment that was discussed in 2.2.3.2. On the other hand, the droplet in the shear flow was stretched and oriented in a plane of 45o with respect to the flow direction. Taylor also found that by increasing the deformation, the droplet breakup occurred when the ratio of the viscous force to the interfacial force was greater than a critical value. The ratio of the viscous force to the interfacial force is known as the Capillary number and is defined as:
Ca =γη12𝑚 γ̇ R �
where γ̇ is the shear rate, ηm is the matrix viscosity, γ12 is the interfacial tension and R is the
droplet radius. Figure 2.6 shows the critical capillary number (Cacrit), at which the droplet
breakup occurs, as a function of the viscosity ratio (p) a Newtonian emulsion under the elongation and shear flow fields [59]. Note that the viscosity ratio is defined as the ratio of the dispersed phase viscosity to the viscosity of the matrix. As can be seen, Cacrit for the shear flow is
always greater than that of the elongation flow and shows a minimum at 0.25 < p< 1. This indicates much enhanced droplet breakup in the elongation flow compared to the shear flow. Favis and Chalifoux [60] studied the effect of viscosity ratio on the droplet breakup in the blends of polycarbonate (PC) PC and PP. Figure 2.7 shows the average dispersed phase diameter in PC/PP blends as a function of the torque ratio of the neat dispersed phase to the neat matrix. Note
that they observed a similar effect of the torque ratio and the viscosity ratio on the dispersed phase morphology.
Figure 2.6. Cacrit versus viscosity ratio (p) in the shear and elongation flows [61]
Figure 2.7. The effect of the torque ratio on the number average diameter (Dn) of the dispersed phase in the blends of PC/PP [60]
By increasing the torque ratio from 2 to 13, they observed that the dispersed phase size increased by a factor of about 2. Moreover, they found that the dispersed phase size decreased when the torque ratio was less than 1 with a minimum in the particle size occurring at the torque ratio of 0.25. This value is in good agreement with the one observed by Taylor in a Newtonian emulsion under shear flow, Figure 2.6. Wildes et al. [62] also studied the effect of the viscosity ratio on the dispersed phase size in a blend of PC and styrene–acrylonitrile (SAN) and found that in the absence of a compatibilizer, the minimum droplet size occurred at a viscosity ratio of 0.4.
Bhadane et al. [63] examined the effect of viscosity ratio on dispersed phase size in a low interfacial tension blend of PP and ethylene propylene diene monomer (EPDM) and found that a small change in the viscosity ratio did not influence the dispersed phase size but a seven-fold increase in the viscosity ratio increased the dispersed EPDM phase size by a factor of 3 to 4. As mentioned previously, Taylor[58] found that the droplet breakup is enhanced in the elongation flow. Favis and Therrien [52] compared the dispersed phase size/viscosity ratio dependency in a high viscosity polycarbonate (PC)/PP blend in an internal batch mixer and a twin screw extruder. They found that the dispersed phase size was much less dependent on the viscosity ratio in the twin-screw extruder. Considering that elongation flow is very dominant in the twin screw extruder, the observed difference can be related to the highly effective droplet breakup in the extruder. These results are in agreement with the results of Wildes et al. [62] who found that in a PC/SAN blend processed by a twin-screw extruder, the phase size of the dispersed SAN particles was independent of the viscosity ratio.
Therefore, the previous studies have shown that: (a) shear flow has a limitation in droplet breakup when the viscosities of the phases are very different; (b) elongation flow is highly efficient.
2.2.4.2 Coalescence
The coalescence of two droplets in an emulsion can be assumed as a three-step process: (i) two droplets are brought together by the flow field, (ii) A film of the matrix between two droplets is drained until the thickness of the film reaches a critical value, (iii) The rupture of the film occurs, which results in the coalescence and merging of the droplets [64]. At equilibrium, Tokita derived the following equation for the phase size of the dispersed phase [52]:
De ≈24Pπτ (φ +rγ12 4Prπτ φEDK 2)
where τ is the shear stress, Pr is the probability that a collision results in the coalescence and EDK
is the bulk breaking energy of the dispersed phase. Tokita’s model predicts that the phase size decreases linearly by increasing the shear stress and by decreasing the interfacial tension. Favis and Willis [65] obtained a master curve of the phase size as a function of composition for several immiscible polymer blends and found that the phase size dependency on compositions follows ϕ+kϕ2
Therefore, it can be seen that the coalescence and coarsening of the dispersed phase increases significantly by increasing the amount of the dispersed phase.
2.2.4.3 Continuity Development in Polymer Blends
By increasing the amount of the dispersed phase, at a certain volume fraction, a 3D inter-connected continuous structure of the dispersed phase is formed in the blend. This volume fraction is known as the onset of the continuity of the dispersed phase. When both phases exist in the form of the 3D interconnected structures, the morphology is known as the co-continuous morphology. It has been shown that the formation of the continuous structure of the dispersed phase is promoted when the dispersed phase exists in the form of a stable highly elongated phase [63, 66, 67]. According to Tomotika’s model [56], increasing the viscosity of the matrix and decreasing the interfacial tension result in the formation of a more stable thread of the dispersed phase and, therefore, these factors should enhance the formation of the co-continuous morphology. Previous studies confirmed the broadening of the co-continuity region by decreasing the interfacial tension [67, 68].
2.2.5 Compatibilization of Polymer Blends
The addition or in-situ generation of compatibilizers in immiscible polymer blends is a well-known method for enhancing the interfacial adhesion between polymeric phases and improving the final mechanical properties. The features of the compatibilization of polymer blends can be listed as: 1) decreasing the interfacial tension; (2) reducing the dispersed phase size; (3) preventing either partially or completely both dynamic and static coalescence processes; (4) improves the adhesion between the phases; (5) stabilizing the microstructure and (6) ultimately allowing much more control over the various processing parameters and final properties of the material [69]. The compatibilization process is generally carried out through two methods: a) the addition of a copolymer which has parts that are miscible or highly compatible with either phases, (b) formation of a compatibilizer at the interface by reactive processing. In the second method, the third component either has functional groups that can react with both phases at the interface or has a tail compatible with one of the phases and a functional group that can react with the other phase.
![Figure 2.7. The effect of the torque ratio on the number average diameter (Dn) of the dispersed phase in the blends of PC/PP [60]](https://thumb-eu.123doks.com/thumbv2/123doknet/2333546.32233/42.918.273.639.516.780/figure-effect-torque-number-average-diameter-dispersed-blends.webp)
![Figure 2.10. The mechanical properties of PLA/PBAT blends at different compositions: (a) tensile strength and modulus, (b) impact strength [12]](https://thumb-eu.123doks.com/thumbv2/123doknet/2333546.32233/47.918.127.800.648.937/figure-mechanical-properties-different-compositions-tensile-strength-strength.webp)
![Figure 2.12. The effect of PLLA-b-PE content on the dispersed phase size and impact strength of PLLA/LLDPE (80/20)[77]](https://thumb-eu.123doks.com/thumbv2/123doknet/2333546.32233/49.918.279.639.728.1000/figure-effect-plla-content-dispersed-impact-strength-lldpe.webp)
![Figure 2.16. The localization of hydrophobic silica in PP/EVA blends by the simultaneous addition of components: (a) high viscosity EVA, (b) low viscosity EVA[91]](https://thumb-eu.123doks.com/thumbv2/123doknet/2333546.32233/56.918.150.766.300.549/figure-localization-hydrophobic-simultaneous-addition-components-viscosity-viscosity.webp)

![Figure 2.23. The effect of organoclay content on the morphology of HDPE/PA6 (75/25) blends: a) 0 wt.%; b) 1 wt.%; d) 5 wt.% [5]](https://thumb-eu.123doks.com/thumbv2/123doknet/2333546.32233/64.918.126.798.108.319/figure-effect-organoclay-content-morphology-hdpe-pa-blends.webp)
