Science Arts & Métiers (SAM)
is an open access repository that collects the work of Arts et Métiers Institute of Technology researchers and makes it freely available over the web where possible.
This is an author-deposited version published in: https://sam.ensam.eu Handle ID: .http://hdl.handle.net/10985/14958
To cite this version :
Citra Yanto Ciki PURBA, Guillaume POT, Joffrey VIGUIER, Julien RUELLE, Louis DENAUD -The influence of veneer thickness and knot proportion on the mechanical properties of laminated veneer lumber (LVL) made from secondary quality hardwood - European Journal of Wood and Wood Products - Vol. 77, n°3, p.393-404 - 2019
Any correspondence concerning this service should be sent to the repository Administrator : archiveouverte@ensam.eu
The influence of veneer thickness and knot proportion
on the mechanical properties of laminated veneer lumber (LVL) made
from secondary quality hardwood
Citra Yanto Ciki Purba1 · Guillaume Pot2 · Joffrey Viguier2 · Julien Ruelle1 · Louis Denaud2
Abstract
The first objective of this work was to study the influence of veneer quality on the mechanical properties of laminated veneer lumber (LVL) made of secondary quality hardwood. The second objective was to propose an adapted veneer thickness that provides the optimum mechanical properties of LVL, taking the veneer properties into account. Forty-eight LVL panels glued together using polyvinyl acetate (PVAc) were prepared. The quality of fresh veneers was assessed by measuring veneer knot proportion, lathe check depth and lathe check interval. The static modulus of elasticity (MOE), dynamic MOE, modulus of rupture (MOR) and shear modulus were measured using destructive and non-destructive methods. The 3 mm thick veneer provided the optimum mechanical properties for LVL for both species. The test direction did not have any significant influ-ence on the mechanical properties. In the flatwise direction, the average MOE values obtained were 13.2 GPa for beech LVL and 13.3 GPa for oak LVL, whereas the MOR was 72.0 MPa and 63.4 MPa, respectively. Increasing knot proportion in veneers results in a decrease in LVL MOE and MOR. Moreover, deeper lathe checks and higher lathe check intervals on veneer surfaces provide lower LVL shear modulus in the edgewise direction for both species. Internal veneer provides LVL with a higher density but weaker mechanical properties due to a higher knot proportion in the internal veneer.
1 Introduction
Hardwood dominates both the surface area and standing stock of French forests (IGN 2016). In contrast, the wood harvested and the timber produced are dominated by soft-wood (Ministère de l’Agriculture et de l’Alimentation-Agreste 2017). Forests cannot produce high-quality wood without also producing a large quantity of low-grade wood. Moreover, the new forest management systems based on intensive silviculture generally produce low-quality wood. Young thinnings, top wood and early harvested wood are secondary resources that have great potential for high-value applications (Eckelman 1993; Marchall 1995; McKeever
1997; Knudson et al. 2007).
The presence of various wood defects such as knots, grain deviation, juvenile wood and reaction wood restricts the uti-lization of secondary quality hardwood for structural materi-als. The presence of knots and knotholes in timber induces zones with weaker strength where defects will most likely start. Knots also create a larger area around the knot that has high grain angle deviation (Viguier et al. 2015, 2017a). In addition, young trees are usually characterized by a high proportion of juvenile wood (Bendtsen 1978; Kretschmann et al. 1993). Juvenile wood is a zone close to the pith created at the beginning of the radial growth that can be character-ized by lower mechanical properties compared to mature wood (Moore et al. 2009; Zobel and Sprague 2012). Finding an alternative use for these abundant resources is essential. These resources have been insufficiently explored and com-monly used only for firewood and wood composite (fiber and particleboard). The valorization of this resource as structural material requires better characterization of its mechanical properties and better knowledge of the effect of the defects on mechanical properties.
Laminated veneer lumber (LVL) is an engineered wood product made from rotary peeled veneer glued together with the grain generally oriented parallel to the panel length. LVL * Citra Yanto Ciki Purba
purbacitrayantociki@gmail.com
1 Université de Lorraine, AgroParisTech, INRA, Silva,
54000 Nancy, France
2 Ecole Nationale Supérieure d’Arts et Métiers, Rue Porte de
is usually used for structural and nonstructural applications such as flooring, furniture and construction (Ozarska 1999; Lam 2001). Compared to solid wood, LVL has dispersed defects due to the production process, better dimensional sta-bility, is available in large dimensions, and provides higher modulus of elasticity (MOE) and modulus of rupture (MOR) (Ebihara 1981; Youngquist et al. 1984).
Previous studies reported that veneer quality influences the mechanical properties of LVL (Daoui et al. 2011; Pot et al. 2015; Viguier et al. 2017b, 2018). Generally, LVL mechanical strength increases with the number of veneers inside the LVL (Schaffer et al. 1972; Hoover et al. 1987; Kilic et al. 2006). Thinner veneer distributes the defects (knots, knotholes, split and slope of grain) better than thicker veneer and improves the LVL strength (Ebihara 1981). On the other hand, increasing the number of veneers inside the LVL demands much more glue and more numerous steps for its production. Moreover, other studies also reported that the increase in veneer thickness decreases the shear strength and shear modulus of LVL, especially in the edgewise direc-tion (Ebihara 1981; Pot et al. 2015). Rotary peeling creates lathe checks on the loose side of the veneer surface (Thibaut
1988). Veneer lathe check properties are commonly char-acterized by the lathe check depth and lathe check inter-val. Under the same cutting conditions, higher peeling thickness produces veneer with deeper lathe checks and a greater distance between two consecutive checks (Denaud et al. 2007; Pałubicki et al. 2010). According to Pot et al. (2015), the decrease in shear modulus with the increase in veneer thickness in the edgewise direction is caused by the presence of lathe checks, which are almost perpendicular to the veneer surface and, consequently, more penalizing in the edgewise than in the flatwise direction. Nevertheless, the quoted authors` report was based on numerical studies and has not yet been clarified on a large number of experimental measures.
Increasing veneer thickness helps to decrease glue con-sumption and production time. More recent studies in LVL made of hardwood species reported that increasing veneer thickness resulted in minor weakening of the MOE and MOR of LVL (Daoui et al. 2011; Pot et al. 2015; Rahayu et al. 2015). The first objective of this study was to better understand the relationship between veneer properties and mechanical properties of LVL made of secondary quality hardwood. Most of the previous studies in hardwood LVL were performed using LVL made of knot-free veneer. Vigu-ier et al. (2018) reported the influence of grain angle and its deviation around the knot on the MOE and the MOR of LVL but none have quantified the relationship with the proportion of knots. Lathe check properties and knot propor-tion were used to characterize the quality of veneer, taking into account the radial variation of the veneer inside the tree trunk that provides different wood properties, i.e., internal
and external position. The second objective of this paper was to study the effect of veneer thickness on LVL mechani-cal properties and propose an adapted veneer thickness that provides optimum mechanical properties. It was expected that a compromise would have to be made between lathe check properties generated during wood peeling and wood knot proportion.
2 Materials and methods
2.1 Wood material
Beech (Fagus sylvatica L.) and oak (Quercus petraea Liebl.) were used for this study. They are the two major hardwood species in Europe and particularly in France (IGN 2016). Twelve logs were gathered during the thinning of tree stands in a local forest in Lorraine, France. The log diameters var-ied between 21 and 30 cm, with a length of 150 cm. Oak tree age ranged between 61 and 90 years, whereas beech age varied between 57 and 84 years. Each log was extracted from the upper part of the tree (above 5 m from the ground) and generally contained knots.
2.2 Veneer preparation
To minimize veneer lathe checks, all logs were soaked in hot water (60 °C) for 24 h. They were then cut into veneers using a rotary veneer lathe. Three classical veneer thicknesses for LVL and plywood products (2.1 mm, 3 mm, 4.2 mm) were used. The angular pressure bar of the rotary peeling machine was maintained at 5% for all thicknesses (the gap between the knife and pressure bar was 5% lower than the expected veneer thickness). These settings, which take log quality (relatively high density, knots, limited log diameter) into account, were used to produce moderately checked veneers. Each log was peeled to produce one particular veneer thick-ness. The veneers were numbered and clipped in 0.6 × 0.5 m2 sheets and dried using a vacuum drying device to reduce veneer moisture content (MC) to 18% and then air-dried to about 10% MC at the same time to limit drying time and drying cracks.
2.3 Measurement of veneer lathe checks and weighted knot proportions
The quality of fresh veneers was assessed by measuring lathe check depths and lathe check intervals (distance between two adjacent lathe checks). The measurement was performed on 10-cm-wide bands of fresh-cut veneer with a length of 20–60 cm. These veneer bands were taken from the edge of the veneers right after the peeling process ended. Lathe check depths and intervals were immediately
measured using a Systeme de Mesure d’Ouverture des
Fissures (SMOF) device to characterize the green veneer
(Pałubicki et al. 2010). These two parameters were meas-ured on a large proportion of veneers (around 40% of veneer from each veneer thickness). Approximately 11,500 lathe checks were used for this study.
A photograph of each dry veneer was taken before being laminated. The images of the veneer surface were analyzed using Image-J software to measure the weighted knot proportion. The percentage of knot surface to the total veneer surface was calculated and defined as knot proportion. The position of each knot on the veneer sur-face was also recorded. The veneer weighted knot propor-tion was calculated by multiplying the knot proporpropor-tion by a factor of correction based on the knot position along the veneer length (parallel to the fiber direction). This factor of correction was determined according to the variation of the bending moment along a beam subjected to a 4-point bending test. Factor correction 1 was used for the sec-tion with the maximum bending moment, which lies in the middle area of the tested beam. Factor corrections 0.5 and 0 were used for the second section and the section closer to the support, respectively, as presented in Fig. 1.
2.4 LVL production
Veneers from each log were divided into two categories by their radial positions inside the trunk, i.e., internal and external veneer. The internal veneers originated from the zone closer to the center of the trunk, whereas the external veneers were closer to the periphery. The limit between the two zones was the midpoint between the first and the last peeled veneer. This separation gives two groups with differ-ent mechanical properties, even if this could not be consid-ered as a limit between mature and juvenile wood.
The veneers were glued together with the grain oriented parallel to the panel length using PVAc (polyvinyl acetate) as an adhesive. The glue spread of each glue line was 180 g/ m2. Glued veneers were pressed under a pressure of 0.8 MPa for about 60 min at ambient temperature. For each combi-nation of treatment (wood species, veneer position inside the tree trunk and veneer thickness), four LVL panels were prepared (Table 1). All together, 48 LVL panels were used for this study. The final dimensions of the LVL panel were 500 × 250 × 21 mm3. After gluing and pressing, the LVL panels were stacked and stabilized for 2 weeks prior to mechanical tests.
2.5 Measurement of LVL mechanical properties
Nine test specimens were prepared with a dimension of 500 × 21 × 21 mm3 from each LVL panel. The MC of the LVL specimens was determined prior to the mechanical tests. The mean MC values obtained were 10.81% for oak LVL and 10.77% for beech LVL with a standard deviation of 0.18% and 0.2% respectively. Destructive tests and non-destructive tests based on the vibration method were used for measuring the LVL mechanical properties. Two loading directions were studied, i.e., flatwise and edgewise. For the flatwise bending test, the load direction was perpendicular 1
0,5 0,5
Fig. 1 Scheme of the factor of correction applied to knot proportion according to the knot position along the veneer
Table 1 Peeling setup, number
of panels, and number of test specimens prepared for the mechanical test of LVL made of secondary quality hardwood
Wood species Veneer position Veneer
thick-ness Number of veneer layers Panel Test specimen
Oak Internal 2.1 10 4 32 3.0 7 4 32 4.2 5 4 32 External 2.1 10 4 32 3.0 7 4 32 4.2 5 4 32 Beech Internal 2.1 10 4 32 3.0 7 4 32 4.2 5 4 32 External 2.1 10 4 32 3.0 7 4 32 4.2 5 4 32
to the glue lines, whereas for the edgewise test, the load direction was parallel to the glue lines. The dynamic MOE and shear modulus were measured in both loading directions using a nondestructive test called Bing (Brancheriau and Bailleres 2002; Brancheriau et al. 2007).
For the destructive tests, half of the samples was used for the flatwise bending test and the other half for the edgewise bending test. These 4-point bending tests made it possible to measure the MOE and the modulus of rupture (MOR). A local MOE and a so-called global MOE were calculated from the same test. The specific modulus was also calculated by dividing the measured modulus by the LVL density. The test arrangement is described in Fig. 2.
The local MOE is the MOE computed between the two central loading heads, in a zone of pure bending. It was cal-culated using this formula:
where a = distance between a loading position and the near-est support in a bending tnear-est (129 mm here), l1 = gauge length for the determination of the local MOE (120 mm in this case), I = the second moment of inertia (mm4),
F2 − F1 = the increment of load on the regression line with a correlation coefficient of 0.99 or better (N), and w2 − w1 = the increment of local deflection corresponding to F2 − F1 (mm). The global MOE was computed from the deflection of the whole beam and not just the pure bending zone. Deflection was calculated based on the movement of the loading tools. Equation 2 shows how the global MOE is computed. Shear effects, punching under the loading heads, and deformations (1)
Em,l=
al21(F2−F1) 16I(w2−w1)
of the loading machine are not taken into account using this calculation method. However, this so-called global MOE provides valuable information that takes the whole speci-men deformation into account, which is of interest for such heterogeneous material, whereas the local MOE may be too local:
where l = length of the test piece between the testing machine grips (mm), V2 − V1 = the increment of displacement of the loading tools corresponding to F2 − F1 (mm), and the other parameters are the same as those in Eq. 1.
2.6 Data analysis
To evaluate the influence of different wood species, veneer thickness, veneer position and loading direction on the LVL mechanical properties, multi-factor analysis of variance (ANOVA) and Tukey’s HSD (Honestly Significant Differ-ence) multiple comparison tests were carried out. All of the statistical analysis was performed at a level of significance of 0.05 using R-software. The coefficient of correlation and the coefficient of determination were used to evaluate the relationship between measured parameters. Paired t-tests were used to analyze the influence of veneer position on LVL mechanical properties.
3 Results and discussion
3.1 Veneer quality
3.1.1 Lathe check depth and lathe check interval
Mean lathe check depth and lathe check interval for each veneer thickness and wood species are presented in Table 2. Both the lathe check depth and the lathe check interval were affected by the veneer thickness. Statistical analysis showed that the difference in lathe check depth and lathe check interval among veneer thickness was statistically sig-nificant (p < 0.05). From the thinnest to the thickest veneer, there was an increase in lathe check depth of 40% and 57% (2) Em,g = −a 2(F 2−F1) 6I(V2−V1) (3l − 4a) 120 mm 162 mm 129 mm 129 mm 420 mm 21 mm F F w v v l1= l =
Fig. 2 Test arrangement for the 4-point bending test to measure local MOE
Table 2 Effect of peeling thickness on the mean lathe check depth and lathe check interval on oak and beech veneer surfaces
Different letters above the numbers signify statistically different populations, based on Tukey’s post hoc HSD tests (p < 0.05). Values in parentheses are standard deviations
Species Oak Beech
Veneer thickness (mm) 2.1 3 4.2 2.1 3 4.2
Mean lathe check depth (%) 54.9a (2.7) 67.7c (6.3) 76.9d (3.8) 46.3b (5.3) 63.8c (4.2) 72.9d (3)
for oak and beech, respectively. Correspondingly, the lathe check interval on the thickest veneer rose sharply by 95% and 118% for oak and beech, respectively. Oak had deeper lathe checks and higher lathe check intervals than beech for veneer with a 2.1-mm thickness. This difference was statisti-cally significant at the 0.05 level. The lathe check depth and the lathe check interval were relatively the same for both species for veneer with a 3-mm and 4.2-mm thickness. The results obtained for oak are interesting. Indeed, this spe-cies is less homogenous than beech (larger rays and a big difference between earlywood and latewood density), but shows similar behavior. The lathe check properties of oak veneers have never been reported before. Unlike oak, beech lathe check properties have been studied more extensively (Denaud et al. 2007; Pałubicki et al. 2010; Daoui et al. 2011; Rohumaa et al. 2018).
3.1.2 Knot proportion
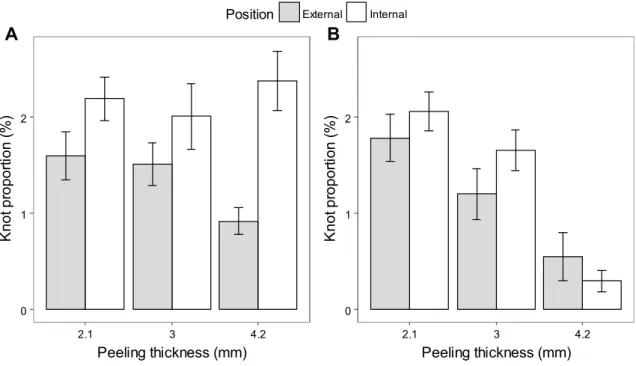
3.1.2.1 Knot proportion on veneer surface of secondary quality oak and beech Figure 3 compares the veneer knot proportion (unweighted) on different positions in the log and different veneer thicknesses. The aim was to determine the influence of veneer radial position inside the trunk on knot proportion. Knot proportion is important since it dem-onstrates the quality of the veneer used in this study and highlights the possible variations in the mechanical proper-ties of the different veneers according to their position in the log or thickness. The highest knot proportion on oak veneer was found on 4.2-mm-thick veneer in the internal
position, whereas the minimum was for the veneers of the same thickness, but in the external position. The knot pro-portion for oak veneer with a 2.1-mm and 3-mm thickness was fairly similar. On the other hand, the highest knot pro-portion on beech veneer was found for the thinnest veneers and the lowest for the thickest veneers. Of course, veneer thickness has no influence on the knot proportion, but this result is interesting to take into account when discussing the mechanical properties measured below. In particular, beech veneers with a 4.2-mm thickness present a much lower knot proportion than other veneers (below 0.5%). Figure 3 also demonstrates that the veneer knot proportion was generally higher on the surface of veneer peeled from the internal part of the tree than the external part except for beech veneers with a 4.2-mm thickness. Trimmed knots on the edge of the veneer in the internal position may have caused one peeled 4.2-mm-thick log to reveal a higher knot proportion in the external position.
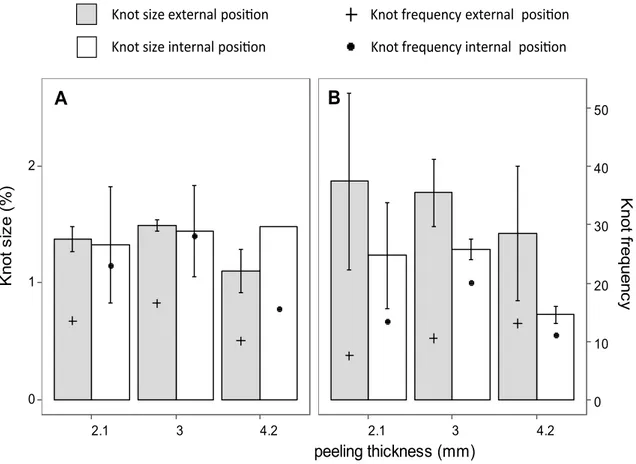
Figure 4 compares the mean knot size and frequency between the internal and external position on the two wood species. It describes the increase in knot frequency and the decrease in knot diameter from the periphery to the center of the trunk. During peeling, the outer part of the log was cut first and then followed by the inner part. Knot diameter is bigger at the position closer to the periphery and becomes smaller towards the inside. Since log diameter is bigger on the outer side and knot diameter is also bigger, peeled veneer from the external position only contained a small number of big knots. Bigger log diameter leads to a greater distance between knots related to wood peeling. When the peeling
Position External Internal
0 1 2 2.1 3 4.2 Peeling thickness (mm) Kn ot pr opor tion (% )
A
0 1 2 2.1 3 4.2 Peeling thickness (mm) Kn ot pr opor tion (% )B
diameter becomes smaller, the knots also become smaller. As a result, since the distance between knots is closer, peeled veneer in the internal position contains a higher number of knots. As a consequence of the higher number of knots, internal veneers contain a higher knot proportion than the external veneers. The increase in knot proportion from the veneer periphery to the center of the log has also been reported on a white spruce veneer (Knudson et al. 2007). Furthermore, McGavin et al. (2014) reported that the higher proportion of knots in addition to less mature wood proper-ties (e.g., lower wood density) produced lower MOE com-pared with veneer sheets recovered from the periphery of eucalyptus, which generally yields higher MOE. In addition, lower MOE on LVL made of juvenile wood has also been reported in poplar (Rahayu et al. 2015).
3.1.2.2 The influence of veneer radial position on LVL mechanical properties In Table 3, the density and mechanical properties of internal and external positions measured using destructive tests are compared. For oak, the LVL made of internal veneer has a relatively higher density than the LVL made of external veneer. The dif-ference was statistically significant at the 0.05 level. A previous study reported that oak ring density and ring
width decrease with the increase in the distance to the pith (Nepveu 1990). This decrease in oak ring density by cambial age explains the difference of the LVL density between both veneer positions. Nevertheless, for beech LVL, the difference of LVL density between both posi-tions was insignificant at the 0.05 level.
On the contrary, MOE and MOR were significantly higher on beech LVL made of external veneers. For oak, the differences are not significant at the 0.05 level. These results showed that, generally, LVL made of veneers closer to the pith (internal) produce lower mechanical properties com-pared to the external veneers. This difference was due to the variation explained above of knot proportion on these two positions where the external veneer contains a lower knot proportion compared to the internal veneer, thus providing better mechanical properties. The higher knot proportion on the surface of internal veneer may be related to natural prun-ing. Knudson et al. (2007) reported that the number of knots in spruce veneers increases from sapwood to heartwood. This author explained that more natural pruning occurred on older trees. Lower mechanical properties on the internal veneer of beech may also be caused by the presence of a small part of juvenile wood. Mature wood on the external position may provide greater strength on oak LVL.
Knot size external posi on
2.1 3 4.2 2.1 3 4.2 0 1 2 0 10 20 30 40 50
peeling thickness (mm)
Kn ot si ze (% ) Kn ot fre quen cyKnot size internal posi on
external posi on internal posi on
A
B
Knot frequency Knot frequency
Fig. 4 Mean knot size and frequency of a oak veneer and b beech veneer according to different peeling thicknesses and veneer positions inside the trunk
3.2 The influence of veneer thickness on mechanical properties of LVL made of secondary quality hardwood
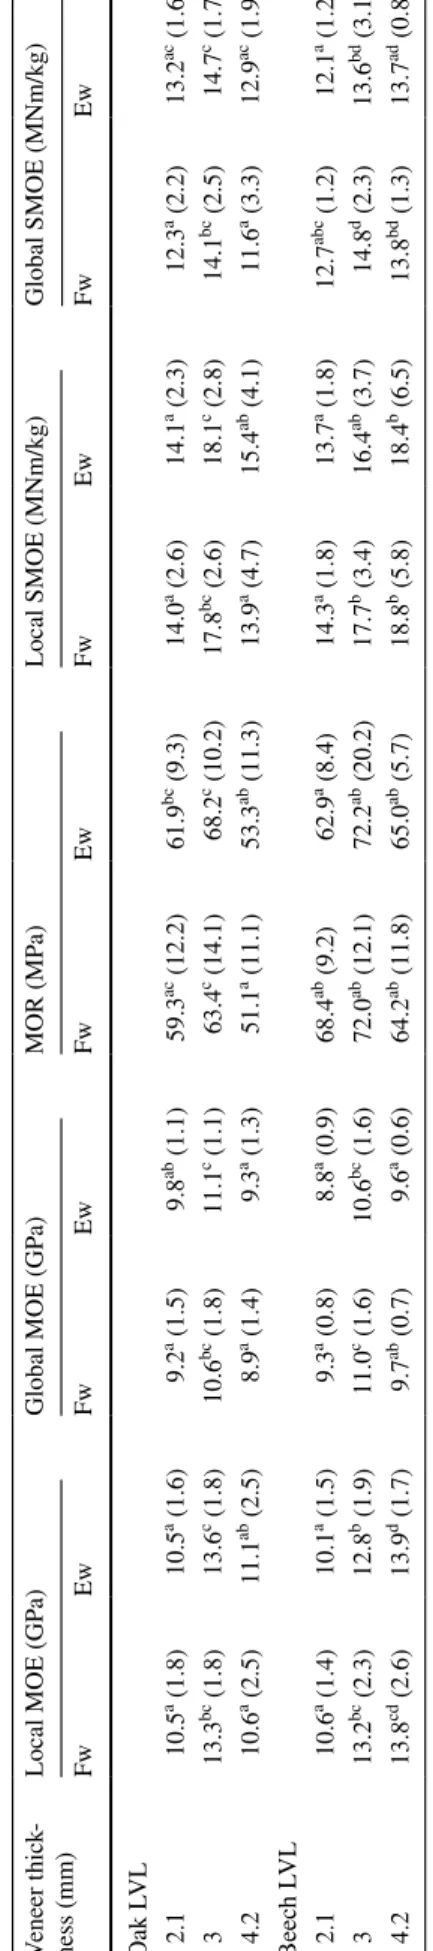
Table 4 presents the mechanical properties of oak and beech LVL measured using destructive tests. In addition, it also provides the specific modulus of elasticity (SMOE) for both local and global measurements. The objective of using spe-cific modulus was to precisely compare the effect of veneer thickness on the mechanical properties of LVL without any distortion due to the different wood densities. There was no significant influence of testing direction on the mechanical properties for either species. Previous studies show contrast-ing results on the effect of the loadcontrast-ing direction on LVL mechanical properties. Nevertheless, the results in this study are similar to previous reports on beech, poplar and pine (Burdurlu et al. 2007; Daoui et al. 2011; Souza et al. 2011; Rahayu et al. 2015).
As expected, global MOE and SMOE are generally lower than local ones, which can be explained by the punching under the loading heads, the disregard of shear effects, and deformations of the loading machine. Generally, the relation-ships between LVL made of different veneer thicknesses are maintained, regardless of whether global or local MOE are considered, showing the relative homogeneity of mechanical behavior along the length of an LVL beam.
For oak, the highest local and global SMOE were found for LVL made from 3-mm-thick veneers. The oak LVL made from 2.1-mm- and 4.2-mm-thick veneer showed relatively similar values of local and global SMOE. The highest SMOE values for beech were found for LVL made from 3-mm- or 4.2-mm-thick veneers, which are not significantly different (p < 0.05). It should be recalled, however, that 4.2-mm-thick beech veneers presented a lower knot proportion. The high-est mean MOR value for both species was found on LVL
made of 3-mm-thick veneer, whereas the lowest was on the LVL made of the thickest veneer. However, the differences are not significant for beech at the 0.05 level.
The standard deviation of local and global SMOE rises with the increase in veneer thickness. The increase in the standard deviation of both local and global SMOE may be related to the effect of the distribution of defects. Since the defects are better distributed in the LVL made of thinner veneer, the variation of SMOE tends to be lower compared to the LVL made of thicker veneer. For LVL with thicker veneer, the defects are more concentrated and therefore gen-erate more variations of SMOE. These results are consistent with previous reports on poplar (Rahayu et al. 2015).
Based on the three mechanical parameters compared and its standard deviation, 3-mm-thick veneer generally pro-duced the optimum LVL mechanical properties. This veneer thickness complies with the common veneer thickness used to produce LVL, i.e., 3–3.5 mm (Pollmeier 2013). Accord-ing to the literature, the thinnest veneer should provide the best mechanical properties since more veneer layers inside the LVL should give a better distribution of defects and, consequently, better mechanical properties. This contradic-tion may be explained by the different wood quality used in this research. In general, the previous study used knot-free or much less defective veneer to produce LVL. It appears that in the present study, the lowest veneer thickness had the highest knot proportion (Fig. 3) and could thus have influenced the results. It is, however, difficult to separate the effect of knots from the effect of veneer thickness and lathe checks in this case.
As expected, the MOE and MOR of beech LVL made of secondary quality beech in this study are much lower than those in a previous study using knot-free LVL (Aydın et al.
2004; Burdurlu et al. 2007; Daoui et al. 2011; Knorz and van de Kuilen 2012). Burdurlu et al. (2007), who studied the
Table 3 Comparing density, MOE and MOR of LVL made of internal veneer and external veneer
fm modulus of rupture (MOR), Em,g global modulus of elasticity (global MOE)
Different letters above the numbers signify statistically different populations, based on Tukey’s post hoc HSD tests (p < 0.05). Values in parentheses are standard deviations
Species Test direction Parameters Internal External
Mean Mean Oak LVL density (Kg/cm3) 751.44b (37.7) 742.2a (33.2) Flatwise Em,g (GPa) 9.4a (2) 9.7a (1.4) fm (Mpa) 57.7a (14.6) 58.8a (12) Edgewise Em,g (GPa) 9.8a (1.6) 10.3a (1.1) fm (Mpa) 58.8a (13.4) 63.3a (9.4) Beech LVL density 740.3a (38.4) 731.4a (68.1) Flatwise Em,g (GPa) 9.8a (1.4) 10.5b (1.3) fm (Mpa) 65.9a (10.9) 72.1b (11) Edgewise Em,g (GPa) 9.4a (1.1) 10.1b (1.6) fm (Mpa) 63a (9.1) 71.8b (17.7)
effect of ply organizations and loading direction on beech LVL MOE and MOR, reported that beech mean MOE in the flatwise and edgewise directions was 12,679.6 MPa and 13,235.10 MPa, respectively, whereas the mean MOR was 152.36 MPa and 148.30 MPa, respectively. Compared to knot-free beech LVL, the mean MOE measured in the present study is more than 25% lower, whereas the mean MOR is more than 50% lower. Furthermore, compared to the mechanical properties of beech LVL reported by Daoui et al. (2011), the mean MOE value is also more than 25% lower, but the MOR value is only about 30% lower. Nevertheless, the MOE of LVL made of the secondary quality oak and beech in the present study are comparable or even higher than the MOE of LVL made of other hardwood species such as eucalyptus, maple, aspen and poplar (Aydın et al. 2004; Shukla and Kamdem 2008; Rahayu et al. 2015). Although the mechanical properties of LVL made from secondary quality beech and oak are acceptable, further studies are needed to assess its suitability for the manufacture of com-mercially acceptable LVL with regard to the recovery rates and production costs.
3.2.1 Dynamic shear modulus
Table 5 provides the dynamic MOE and shear modulus measured using the vibration method. The highest dynamic SMOE for both species was found on the LVL made of 3-mm-thick veneer. These results are consistent with the trend on global SMOE previously observed. However, the dynamic MOE was always higher than that found in previ-ous studies (Daoui et al. 2011; Souza et al. 2011; Rahayu et al. 2015). Nevertheless, these results are important since they measure the MOE along the specimen, unlike the local
Table
4
Com
par
ing local MOE, g
lobal MOE and t
he specific MOE measur
ed using des tructiv e tes ts on beec h and oak L VL made of differ ent v eneer t hic knesses Values f ollo wed b y a differ ent le tter wit hin a column ar e s tatis ticall y differ ent at p = 5% (AN OV A and T uk ey’ s HSD tes t). V alues in par ent heses ar e s tandar d de viations Veneer t hic k-ness (mm) Local MOE (GP a) Global MOE (GP a) MOR (MP a) Local SMOE (MNm/k g) Global SMOE (MNm/k g) Fw Ew Fw Ew Fw Ew Fw Ew Fw Ew Oak L VL 2.1 10.5 a (1.8) 10.5 a (1.6) 9.2 a (1.5) 9.8 ab (1.1) 59.3 ac (12.2) 61.9 bc (9.3) 14.0 a (2.6) 14.1 a (2.3) 12.3 a (2.2) 13.2 ac (1.6) 3 13.3 bc (1.8) 13.6 c (1.8) 10.6 bc (1.8) 11.1 c (1.1) 63.4 c (14.1) 68.2 c (10.2) 17.8 bc (2.6) 18.1 c (2.8) 14.1 bc (2.5) 14.7 c (1.7) 4.2 10.6 a (2.5) 11.1 ab (2.5) 8.9 a (1.4) 9.3 a (1.3) 51.1 a (11.1) 53.3 ab (11.3) 13.9 a (4.7) 15.4 ab (4.1) 11.6 a (3.3) 12.9 ac (1.9) Beec h L VL 2.1 10.6 a (1.4) 10.1 a (1.5) 9.3 a (0.8) 8.8 a (0.9) 68.4 ab (9.2) 62.9 a (8.4) 14.3 a (1.8) 13.7 a (1.8) 12.7 abc (1.2) 12.1 a (1.2) 3 13.2 bc (2.3) 12.8 b (1.9) 11.0 c (1.6) 10.6 bc (1.6) 72.0 ab (12.1) 72.2 ab (20.2) 17.7 b (3.4) 16.4 ab (3.7) 14.8 d (2.3) 13.6 bd (3.1) 4.2 13.8 cd (2.6) 13.9 d (1.7) 9.7 ab (0.7) 9.6 a (0.6) 64.2 ab (11.8) 65.0 ab (5.7) 18.8 b (5.8) 18.4 b (6.5) 13.8 bd (1.3) 13.7 ad (0.8)
Table 5 Comparing the mechanical properties measured using a non-destructive test according to different veneer thicknesses and loading direction
Values followed by a different letter within a column are statistically different at p = 5% (ANOVA and Tukey’s HSD test). Values in paren-theses are standard deviations
Veneer thickness
(mm) Dynamic SMOE (MN m/kg) Shear SMOE (MN m/kg)
Fw Ew Fw Ew Oak LVL 2.1 17.3b (1.8) 16.6a (1.9) 0.9a (0.3) 1.1b (0.2) 3 18.8c (1.2) 18.8b (1.4) 0.9a (0.2) 0.8a (0.2) 4.2 15.9a (2) 16.5a (1.9) 1.2b (0.4) 0.8a (0.2) Beech LVL 2.1 15.5a (1.3) 14.9a (1.3) 1.1a (0.2) 0.9b (0.2) 3 17.7b (2.4) 17.9b (3.8) 1.3b (0.3) 0.9b (0.1) 4.2 17.0b (1.2) 17.2b (0.7) 1.1a (0.3) 0.7a (0.1)
MOE, while also confirming the computation used for the global MOE.
For the edgewise test, the LVL made of the thinnest veneer generated the highest shear modulus for both spe-cies at the 0.05 level. The thicker the veneer is, the lower the shear modulus will be. The decrease in the shear modulus for the edgewise direction with thicker veneer in this study confirmed the previous report by Pot et al. (2015) who stud-ied the effect of veneer lathe checks on beech MOE using a numerical approach. In addition, Melo and Menezzi (2014) also reported the decrease in shear strength by the increase in veneer thickness in LVL made of Parica (Schizolobium
amazonicum). However, the correlation between lathe check
and shear modulus could be biased by the direction of the lathe checks. Pot et al. (2015) explained that the lathe check is more penalizing in the edgewise direction because it is almost perpendicular to the veneer surface.
3.3 The relationship between veneer quality and LVL mechanical properties
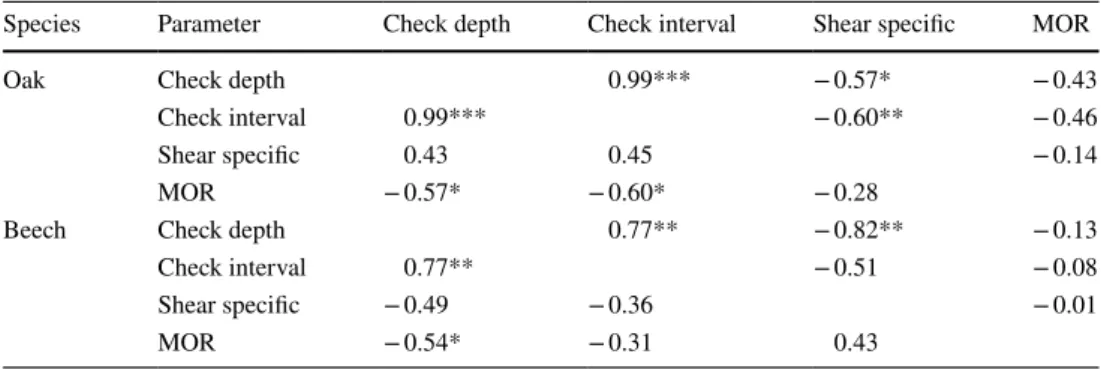
3.3.1 Influence of lathe check properties on LVL specific shear modulus and MOR
To understand the effect of lathe check on LVL mechanical properties, the correlations among the measured parameters were analyzed and are presented in Table 6. In agreement with the literature, these results demonstrate the positive correlation between lathe check depth and lathe check inter-val (Pałubicki et al. 2010). Deeper lathe check increases the distance between two lathe checks and lowers the check frequency. The correlation between lathe check depth and lathe check interval in oak (r = 0.99) was better than beech (r = 0.77).
Specific shear modulus and MOR showed negative cor-relations with lathe check depth and check interval except for flatwise tested oak. An increase in lathe check depth and lathe check interval tended to lower the specific shear
modulus in the edgewise direction, as mentioned before. The correlation between both parameters was better in the edgewise than in the flatwise test. Contrary to specific shear modulus, MOR has a better correlation with lathe check properties in the flatwise direction. Increased lathe check depth and check interval decreased the LVL strength.
The negative correlation between lathe check depth and shear modulus supported previous reports by Ebihara (1981). In addition, this author also reported that shear strength par-allel to the grain direction on both edgewise and flatwise LVL decreases when the veneer thickness increases. A more recent study by Pot et al. (2015) proposes a numerical model able to explain this trend. No correlation was found between lathe check properties and MOE. These results were also in accordance with previous reports on the effect of lathe check and veneer thickness on the MOE (Ebihara 1981; Hoover et al. 1987; Pot et al. 2015).
3.3.2 Influence of weighted knot proportion on global SMOE
The correlation between weighted knot proportion and global SMOE is presented in Table 7. Two types of weighted knot proportions were used for the analysis. The first used the weighted knot proportion of all of the veneer layers that constituted the LVL. The second weighted knot proportion was calculated using the data from the two outer veneers only.
Both weighted knot proportions revealed negative cor-relations with SMOE. These negative corcor-relations could be seen on both hardwood species and the two test directions. The increase in weighted knot proportion on the veneer sur-face decreases the global SMOE on oak and beech LVL. The correlations in the edgewise direction are better using weighted proportions from all of the veneer. Flatwise tested oak was better correlated with the weighted knot proportion of the outer veneer. Beech revealed better correlation than oak for both weighted knot proportions.
Table 6 Correlation between lathe check properties and LVL mechanical properties in flatwise (lower triangle and black color) and edgewise (upper triangle and gray color) direction
*Correlation is significant at the 0.05 level **Correlation is significant at the 0.01 level ***Correlation is significant at the 0.001 level
Species Parameter Check depth Check interval Shear specific MOR
Oak Check depth 0.99*** − 0.57* − 0.43
Check interval 0.99*** − 0.60** − 0.46
Shear specific 0.43 0.45 − 0.14
MOR − 0.57* − 0.60* − 0.28
Beech Check depth 0.77** − 0.82** − 0.13
Check interval 0.77** − 0.51 − 0.08
Shear specific − 0.49 − 0.36 − 0.01
For the edgewise direction, the LVL MOE is determined by the sum of the MOE of each veneer. The contribution of each layer to the LVL MOE is equal. This explains the better correlation using the weighted knot proportion of all the veneers in the edgewise direction compared to the use of outer veneers.
For the flatwise direction, the location of each veneer determines their contribution to the LVL MOE. This differ-ent contribution of each layer is due to the differdiffer-ent stresses faced by the outer layers in comparison to the central layers (Girardon et al. 2016), which can explain why correlations with flatwise SMOE were better (or similar) for beech using the data from outer veneers.
3.3.3 Effect of the weighted knot proportion on SMOR The correlations between the two types of weighted knot proportions and SMOR are presented in Table 8. Low nega-tive correlations were found between both parameters on both species and the two loading directions. The correlations of weighted knot proportion with LVL MOR were lower compared to the LVL SMOE. For both species, the corre-lation between the weighted knot proportion of all of the veneers was better in the edgewise than the flatwise direc-tion. For both test directions, the correlations were better using the weighted knot proportions of all of the veneer except for flatwise beech that was slightly better correlated with the weighted knot proportion of the outer veneer.
4 Conclusion
High knot proportions were found on the surface of veneer prepared from secondary quality hardwood. Veneer lathe check depth and interval increase with the increase in
veneer thickness. For both species, the 3 mm thick veneer provided the optimum mechanical properties for LVL. The testing direction had no significant influence on the mechanical properties of either species. The average MOE values obtained were 13.2 GPa for beech LVL and 13.3 GPa for oak LVL, whereas the MOR was 72.0 MPa and 63.4 MPa, respectively, in the flatwise direction. Such mechanical properties are comparable to those of LVL manufactured from other species of hardwood. The increase in weighted knot proportion provided lower MOE and MOR on LVL. The weighted knot proportion can bet-ter predict the LVL MOE. Deeper lathe checks and higher lathe check intervals generated lower shear modulus in the edgewise direction for both species. No correlation was found between lathe check properties and LVL MOE. The radial position of veneer inside the tree trunk influences the physical and mechanical properties of LVL. Internal veneer produced higher LVL density but provided lower mechanical properties than external veneer. These lower mechanical properties were due to a higher knot propor-tion on the internal veneer surface than on the veneer from external position.
Acknowledgements The authors are grateful for the financial support of GDR 3544 Science du Bois and the Indonesia Endowment Fund for Education. We also wish to thank our partners and funders of the Xylo-mat Technical Platform from the XyloXylo-mat Scientific Network funded by the ANR-10-EQPX-16 XYLOFOREST project and the Bourgogne Franche Comté Region.
Compliance with ethical standards
Conflict of interest The authors declare that they have no conflict of interest.
Table 7 Correlation between weighted knot proportion of all of the veneers and the outer veneer with SMOE in the flatwise and edgewise direction
Species Test direction All veneers Outer veneers
Linear equation r2 Linear equation r2
Oak Flatwise y = − 1.0631x + 17.11 0.33 y = − 1.6549x + 17.152 0.43 Edgewise y = − 1.371x + 18.505 0.57 y = − 1.5072x + 17.822 0.44 Beech Flatwise y = − 2.9489x + 19.601 0.73 y = − 2.9095x + 18.906 0.70 Edgewise y = − 2.5942x + 18.624 0.71 y = − 2.1979x + 17.717 0.50
Table 8 Correlation between
weighted knot proportion of all of the veneers and the outer veneer with SMOR in the flatwise and edgewise direction
Species Test direction All veneer Outer veneer
Linear equation r2 Linear equation r2
Oak Flatwise y = − 0.0043x + 0.0962 0.10 y = − 0.0026x + 0.0923 0.02 Edgewise y = − 0.01x + 0.1099 0.36 y = − 0.008x + 0.1016 0.15 Beech Flatwise y = − 0.015x + 0.1233 0.35 y = − 0.0157x + 0.1204 0.37 Edgewise y = − 0.0146x + 0.1198 0.42 y = − 0.0107x + 0.1133 0.22
References
Aydın İ, Çolak S, Çolakoğlu G, Salih E (2004) A comparative study on some physical and mechanical properties of Laminated Veneer Lumber (LVL) produced from Beech (Fagus orientalis) and Euca-lyptus (EucaEuca-lyptus camaldulensis) veneers. Holz Roh Werkst 62:218–220. https ://doi.org/10.1007/s0010 7-004-0464-3
Bendtsen B (1978) Properties of wood from improved and intensively managed trees. For Prod J 28:61–72
Brancheriau L, Bailleres H (2002) Natural vibration analysis of clear wooden beams: a theoretical review. Wood Sci Technol 36:347– 365. https ://doi.org/10.1007/s0022 6-002-0143-7
Brancheriau L, Paradis S, Baillères H (2007) Bing—beam identifica-tion by non-destructive grading (Cirad). https ://doi.org/10.18167 /62696 E67. http://agrit rop.cirad .fr/57623 0/. Accessed 20 July 2018
Burdurlu E, Kilic M, Ilce AC, Uzunkavak O (2007) The effects of ply organization and loading direction on bending strength and modu-lus of elasticity in laminated veneer lumber (LVL) obtained from beech (Fagus orientalis L.) and lombardy poplar (Populus nigra L.). Constr Build Mater 21:1720–1725. https ://doi.org/10.1016/j. conbu ildma t.2005.05.002
Daoui A, Descamps C, Marchal R, Zerizer A (2011) Influence of veneer quality on beech LVL mechanical properties. Maderas Cienc Tecnol 13:69–83. https ://doi.org/10.4067/S0718 -221X2 01100 01000 07
Denaud L, Bléron L, Ratle A, Marchal R (2007) Online control of wood peeling process: acoustical and vibratory measurements of lathe checks frequency. Ann For Sci 64:569–575. https ://doi. org/10.1051/fores t:20070 34
Ebihara T (1981) Shear properties of laminated-veneer lumber (LVL). J Jpn Wood Res Soc 27:788–794
Eckelman CA (1993) Potential uses of laminated veneer lumber in furniture. For Prod J 43:19–24
Girardon S, Denaud L, Pot G, Rahayu I (2016) Modelling the effects of wood cambial age on the effective modulus of elasticity of poplar laminated veneer lumber. Ann For Sci 73:615–624. https ://doi. org/10.1007/s1359 5-016-0569-y
Hoover WL, Ringe JM, Eckelman CA, Youngquist JA (1987) Material design factors for hardwood laminated-veneer-lumber. For Prod J USA 37:15–23
IGN (2016) La memento inventaire forestier: la foret en ciffre et en carte. In: Institut national de l’information géographique et for-estière, Paris (The memento of the forest inventory: the forest in figures and maps). National Institute for geographical and forestry information, Paris (in French). https ://inven taire -fores tier.ign.fr/ IMG/pdf/16112 2_memen to201 6-2.pdf
Kilic M, Hiziroglu S, Burdurlu E (2006) Effect of machining on sur-face roughness of wood. Build Environ 41:1074–1078. https ://doi. org/10.1016/j.build env.2005.05.008
Knorz M, van de Kuilen J (2012) Development of a high-capacity engineered wood product—LVL made of European beech (Fagus sylvatica L.). In: Proceeding of the 12th world conference on tim-ber engineering, Auckland, pp 487–495
Knudson RM, Wang BJ, Zhang SY (2007) Properties of veneer and veneer-based products from genetically improved white spruce plantations. Wood Fiber Sci 38:17–27
Kretschmann DE, Moody RC, Pellerin RF et al (1993) Effect of vari-ous proportions of juvenile wood on laminated veneer lumber. US Department of Agriculture, Forest Service, Forest Products Laboratory, Washington
Lam F (2001) Modern structural wood products. Prog Struct Eng Mater 3:238–245. https ://doi.org/10.1002/pse.79
Marchall R (1995) Une alternative pour les bois feuillus de qualité secondaire: les LVL (laminated veneer lumber), lamelles-colles de
placages. (An alternative for secondary quality hardwoods: LVL (laminated veneer lumber), glued laminated veneer) (in French). Rev For Fr 47:375–382
McGavin RL, Bailleres H, Hamilton M, Blackburn D, Vega M, Ozarska B (2014) Variation in rotary veneer recovery from australian plan-tation Eucalyptus globulus and Eucalyptus nitens. BioResources 10:313–329. https ://doi.org/10.15376 /biore s.10.1.313-329
McKeever DB (1997) Engineered wood products: a response to the changing timber resource. Pacific Rim Wood Market Report. https ://www.fpl.fs.fed.us/docum nts/pdf19 97/mckee 97b.pdf. Accessed 20 June 2018
Melo RR de, Menezzi CHSD (2014) Influence of veneer thickness on the properties of LVL from Paricá (Schizolobium amazoni-cum) plantation trees. Eur J Wood Prod 72:191–198. https ://doi. org/10.1007/s0010 7-013-0770-8
Ministère de l’Agriculture et de l’Alimentation-Agreste (2017) Chif-fres et Données Agriculture: Récolte de bois et production de sciages en 2016. Ministère de l’Agriculture et de l’Alimentation-Agreste, Paris (Agriculture Data and Figures: Timber Harvesting and Sawmill Production in 2016. The ministry of Agriculture and Food-Agreste, Paris) (in French)
Moore J, Achim A, Lyon A, Mochan S, Gardiner B (2009) Effects of early re-spacing on the physical and mechanical properties of Sitka spruce structural timber. For Ecol Manag 258:1174–1180.
https ://doi.org/10.1016/j.forec o.2009.06.009
Nepveu G (1990) Les facteurs influencant la qualite du bois de chene (Chene rouvre, Chene pedoncule). (Factors influencing the quality of oak wood (Chene rouvre, Chene pedoncule)) (in French). Rev For Fr 42:128–133
Ozarska B (1999) A review of the utilisation of hardwoods for LVL. Wood Sci Technol 33:341–351. https ://doi.org/10.1007/s0022 60050 120
Pałubicki B, Marchal R, Butaud J-C, Denaud L-E, Bleron L, Collet R (2010) A Method of lathe checks measurement; SMOF device and its software. Eur J Wood Prod 68:151–159. https ://doi. org/10.1007/s0010 7-009-0360-y
Pollmeier (2013) Declaration of performance. https ://www.pollm eier. com/en_US/dam/jcr:ad768 dfe-ccc2-489d-9283-80cae 1e57c 61/ EN_Decla ratio n_of_Perfo rmanc e_PM-005-2018.pdf. Accessed 20 June 2018
Pot G, Denaud L-E, Collet R (2015) Numerical study of the influence of veneer lathe checks on the elastic mechanical properties of laminated veneer lumber (LVL) made of beech. Holzforschung 69:337–345. https ://doi.org/10.1515/hf-2014-0011
Rahayu I, Denaud L, Marchal R, Darmawan W (2015) Ten new poplar cultivars provide laminated veneer lumber for structural appli-cation. Ann For Sci 72:705–715. https ://doi.org/10.1007/s1359 5-014-0422-0
Rohumaa A, Viguier J, Girardon S, Krebs M, Denaud L (2018) Lathe check development and properties: effect of log soaking tempera-ture, compression rate, cutting radius and cutting speed during peeling process of European beech (Fagus sylvatica L.) veneer. Eur J Wood Prod 76:1653–1661. https ://doi.org/10.1007/s0010 7-018-1341-9
Schaffer EL, Jokerst RW, Moody RC et al (1972) Feasibility of produc-ing a high-yield laminated structural product: general summary. USDA Forest Service Research Paper FPL 175. Forest Products Laboratory, Madison
Shukla SR, Kamdem DP (2008) Properties of laminated veneer lum-ber (LVL) made with low density hardwood species: effect of the pressure duration. Holz Roh Werkst 66:119–127. https ://doi. org/10.1007/s0010 7-007-0209-1
Souza F de, Menezzi CHSD, Bortoletto Júnior G (2011) Material prop-erties and nondestructive evaluation of laminated veneer lumber (LVL) made from Pinus oocarpa and P. kesiya. Eur J Wood Prod 69:183–192. https ://doi.org/10.1007/s0010 7-010-0415-0
Thibaut B (1988) Le processus de coupe du bois par déroulage (The cutting process of wood by peeling) (in French). Dissertation, University of Science and Technology of Languedoc
Viguier J, Jehl A, Collet R, Bleron L, Meriaudeau F (2015) Improv-ing strength gradImprov-ing of timber by grain angle measurement and mechanical modeling. Wood Mater Sci Eng 10:145–156. https :// doi.org/10.1080/17480 272.2014.95107 1
Viguier J, Bourreau D, Bocquet J-F, Pot G, Bleron L, Lanvin J-D (2017a) Modelling mechanical properties of spruce and Douglas fir timber by means of X-ray and grain angle measurements for strength grading purpose. Eur J Wood Prod 75:527–541. https :// doi.org/10.1007/s0010 7-016-1149-4
Viguier J, Marcon B, Girardon S, Denaud L (2017b) Effect of forestry management and veneer defects identified by X-ray analysis on mechanical properties of laminated veneer lumber beams made of beech. BioResources 12:6122–6133
Viguier J, Bourgeay C, Rohumaa A, Pot G, Denaud L (2018) An inno-vative method based on grain angle measurement to sort veneer and predict mechanical properties of beech laminated veneer lum-ber. Constr Build Mater 181:146–155. https ://doi.org/10.1016/j. conbu ildma t.2018.06.050
Youngquist J, Laufenberg T, Bryant B (1984) End jointing of laminated veneer lumber for structural use. For Prod J 34:25–32
Zobel BJ, Sprague JR (2012) Juvenile wood in forest trees. Springer, Berlin