Faculté de génie
Département de génie civil
A
SSESSMENT OF
S
HEAR
M
ODULUS FOR
G
RANULAR
S
OILS
,
WITH
S
MALL
-
TO
L
ARGE
-S
TRAIN
M
ODULI
C
ORRELATIONS
by
I
BRAHIMA
HMEDF
AWZYL
ASHIN(I
BRAHIML
ASHIN)
A dissertation submitted in partial fulfillment of the requirements for the degree of
Doctor of Philosophy
In
Civil Engineering (Geotechnical Engineering)
Sherbrooke (Québec), Canada March 2021
Faculté de génie
Département de génie civil
É
VALUATION DU MODULE DE CISAILLEMENT DES SOLS
GRANULAIRES
,
AVEC CORRÉLATIONS DU MODULE DE
PETITES À GRANDES DÉFORMATIONS
Thèse de doctorat Spécialité : Génie civil
I
BRAHIM
L
ASHIN
Jury: Mourad Karray (directeur de recherche) Patrice Rivard (Examinateur interne rapporteur) Anna Chiaradonna (Examinateur externe) Michael James (Examinateur externe) Yannic Ethier (Examinateur externe)
i
A
BSTRACT
A
proper estimation of the strain-dependent shear modulus (G) of soils constitutes a fundamental part of analyzing the dynamic response of grounds, seismic soil–structure interactions, and soil liquefaction potential. The initial shear modulus (Go) can besystematically obtained from laboratory measurements of shear-wave velocities (Vs) as the soil
elastic stiffness is straightforwardly related to its shear-wave propagation velocity. However, the shear modulus measurements over a broad range of shear strains can be performed through specialized testing apparatus.
In the current study, correlations between Go and oedometer constrained modulus (Moedo) at
large deformations were established, as an important step toward more precise modelling of soil deformation behavior. To establish these correlations, Vs of 22 different granular soils of
various physical characteristics were measured experimentally using the piezoelectric ring-actuator technique (P-RAT) incorporated in the conventional oedometer cell. For each sample tested, the development of Moedo with the development of relative density (Id), as well as the
void ratio (e), was recorded. Then, the obtained Vs and Moedo/Go trends were correlated to the
physical parameters of the tested granular soils with the development of e and Id. A practical
application employing the achievements in geotechnical engineering design was also evaluated. Based on the proposed correlations, geotechnical designers can easily estimate in situ stress-settlement behavior from the predicted Moedo and Id values using simple in situ
measurements.
In addition, as a practical application of using Vs to estimate different geotechnical parameters,
a relationship between Vs and other geotechnical parameters of rockfill soils at large strains
was investigated towards more precise modelling of earth-structure deformation behaviour. Four rockfill samples of different gradations, extracted from the rockfill materials used in the construction of the Romaine II dam, were experimented to correlate Vs to Duncan-Chang initial
modulus (Ei). Numerical simulations using a two-dimensional (2D) finite difference method
situ measurements, proofing the ability of the proposed relationships to efficiently predict Ei
related to the minor principal stress (3) from in-situ Vs measurement.
Furthermore, as the RC method, in particular, constitutes one of the most popular apparatus used to generate modulus reduction curves for soils, a three-dimensional (3D) finite-difference (FD) simulations of RC test was used to examine the influence of some sources of error affect the RC results such as driving mass, the geometry of the specimen, mode of vibrations, and boundary conditions on RC test. Results showed that the attachment of the instrumentation on the sample is a driving factor to contribute the error in the estimation of the soil dynamic characteristics.
Finally, four laboratory techniques were used to estimate the strain-dependent shear modulus of clean sand with different strain () levels: Resonant column test (RC), piezoelectric ring-actuator technique (P-RAT), triaxial simple shear test (TxSS) and direct simple shear test (DSS).
The results show that the RC overestimated the values of Go compared with P-RAT especially
at loose state due to the non-elastic behavior of soil. TxSS and DSS results showed acceptable
compatibility in the estimation of G at strains more than 0.1%. Based on a sigmoid function SIG-4 model; the cyclic soil response over a wide range of strains based on TxSS results was
predicted.
Keywords: Resonant column; piezoelectric ring-actuator technique; triaxial simple shear; direct simple shear; shear wave velocity; shear modulus; finite differences; deformation modulus; Duncan-Chang model.
iii
R
ÉSUMÉ
U
ne estimation correcte du module de cisaillement (G) des sols constitue une partie fondamentale de l’analyse de la réponse dynamique des sols, des interactions sismiques sol-structure, et du potentiel de liquéfaction du sol. Le module de cisaillement à petites déformations (Go) peut être systématiquement obtenu à partir de mesures en laboratoire desvitesses des ondes de cisaillement (Vs), car la rigidité élastique du sol est directement liée à sa
vitesse de propagation des ondes de cisaillement. Cependant, les mesures du module de cisaillement sur une large gamme de déformations de cisaillement nécessitent des d’appareils spécialisés.
Dans la présente étude, des corrélations entre le Go et le module contraint de l’œdomètre (Moedo)
à de grandes déformations ont été établies. Pour établir ces corrélations, des Vs de 22 sols
granulaires de diverses caractéristiques physiques ont été mesurés expérimentalement en utilisant la méthode P-RAT incorpore dans la cellule œdométrique conventionnelle. Pour chaque échantillon testé, l’évolution de Moedo avec la densité relative (Id), ainsi que l’indice des
vides (e), ont été enregistrées. Ensuite, les tendances Vs et Moedo /Go obtenues ont été corrélées
aux paramètres physiques des sols granulaires testés avec le développement de e et Id. Une
application pratique en génie géotechnique a également été évaluée. Sur la base des corrélations proposées, les ingénieurs en géotechniques peuvent facilement estimer le tassement in-situ à partir des valeurs de Moedo et Id prédites à l’aide de mesures in situ simples.
De plus, en tant qu’étape importante vers une modélisation plus précise du comportement de déformation du sol, une relation entre Vs et d’autres paramètres géotechniques des sols en
enrochement à grandes déformations a été étudiée en vue d’une modélisation plus précise du comportement des structures en terre. Quatre échantillons d’enrochement de différentes gradations, extraits des matériaux d’enrochement utilisés dans la construction du barrage de la Romaine II, ont été expérimentés pour corréler Vs au module initial de Duncan-Chang (Ei). Des
simulations numériques utilisant la méthode des différences finies (FDM) bidimensionnelles (2D) ont été effectuées sur la base du modèle hyperbolique de Duncan-Chang pour valider les
également été menées sur des mesures in situ, montrant la capacité des relations proposées à prédire efficacement Ei liée à la contrainte principale mineure (3) de la mesure Vs in situ.
En outre, comme les résultats du RC ont montré une incompatibilité avec d'autres appareils, des simulations de différences finies (FD) tridimensionnelles (3D) du test RC ont été utilisées pour examiner l'influence de certaines sources d'erreur sur les résultats RC tels que la masse motrice, la géométrie de l’échantillon, le mode de vibrations et les conditions aux limites sur les résultats des tests RC. Les résultats ont montré que la fixation de l’instrumentation sur l’échantillon est le facteur principal contribuant à l’erreur dans l’estimation des caractéristiques dynamiques du sol.
Enfin, quatre techniques ont été utilisées pour estimer avec précision le module de cisaillement du sable avec différents niveaux de déformation : la colonne résonante (RC), la technique des anneaux piézoélectrique (P-RAT), le cisaillement simple triaxial (TxSS), et test de cisaillement
simple direct (DSS). Les résultats montrent que le RC a surestimé les valeurs de Go par rapport
au P-RAT en particulier à l'état lâche en raison du comportement non uniforme du sol. Basé sur un modèle SIG-4 à fonction sigmoïde; la réponse cyclique du sol a été modélise sur une large gamme de déformation basée sur les résultats de TxSS.
Mots clés: colonne résonante ; technique d’actionneur piézoélectrique en anneau ; cisaillement simple triaxial ; cisaillement simple direct; vitesse des ondes de cisaillement ; module de cisaillement ; différences finies ; module de déformation ; modèle Duncan-Chang.
v
B
IBLIOGRAPHY
During the research work at the University of Sherbrooke, the candidate has participated in the following publications:
Journal Papers:
1. Lashin, I., Hussien, M.N., Karray, M. and Chekired, M., (2018). “Assessment of conventional interpretation methods of RC results based on 3D numerical simulations.” International Journal of Geomechanics, 18(12), DOI: 10.1061/(ASCE)GM.1943-5622.0001302.
2. Lashin, I., Ghali, M., Hussien, M.N., Chekired, M., and Karray, M. (2021). “Investigation of small- to large-strain moduli correlations of normally consolidated granular soils”, Canadian Geotechnical Journal, 58(1):1-22. DOI: 10.1139/cgj-2019-0741
3. Lashin, I., Ghali, M, Smith, M., Verret, D, and Karray, M. “Assessment of Duncan-Chang initial modulus in rockfill soils based on shear wave velocity measurements.”, Submitted to Canadian Geotechnical journal, Oct. 2020 - under review.
4. Lashin, I., Abdellaziz, M, Karray, M. and Chekired, M., “Assessment of strain dependent shear modulus of clean sands using different laboratory techniques.”, Submitted to Journal of Geotechnical and Geoenvironmental Engineering, Feb. 2021 - under review.
5. Karray, M., Abdellaziz, M, and Lashin, I., “Effect of driving system on Hardin-type Resonant Column”, submitted to Canadian Geotechnical Journal, Feb. 2021 - under revision.
Refereed Conferences Publications:
6. Lashin, I., Hussien, M.N., Karray, M. and Chekired, M., (2017), “3D sensitivity analyses of the factors affecting the estimation of the small-strain shear modulus from RC outcomes.”, GeoOttawa 2017, Ottawa, ON, Canada.
Correlating the large-strain static constrained modulus to the small-strain shear modulus for clean sands.”, Geo St.John’s 2019, St.John’s, NL, Canada.
vii
Dedication
The author dedicates this thesis to his parents who sacrificed their happiness and love for what is best for their children
To my beloved wife and son who sacrifice everything for the succession of this work To my beloved family
ACKNOWLEDGEMENT
Foremost the author must thank the Almighty Allah for facilitating the completion of this work. First, the author would like to thank his supervisor, Prof. Mourad KARRAY, for giving him the opportunity to conduct such project research and providing him with the necessary support at times when it was most needed. His inspiration, motivation, and insight have guided him through this research.
The author would like to return the favor in this achievement to his mentors Dr. Mahmoud N. HUSSIEN and Dr. Michael GHALI. It is no exaggeration to say that without them this work would not be as complete.
Many thanks to Profs. Michael James, Yannic Ethier, Patrice Rivard and Anna Chiaradonna for accepting to be jury members of this dissertation and giving time to read and review.
The author is grateful to the geotechnical laboratory technical staff, Alexandre Sévigny and Valérie Dumoulin for their technical assistance in the experimental program. The author also gratefully values the assistance of my colleagues. Their invaluable help during the experimental program. Special thanks for my friend Mohamed Eladawy for supporting me during these years.
The author is also thankful to the NSERC, Hydro-Québec, and Quebec Ministry of Transport for their financial support, and the University of Sherbrooke for the hospitality and the significance supportive of research demands.
The author is indebted to his parents and parents-in-law, the wishes and prayers of his sisters and brother were always support in the distress times.
Finally, I owe my beloved wife Dania all my success. Her support and continuous encouragement throughout all these years will never be forgotten. My little child Ismaiel have surely participated in this achievement. Their patience, understanding, sacrifices, and prayers throughout this research meant a lot to me. Thanks to my family.
ix
C
ONTENTS
ABSTRACT……… ... I
CONTENTS…… ... IX
LIST OF FIGURES ... XIII
LIST OF TABLES ... XVIII
CHAPTER 1INTRODUCTION ... 19
1.1 General Background 19
1.2 Objectives, Scopes and Statement of Originality 20
1.3 Methodology 21
1.4 Thesis organization 21
CHAPTER 2 LITERATURE REVIEW ... 24
2.1 Introduction 24
2.2 Shear Modulus (G) 25
2.2.1 Influence of void ratio and confining pressure 28 2.2.2 Influence of grain size distribution 28 2.2.3 Influence of particles shape 33 2.3 Laboratory Techniques Used in Shear Modulus Measurements 35
2.4 Resonant Column test 36
2.4.1 RC apparatus 36
2.4.2 RC interpretation methods 38 2.4.1 RC limitations and sources of error 40 2.5 Experimental assessment of soil degradation curve 43 2.6 Small- to large-strain moduli correlation 47 2.7 Constitutive models for rockfill materials 48 CHAPTER 3 EXPERIMENTAL PROGRAM... 53
3.1 Introduction 53
3.2 Resonant Column Apparatus (RC) 53 3.3 Piezoelectric Ring-Actuator Technique (P-RAT) 55 3.3.1 Modified Oedometer Cell for Rockfill samples 60 3.4 Combined Triaxial Simple Shear Apparatus (TxSS) 61
3.5 Direct simple shear test (DSS) 63 3.6 Characteristics of tested soils 66
3.7 Specimens preparation 72 CHAPTER 4 INVESTIGATION OF SMALL- TO LARGE-STRAIN MODULI CORRELATIONS OF
NORMALLY CONSOLIDATED GRANULAR SOILS ... 75
4.1 Introduction 76
4.2 Tested Material 78
4.3 P-RAT Experiments and Methodology 85 4.4 Analyses and Proposed Correlations 93 4.4.1 Shear Wave Velocity (Vs) 93
4.4.2 Small Strain Shear Modulus (Go) 99
4.4.3 Large-strain static constrained modulus (Moedo) 102
4.4.4 (Moedo/Go Id) Proposed Correlations 102
4.5 Discussion and Practical Application 105
4.6 Conclusions 112
CHAPTER 5 ASSESSMENT OF DUNCAN-CHANG INITIAL MODULUS IN ROCKFILL SOILS BASED ON SHEAR WAVE VELOCITY MEASUREMENTS ... 114
5.1 Introduction 115
5.2 Main Objectives of the paper 117 5.3 Duncan-Chang Hyperbolic Model 118
5.4 Romaine II Dam 119
5.5 Experimental Program 121
5.5.1 Tested material 121
5.5.2 Testing equipment 122
5.6 Expermental Results and Analysis 125 5.6.1 Large-strain static constrained modulus (Moedo) 125
5.6.2 Shear wave velocity (Vs) measurements 126
5.6.3 Shear wave velocity (Moedo/Go Id) correlation 130
5.7 Correlation between Duncan-Chang Initial Modulus (Ei) and Vs 131
5.7.1 Numerical simulation: description and calibration 131 5.7.2 Proposed (Ei-Vs) correlation 133
5.7.3 Validation of the proposed corelation 135
5.8 Conclusion 137
CHAPTER 6 ASSESSMENT OF CONVENTIONAL INTERPRETATION METHODS OF RC
RESULTS BASED ON 3DNUMERICAL SIMULATIONS ... 139
6.1 Introduction 140
6.2 Resonant Column (RC) Test and its Interpretation Methods: Basic State of Knowledge 142
xi
6.3 Numerical Modelling 143
6.4 Numerical Results and Discussion 145
6.4.1 Model Validation 146
6.4.2 Effect of Loading Modes in a Massless Driving System 147 6.4.3 Modeling of the Specimen Response in RC with a Driving System 150
6.5 Conclusions 158
CHAPTER 7 EFFECT OF DRIVING SYSTEM ON HARDIN TYPE RESONANT COLUMN ... 159
7.1 Introduction 160
7.2 Description of the apparatus 161
7.3 Calibration procedure 161
7.4 Effect of driving system stiffness 164 7.4.1 Description of the utilized connections 164 7.4.2 RC results and analysis 164
7.5 Conclusion 170
CHAPTER 8 ASSESSMENT OF STRAIN DEPENDENT SHEAR MODULUS OF CLEAN SANDS
USING DIFFERENT LABORATORY TECHNIQUES ... 172
8.1 Introduction 173
8.2 Tested Material 175
8.3 Testing Program 176
8.3.1 Piezoelectric ring-actuator technique (P-RAT) 176 8.3.2 Resonant Column (RC) test 179 8.3.3 Triaxial simple shear (TxSS) test 181
8.3.4 Direct simple shear (DSS) test 185 8.4 Analysis and Discussion of Go 193
8.5 Analysis and Discussion of GLog () Relationship 195 8.5.1 Analytical and Numerical Analyses of RC results 197
8.5.2 DSS results 200
8.5.3 Corrected GLog () Curves 201
8.6 Conclusions 204
CHAPTER 9 CONCLUSIONS AND RECOMMENDATIONS ... 205
9.1 Conclusions 205
9.2 Recommendations for Future Work 208
9.3 Conclusions 209
List of Figures
Figure 1.1– Thesis organization 23
Figure 2.1– Normalized modulus and damping curves with different zones of cyclic shearing strain amplitude for soil (slightly modified from Vucetic 1994) 27 Figure 2.2– Variation of (emax - emin) with Cu of granular material tested in the US and Japan
(After Menq 2003) 31
Figure 2.3– Variation of (emax - emin) with D50 of granular material tested in the US and Japan
(After Menq 2003) 31
Figure 2.4– Comparison of curves G /Go measured for eight sands with different coefficients
of uniformity Cu (after Wichtmann & Triantafyllidis 2009) 32
Figure 2.5–G /Go for different shear strain amplitude as a function of Cu (after Wichtmann &
Triantafyllidis 2009) 33
Figure 2.6–Shear modulus as a function of shear strain for different particle shapes (modified
after Bui et al. 2007) 34
Figure 2.7– Characteristic stiffness-strain behavior of soil with typical strain ranges for laboratory tests and structures (after Atkinson & Salfors 1991; Mair 1993) 35 Figure 2.8– Schematic of a resonant column device (ASTM D4015) 37 Figure 2.9– Free vibration decay method 39 Figure 2.10– Half-power-point bandwidth method 40 Figure 2.11– RC finite element simulation to investigate the errors related to equipment as well
as specimen compliance (after Bui 2009) 41 Figure 2.12– RC DEM model (after Perino and Barla 2014) 42 Figure 2.13– Proposed req relation based on stress integration approach (modified after
Sasanakul and Bay 2008) 43
Figure 2.14– Shear strains mobilized in in-situ and common laboratory techniques (after
Ishihara 1996) 44
Figure 2.15– Geq-c reduction by RC, CTS and DSDSS tests (after Cavallaro et al. 2003) 45
Figure 2.16– Comparison of shear modulus values obtained from different test methods (after
(after Wichtmann et al. 2017) 48 Figure 3.1– The utilized resonant column apparatus (GDS instruments 2018) 54 Figure 3.2– RC results: accelerometer output voltage as a function of system frequency. 55 Figure 3.3– The utilized piezoelectric ring-actuator technique (modified after Karray et al.,
2015; Elbeggo et al., 2019) 56 Figure 3.4– P-RAT signal processing and interpretation technique 59 Figure 3.5– Overview modified oedometer cell. 60 Figure 3.6–Schematic sketch of the triaxial simple shear (TxSS) apparatus. 62
Figure 3.7–TxSS results; shear stress () versus shear strain (). 63
Figure 3.8–The DSS apparatus used in this research (modified after Khashila 2020) . 64 Figure 3.9–Direct simple shear (DSS) test results; shear stress () versus shear strain () curves
with different strain levels. 65 Figure 3.10–Direct simple shear (DSS) test results; pore water pressure ratio (Ru) as a function
of shear strain (). 66
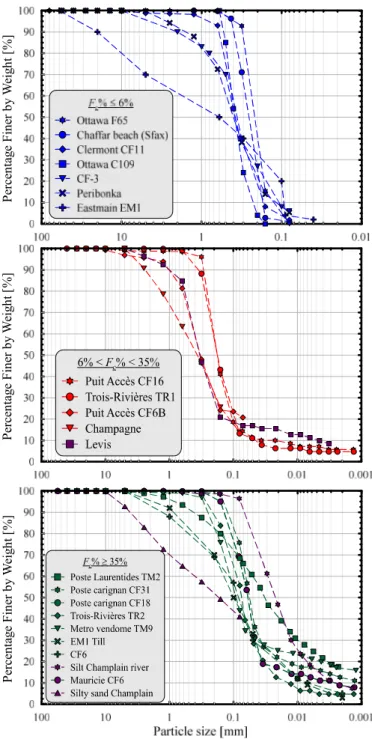
Figure 3.11– Particle size distribution curves of the granular samples tested: a) Soils with Fc
% 6%, b) Soils with 6% < Fc % < 35%, and c) Soils with Fc % 35% 68
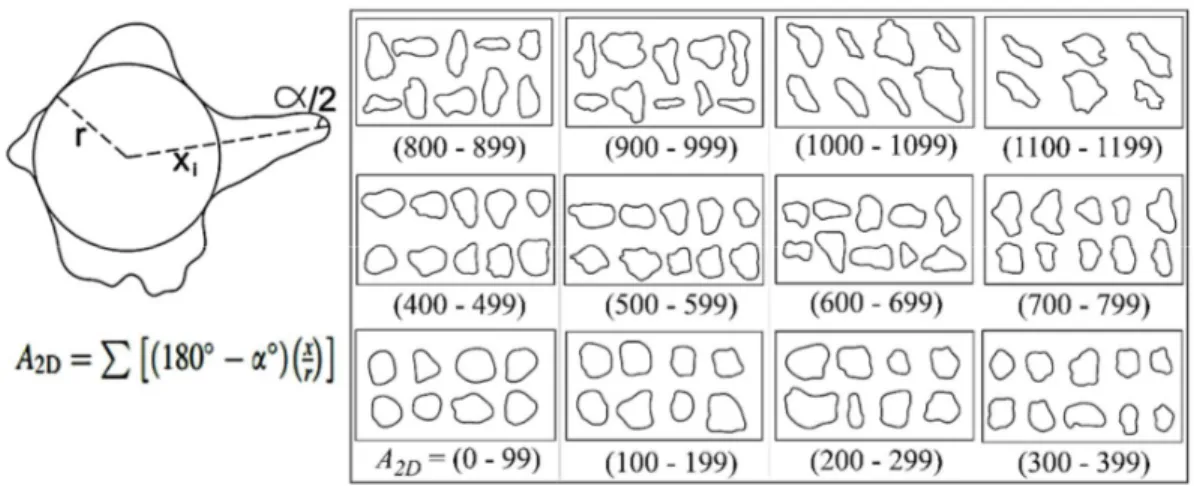
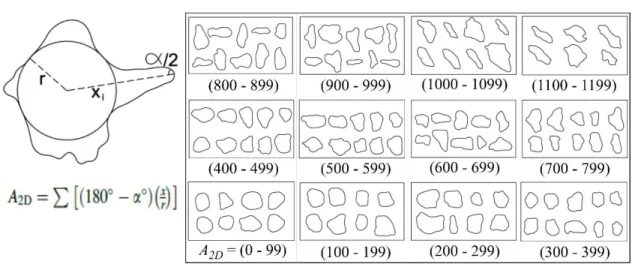
Figure 3.12–Definition and chart used for predicting the average A2D (modified after Ghali et
al., 2018a; Lees, 1964a & 1964b). 69 Figure 3.13– Digital image for Trois-Rivières soil. 69 Figure 3.14– Particle size distribution curves of the materials used in the construction of the
Romaine II dam in comparison with the experimented reconstituted rockfill
specimens. 71
Figure 3.15– RC specimen preparation. 74 Figure 4.1– Particle size distribution curves of the granular samples tested: a) Soils with Fc %
6%, b) Soils with 6% < Fc % < 35%, and c) Soils with Fc % 35% 80
Figure 4.2– Digital images for tested granular materials: a) Soils with Fc % 6%, b) Soils
with 6% < Fc % < 35%, and c) Soils with Fc % 35% 83
Figure 4.3– Definition and chart used for predicting the average A2D (modified after Ghali et
al., 2018a; Lees, 1964a & 1964b) 85 Figure 4.4– The utilized piezoelectric ring-actuator technique (modified after Karray et al.,
xv Figure 4.5– Signal processing and interpretation technique 89 Figure 4.6– Results of Chaffar Sand: a) Vertical stress-vertical strain curves; b) Vs as a function
of the vertical applied stress; c) Vs1 as a function of void ratio; d) Results of
different Oedometer cell sizes 91 Figure 4.7– Normalized shear wave velocity (Vs1) as a function of void ratio: a) Soils with Fc
% 6%, b) Soils with 6% < Fc % < 35%, and c) Soils with Fc % 35% 94
Figure 4.8– Comparison of measured and predicted Vs1 with the development of e 96
Figure 4.9– Comparison of measured and predicted Vs1 with the development of Id 98
Figure 4.10– a) Normalized shear modulus as a function of void ratio, and b) Normalized constrained modulus as a function of void ratio 101 Figure 4.11– Stress exponent α6 with the development of Id 103
Figure 4.12– Comparison of measured and predicted Moedo/G0 values with the development of
Id 104
Figure 4.13– Proposed charts for Moedo/G0 versus Id with the variation of A2D, D50 and Cu for
soils of Fc% 6% 106
Figure 4.14– Proposed charts for Moedo/G0 versus Id with the variation of A2D, D50 and Cu for
soils of 6% < Fc% < 35% 107
Figure 4.15– Proposed charts for Moedo/G0 versus Id with the variation of A2D, D50 and Cu for
soils of Fc% 35% 108
Figure 4.16– Proposed charts for Moedo/G0 versus Id with the variation of A2D, D50 and Cu for
soils of Fc% 35% (mixed soils of different geological provinces) 109
Figure 4.17– Variation of the allowable bearing pressure, q / 25 mm settlement with the width of footing, modified after Terzaghi and Peck (1996). 111 Figure 5.1– Typical cross section of Romaine II dam 120 Figure 5.2– Particle size distribution curves of the materials used in the construction of the
Romaine II dam in comparison with the experimented reconstituted rockfill
specimens 121
Figure 5.3–a) Overview of the experimental setup; and b) dimensions of maximum particle size tested in the oedometer cell. 124 Figure 5.4–Results of 3O rockfill: a) vertical stress-vertical strain curves; b) Vs as a function
of void ratio. 129 Figure 5.6 Comparison of measured and predicted Moedo/Go values with the development of Id.
130 Figure 5.7– Comparison between literature experimental results and numerical Duncan-Chang model: a) Duncan and Duncan-Chang (1970); and b) Dong et al. (2013). 132 Figure 5.8– Calibration of Duncan-Chang parameters based on the experimental oedometric
curves: a) very dense rockfill (Idi =81%), b) dense rockfill (Idi =69%), c)
compacted rockfill (Idi =51%), and d) loose rockfill (Idi =18%). 134
Figure 5.9–Variation of the Duncan-Chang hyperbolic parameters: a) dimensionless modulus number K, b) stress normalization exponent n; as a function of Vs1. 135
Figure 5.10– Comparison between a) experimental and in-situ measurements of Vs1 for 3O
rockfill; and b) the oedometric curve obtained from numerical model based on the proposed (Ei-Vs) relation and the field deformation measurements during
Romaine II dam construction for 3O rockfill. 136 Figure 6.1: General meshing of the 3D FLAC model showing points of application of input
harmonic waves 145
Figure 6.2– FLAC3D outputs (soil A, h=1m): a) stress-strain hysteresis loop, b) transfer
function and c) evaluation of shear modulus from the stress-strain hysteresis
loop 148
Figure 6.3– Results of resonant frequency values for different massless driving system models 149 Figure 6.4– Results of resonant frequency values for different I/I0 values 154
Figure 6.5– Hysteresis loops at different shear strain levels (soil A) 155 Figure 6.6– G/Gmax degradation curves: (a) soil A and (b) soil B 156
Figure 6.7– D- for different models: (a) soil A and (b) soil B 157 Figure 7.1: Schematic of the GDS Hardin type resonant column. 162 Figure 7.2: a) Rigid connection (aluminum rod); and b) RC results with the rigid connection. 165 Figure 7.3: a) Schematic illustration of the modified flexible connection; b) driving system
frequency with the flexible connection; and c) example of RC results for clay sample with the flexible connection. 166
xvii Figure 7.4: Comparison between shear wave velocity obtained from both RC and Bender
element tests. 169
Figure 7.5: Shear modulus reduction curves obtained from the RC with flexible connection for: a) Granular soils; b) Cohesive soils. 170 Figure 8.1: Particle size distribution curve of the Ottawa F-65 tested sample. 176 Figure 8.2 – Normalized shear wave velocity (Vs1) as a function of void ratio (e). 178
Figure 8.3 – Resonant column (RC) results: a) accelerometer output voltage as a function of system frequency for Id = 83.13%, b) shear modulus (G) as a function of shear
strain () for different Id. 181
Figure 8.4 – Triaxial simple shear (TxSS) test results; a) cyclic stress ratio (CSR) versus shear
strain () curve for Id 85%), b) six cycles pore water pressure ratio (Ru) as a
function of shear strain (), and c) shear modulus (G) as a function of shear strain () for different Id based on the SIG-4 model 184
Figure 8.5 – Direct simple shear (DSS) test results; cyclic stress ratio (CSR) versus shear strain () curves with different strain levels (Id = 84.06%). 186
Figure 8.6 – Direct simple shear (DSS) test results; a) pore water pressure ratio (Ru) as a
function of shear strain () for Id = 80%, b) variation of G with different Ru,
and c) G relation for different relative densities. 187 Figure 8.7 – a) Ru as a function of for Id 35%, b) Ru as a function of for Id 62%, c) Ru
as a function of for Id 85%, d) Ru jump during DSS test (Modified after
Prevost & Høeg 1976), and e) DSS test corrected Ru values as a function of .
188 Figure 8.8 – Shear modulus (G) as a function of shear strain () obtained from P-RAT, RC and
DSS, a) Id 35%, b) Id 62%, and c) Id 85%. 196
Figure 8.9 – Mathematical illustration of the torsional system output, and b) comparison between different methods to estimate the Ottawa F-65 sand degradation curve.
200 Figure 8.10 – Corrected Shear modulus (G) as a function of shear strain () from different
experimental methods, a) Id 35%, b) Id 62%, and c) Id 85%. 201
List of Tables
Table 2.1 – Parameters affecting shear modulus and damping Ratio (after Hardin & Drnevich
1972) 26
Table 2.2 – Summary of some experimental data for the influence of D50 and Cu on Go for
different types of granular soil according to different studies. (Modified after
Hussien & Karray 2013) 30
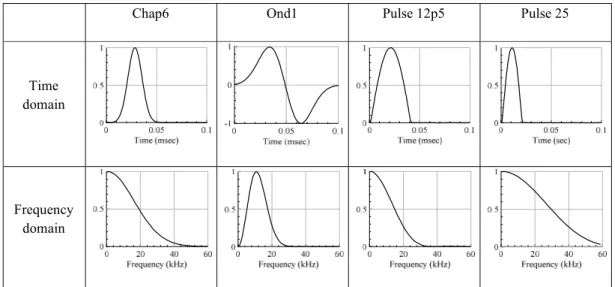
Table 3.1 – Input signals used in P-RAT tests, modified after Karray et al. (2015) 58 Table 3.2 – Physical characteristics of the used sand samples 70 Table 4.1 – Physical characteristics of the used granular samples 81 Table 4.2 – Input signals used in P-RAT tests, modified after Karray et al. (2015) 87 Table 4.3 – Fitting parameters and limitations of Eq. 4.10 105 Table 5.1 – Input signals used in P-RAT tests, modified after Karray et al. (2015) 123 Table 5.2 – Duncan-Chang parameters of the validation examples 133 Table 5.3 – Proposed Duncan-Chang parameters for the experimantel curves. 133 Table 6.1 – Elastic properties of soils used in this study and SIG-4 model parameters 144 Table 6.2 – Resonant frequencies for massless driving systems under torsional waves 146 Table 6.3 – Resonant frequencies for massless driving systems under torsional waves 150 Table 6.4 – Soil resonant frequencies for driving systems with different I/I0 values 152
Table 8.1 – Input signals used in P-RAT tests, modified after Karray et al. (2015) 177 Table 8.2 – Proposed SIG-4 parameters based on TxSS results. 185
CHAPTER 1
I
NTRODUCTION
1.1
General Background
A proper estimation of the strain-dependent characteristics (i.e., shear modulus, G and damping ratio, D) of soils constitutes a fundamental part in analyzing the dynamic response of grounds, seismic soil-structure interactions, and soil liquefaction potential (Kramer 1996; Ishihara 1996). The behavior of soils in the small-strain range ( < 10-3) is substantial in many
engineering designs, such as embankments and specific important structures (such as nuclear power plants). The infinitesimal-strain ( 10-6) shear modulus of soils constitutes a
fundamental input parameter in analysis of the dynamic ground response in active seismic areas (Kramer, 1996; Ishihara, 1996; Andrus and Stokoe, 2000; Youd et al., 2001). The initial shear modulus (Go) can be estimated from both in situ (e.g., Campanella et al., 1986; Hryciw, 1990;
Lefebvre and Karray, 1998) and laboratory techniques (e.g., Hardin and Richart, 1963; Rollins et al., 1998; Zhang et al., 2005; Karray et al., 2015). Additionally, Vs and Go are
straightforwardly related theoretically (Go = ρVs2, where is the density of the material).
The initial shear modulus started to be utilized in static and dynamic soil modeling in the early 1970s (e.g., Seed and Idris, 1970). Numerous researchers have also focused on using Go in
static geotechnical applications such as foundation engineering designs (e.g., Imai and Yoshimura, 1976; Eberhart-Phillips et al., 1989; Pyrak-Nolte et al., 1996). For practical engineering design, it is very opportune to correlate the “dynamic” small-strain modulus to the “static” large-strain stiffness modulus (e.g., oedometer constrained modulus, Moedo, tangent
modulus, Et). Therefore, researchers have become interested in investigating this issue (e.g.,
Salgado et al., 2000; Wichtmann and Triantafyllidis, 2006; Wichtmann et al., 2017).
Moreover, the shear modulus measurements over a wide strain ranges can be performed through specialized laboratory techniques such as direct simple shear (DSS)(Lanzo et al. 1997;
1998; Wang et al. 2003), cyclic triaxial (CTX)(Seed et al. 1986; Geremew and Yanful 2012; Ghayoomi et al. 2007) torsional shear ( )TS (Tatsuoka et al. 1982; Koseki et al. 2000) and triaxial simple shear (T SS (x ) Chekired et al. 2015; Karray and Chekired 2019) tests. It is worth mentioning that these various tests differ one each other depending on the boundary conditions applied to the soil sample (e.g. stress state, drainage, etc.) and interpretation criteria (Cavallaro et al. 2003). These differences could lead to a significant discrepancy between the Gobtained from various devices (e.g. Cavallaro et al. 2003; Szilvágyi et al. 2016; Bedr et al. 2019). Therefore, it is a troublesome task for geotechnical engineers to decide on the most appropriate method to estimate Gover wide strain range.
1.2
Objectives, Scopes and Statement of Originality
This research originally correlated the “dynamic” small-strain modulus to the “static” large-strain stiffness modulus for granular soils and rockfills and investigated the assessment of the strain-dependent shear modulus over different strain levels for clean sands. Different laboratory techniques are utilized in this study: Resonant column (RC), the piezoelectric ring-actuator technique (P-RAT), the triaxial simple shear (TxSS), and direct simple shear (DSS).
Furthermore, this research also discussed the accuracy of RC interpretations and results based on finite differences (FD) modeling using the three-dimensional computer code FLAC3D
(Itasca Consulting Group Inc.). The general objective of this study is:
Investigate the correlations between small and large-strain moduli, and assessment of strain-dependent shear modulus for granular soil.
The following points summarized the specific objectives and statement of originality:
1. Correlate Vs, Go, and Moedo to the physical parameters of natural granular soils using
two different methodologies of analysis under a given relative density (Id), and void
ratio (e) as well in order to precisely include the effect of more physical parameters such as mean grain sizes (D50), uniformity coefficients (Cu), and particle shapes.
1.3 Methodology 21 2. Establish a correlation between Duncan-Chang initial modulus Ei and Vs for rockfill
based on experimental tests and two-dimensional (2D) finite differences (FDM) numerical simulations, with in-situ measurements verification.
3. Examine the influence of the driving mass, the geometry of the specimen, the mode of vibrations, and the boundary conditions on RC test results based on three-dimensional (3D) finite-differences (FD) simulation.
4. Develop a (GLog) degradation curve with different strain levels for clean sands using different laboratory techniques (RC, P-RAT, TxSS, and DSS).
1.3
Methodology
To achieve the above-described objectives, an experimental program is performed on selected cohesionless soils collected from different sites inside Quebec, one soil from Tunisia and two commercial clean sands (Ottawa sand C-109 and Ottawa sand F-65). The shear wave velocities (Vs) of 22 different granular soils and 4 different Rockfill soils of various physical
characteristics are measured experimentally using P-RAT incorporated in the oedometer cell to correlate the “dynamic” small-strain modulus to the “static” large-strain stiffness modulus. Numerical simulations and in-situ measurements are utilized to verify the proposed correlation for Rockfill samples. Furthermore, the numerical simulations are used to examine the accuracy of RC interpretations and results and investigate the influence different factors on RC test results, the validation of the proposed numerical simulation model also included in this study. Finally, the RC, P-RAT, TxSS, and DSS results are employed to develop more precise method
to develop the (GLog) degradation curve with different strain levels for clean sand.
1.4
Thesis organization
Fig. 1.1 illustrates the thesis organization; first begins commonly with a literature review in Chapter 2 of presenting pertinent studies to this work.
Chapter 3 (Experimental Program) Presents the different apparatus used in this study (Resonant Column (RC), Piezo-electric Ring Actuator Technique (P-RAT), Triaxial Simple Shear (TxSS), and direct simple shear (DSS)). Detailed description of each apparatus is
discussed. Also, the characteristics of the used soils and the preparation methods are described. Chapter 4 (1st article) investigated experimentally the correlation between “dynamic”
small-strain modulus and “static” large-small-strain stiffness modulus based on the results of shear wave velocities (Vs) of 22 different granular soils with various physical characteristics using P-RAT
incorporated in the conventional oedometer cell.
Chapter 5 (2nd article) investigated experimentally and numerically the relation between the
Duncan-Chang initial modulus (Ei) and the shear wave velocity (Vs) for rockfill soils.
Chapter 6 (3rd article) presented a FLAC3D finite differences (FD) simulation RC apparatus to
examine the influence of the driving mass, the geometry of the specimen, the mode of vibrations, and the boundary conditions on RC test results.
Chapter 7 (4th article) investigated the effect of the driving system rigidity on a Hardin-type
RC device. A series of RC tests performed on two types of driving system mechanisms with different resonant frequencies of the apparatus to investigate the driving system rigidity effect. Chapter 8 (5th article) presents the estimation of strain-dependent shear modulus of Ottawa
F-65 sand with different strain levels using different laboratory techniques, to develop the (GLog) degradation curve with different strain levels.
The last Chapter of the thesis, Chapter 9, presents some detailed conclusions of the results obtained from the experiments and analyses with respect to observations and highlights discussed throughout the thesis in addition to recommendations for future work.
1.4 Thesis organization 23
CHAPTER 2
L
ITERATURE REVIEW
2.1
Introduction
Small- and large-strain soil parameters, which are generally referred to as short- and long-term soil parameters, respectively, are key factors in geotechnical designs. Researchers customarily afford significant attention to the assessment of the long-term behavior of soil through conventional triaxial, oedometer, and direct shear tests, while the short-term behavior, which is frequently determined by geophysical methods, may be given less attention. However, the behavior of soils in the small-strain range (< 10-3) is substantial in many engineering designs,
such as embankments and specific important structures (such as nuclear power plants). The infinitesimal-strain ( 10-6) shear modulus of soils constitutes a fundamental input parameter
in analysis of the dynamic ground response in active seismic areas (Kramer 1996; Ishihara 1996; Andrus and Stokoe 2000; Youd et al. 2001). The low-strain shear modulus (Go) can be
estimated from both in situ (e.g., Campanella et al. 1986; Hryciw 1990; Lefebvre and Karray 1998) and laboratory techniques (e.g., Hardin and Richart 1963; Rollins et al. 1998; Zhang et al. 2005; Karray et al. 2015). Additionally, Vs and Go are straightforwardly related theoretically
(Go = ρVs2, where is the density of the material). Therefore, Go started to be utilized in static
and dynamic soil modeling in the early 1970s (e.g., Seed and Idris 1970). Then, several studies demonstrated the importance of this parameter in seismic hazards (e.g., Riepl et al. 2000; Wang and Hao 2002; Thompson et al. 2010). Numerous researchers have also focused on using Go in
static geotechnical applications such as foundation engineering designs (e.g., Imai and Yoshimura 1976; Eberhart-Phillips et al. 1989; Pyrak-Nolte et al. 1996). In addition, Go can be
exploited further if it is correlated with other soil parameters at large deformations (Salgado et al. 2000; Wichtmann and Triantafyllidis 2006; Wichtmann et al. 2017). The large-deformation behavior of soils is usually represented by the elasticity modulus (E), defined as the ability of the material to resist excessive deformation during loading. In oedometer conditions, the static constrained modulus (Moedo) is widely utilized to represent the soil elasticity modulus. The rigid
2.2 Shear Modulus (G) 25 axial (vertical) compressive strain test. Although only axial stress is applied to the soil sample, radial stress is developed because of the laterally constrained conditions of the sidewalls. In practice, one-dimensional consolidation oedometer test results are acceptable in most cases of foundations, as well as in laboratory modeling of soil-foundation behavior (Lenk 2009).
2.2
Shear Modulus (G)
Soil dynamics primarily focus on small-strain shear modulus, Go, reduction of shear modulus
with strain amplitude, damping ratio, and variation of damping with strain amplitude. To well understand the nature of dynamic soil properties, the influence factors should be completely investigated. A comprehensive general stress-strain relation for soil was extremely complicated simply because of the large number of parameters that affect the behavior of soils (Hardin & Drnevich 1972). Dynamic soil properties are affected by various factors such as strain amplitude, confining pressure, void ratio, over-consolidation ratio, loading frequency, temperature, anisotropic stress, and so forth. (Hardin & Black 1986) proposed a function to describe factors influence shear modulus as follows:
G = F (o, e, H, S, o, C, A, f, T, , K) [2.1]
Where; G is shear modulus; σo is mean principal effective stress (or isotropic confining
pressure); e is void ratio; H is ambient stress history; S is degree of saturation; τo is deviatoric
component of ambient stress; C is grain characteristics such as grain shape, gradation and mineralogy, A is strain amplitude of vibration or loading, f is frequency of vibration or loading, T is secondary effects that are functions of time and magnitude of load increment, θ is soil structure, and K is temperature.
Eq. 2.1 does not necessarily imply independence between factors. For instance, effective confining stress and void ratio are often observed to affect each other. Hardin & Drnevich (1972) classified the importance of these factors on shear modulus and damping ratio into three groups: very important, less important, and relatively unimportant, as shown in Table 2.1.
Table 2.1 – Parameters affecting shear modulus and damping Ratio (after Hardin & Drnevich 1972)
a V means very important, b R means relatively unimportant except as it may affect another
parameter, c L means less important, and d U means relative importance is not clearly known
at that time.
The shear modulus keeps at a highest value as long as the shearing strain is less than one certain value because of the linearity of the curve in nature. The modulus is well known as the small-strain shear modulus or the maximum shear modulus, whose value is the slope of the linear part of the curve. With an increase in strain amplitude beyond a threshold level, this curve demonstrates an apparent nonlinearity in nature. And the shear modulus related to this strain is known as the secant shear modulus.
To understand the small-strain and nonlinear dynamic soil properties, the cyclic threshold strains should be exactly defined. On the basis of a synthesis of previous studies on various types of soils, Vucetic (1994) systematically discussed two types of cyclic threshold shearing strains. Fig. 2.1 shows the variation of normalized modulus and damping with an increase in shearing strain amplitude as well as the zones of cyclic shearing strain. As shown in Fig. 2.1,
2.2 Shear Modulus (G) 27 the cyclic threshold shear stain is classified as the linear threshold cyclic shearing strain, symbolized with γtl, and the volumetric cyclic shearing strain, symbolized with γtv.
Figure 2.1– Normalized modulus and damping curves with different zones of cyclic shearing strain amplitude for soil (slightly modified from Vucetic 1994)
For any soil cyclic shearing strain amplitude below volumetric cyclic threshold shearing strain amplitude, permanent microstructural change of soil essentially does not occur; residual cyclic pore-water pressure essentially does not develop if the soil is fully saturated and cyclically sheared in undrained conditions; and the permanent volume change is negligible if the soil is dry, partially saturated, or fully saturated in drained conditions. If the shearing strain amplitude exceeds this threshold value, the microstructure changes irreversibly; soil stiffness changes permanently; a permanent pore-water pressure builds up in fully saturated cyclically shear loading in drained conditions, and for dry soil, partially saturated soil, or fully saturated soils
2.2.1 Influence of void ratio and confining pressure
Void ratio (e) is a major factor influence small-strain shear modulus. Both experimental results and theoretical considerations have shown that Vs is primarily a function of e and effective
confining pressure (’m). Hardin and Richart (1963) evaluated the shear wave velocity of
granular soils and concluded that shear wave velocity decreased linearly with void ratio (from 0.37 to 1.40), independent of grain size, gradation, and relative density. Richart et al. (1970) compiled data and illustrated the influence of void ratio on the shear wave velocities (Vs) of
clean sands with void ratio ranged from 0.37 to 1.26 and reported similar conclusions.
The widely used empirical formula for estimation of Vs (e, ’m) is the one originally proposed
by Hardin (Hardin and Richart 1963; Hardin and Black 1966):
'
( )(
)
Bs m
V
AF e
[2.2] where F(e) is a void ratio function; A and B are material constants. Hardin and Black (1968), pointed out that the shear modulus of soils decreased with void ratio by using resonant column technique and proposed the following equations to express the effects of void ratio on Go;2 (2.17 ) ( ) (1 ) e F e e
for round-grained sands (e<0.80) [2.3]
2 (2.973 ) ( ) (1 ) e F e e
for Angular-grained sands and clayey soil [2.4]
The stress exponent, B, varies from 0.22 to 0.29; and a practical value of 0.25 was proposed by many researchers (Bui 2009). However, classical contact mechanics solutions using the Hertz– Mindlin contact theory predict B=0.16 (Santamarina et al. 2001).
2.2.2 Influence of grain size distribution
The effects of gradation in granular soil are often discussed in terms of mean grain size (D50),
and uniformity coefficient (Cu). Understanding the effects of particle size distribution on the
2.2 Shear Modulus (G) 29 1950s, many investigations have considered the characteristics of various particle size, but the impact of different particle size distribution on soil shear behaviour is still the subject of debate. The researchers differed in understanding of the effect of particle size distribution on soil shear behaviour; and there are two points of view:
1. The particle size distribution has an implicit effect on Go; both D50 and Cu, have an impact
on the void ratio and therefore Go of granular soils. Therefore, Go is size independent.
(Hardin & Richart 1963; Yang & Gu 2013) .
2. The grain size distribution has an impact on the void ratio, also there is an explicit effect for size distribution (D50 and/or Cu) on soil shear modulus Go. The effect of void ratio on Go
can be normalised, then the effects of particle size distribution can be observed and taken into account (Iwasaki and Tatsuoka 1977; Chang and Ko 1982; Ishihara 1996; Menq and Stokoe 2003; Hardin and Kalinski 2005; Wichtmann and Triantafyllidis 2009; Bui 2009; Hussien and Karray 2013)
Table 2.2 summarize some experimental data for the influence of D50 and Cu on Go for different
types of granular soil according to different studies.
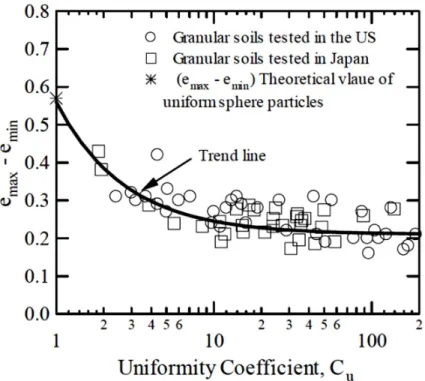
The void ratio e of any soil specimen is comprised between some minimum and maximum values. An attempt to discuss the effects of D50 and Cu on emax and emin was done by Menq
(2003) in his PhD dissertation. Menq (2003) collected data from the literature and plotted the relationship between (emax – emin) and Cu of granular soils tested in Japan during the nineties of
the last century as shown in Fig. 2.2. Void ratios of some other granular soils tested in the US and theoretical values of uniform sphere particles are also shown in Fig. 2.2. As shown in the figure, the values of (emax - emin) are almost constant and vary between 0.2 and 0.3 with an
average value of about 0.25 for Cu > 10. However, for Cu ≤ 10, the value of (emax - emin)
increases as Cu decreases. The trend line in Fig. 2.2 can be expressed as:
max min 1 ( ) 0.35( ) 0.21 u e e C [for 2Cu200] [2.5]
Table 2.2 – Summary of some experimental data for the influence of D50 and Cu on Go for
different types of granular soil according to different studies. (Modified after Hussien & Karray 2013)
Author(s) Type of soil Test Method Increasing
of D50
Increasing of Cu
Hardin & Richart (1963) Round-grain Ottawa sand and Angular-grain crushed quartz
RC - -
Iwasaki & Tatsuoka
(1977)
Several sands RC - decrease
Chang & Ko (1982) Medium loose Denver sand RC Increase Increase
Ishihara (1996) Various sands and gravels - Increase -
Menq & Stokoe (2003) Natural river sand RC Increase -
Hardin & Kalinski (2005) Various sands and gravels RC Increase decrease
Wichtmann & Triantafyllidis (2009)
Well-graded quartz sand and Poor-graded quartz sand
RC - decrease
Bui (2009) Glass beads RC Increase -
Yang & Gu (2013) Glass beads BE & RC - -
The relationship between (emax - emin) and D50 are shown in Fig. 2.3. The values of (emax - emin)
vary between 0.2 and 0.3, with an average of 0.25 for gravelly materials (D50 > 4.76mm) and
coarse sands (D50 > 2.0 mm). On the other hand, the values of (emax - emin) of medium and fine
2.2 Shear Modulus (G) 31
Figure 2.2– Variation of (emax - emin) with Cu of granular material tested in the US and Japan
(After Menq 2003)
Studying the influence of particle size distribution (D50 and Cu) on the degradation factor G/Go
will clarify the effect of this parameters on shear modulus at large strain. Wichtmann & Triantafyllidis (2009) tested approximately 350 resonant column (RC) tests on 33 specially mixed grain size distribution curves of a quartz sand with different mean grain sizes D50,
coefficients of uniformity Cu to study the effect of particle size on degradation factor G/Go,
Fig. 2.4 shows a comparison of the curves G/Go measured by Wichtmann & Triantafyllidis
(2009) for eight sands with different Cu values. Obviously, the modulus degradation with
increasing shear strain amplitude becomes larger with increasing coefficient of uniformity. This is also evident from Fig. 2.5 where the normalized shear modulus G/Go is plotted versus
Cu. For a certain shear strain amplitude G/Go decreases with increasing coefficient of
uniformity. The influence of the mean grain size on the curves G/Go is rather small.
Figure 2.4– Comparison of curves G /Go measured for eight sands with different coefficients
2.2 Shear Modulus (G) 33
Figure 2.5–G /Go for different shear strain amplitude as a function of Cu (after Wichtmann &
Triantafyllidis 2009)
2.2.3 Influence of particles shape
At small strains Santamarina & Cascante (1998) undertook tests using specimens prepared with steel balls having different degrees of surface roughness. Their RC test results indicated that Go reduced with the surface roughness. Clayton et al. (2004) observed a considerable reduction
in the undrained Young’s modulus (at strains ranging from 0.01% to 1%) for a coarse rotund granular material mixed with a small quantity of fine, platy particles, even though the void ratio of the mixture was lower than that of the coarse material alone.
Figure 2.6–Shear modulus as a function of shear strain for different particle shapes (modified
after Bui et al. 2007)
Results from laboratory tests at large strains suggest that the stiffness of soil at medium to large strains is greatly affected by particle shape. Bui et al. (2007) investigated the relationship between particle shape and shear modulus, performed resonant column tests on dry specimens using granular material having different particle shapes. As shown in Fig.2.6, Bui et al. (2007) concluded that as surface roughness and angularity increased, soil behaved more elastically (elastic threshold strain increased, shear modulus degradation curve shifted to the right).
2.3 Laboratory Techniques Used in Shear Modulus Measurements 35
2.3
Laboratory Techniques Used in Shear Modulus
Measurements
By definition of Atkinson & Salfors (1991) termed strains smaller than the limit of classical laboratory testing (γ < 10−3), small strains. Strains, γ > 1 × 10⁻³ are termed large or larger
strains. The limit of classical laboratory testing coincides at the same time with characteristic shear strains that can be measured near geotechnical Fig. 2.7.
Figure 2.7– Characteristic stiffness-strain behavior of soil with typical strain ranges for laboratory tests and structures (after Atkinson & Salfors 1991; Mair 1993)
Go can be estimated from laboratory (e.g., Hardin and Richart, 1963; Rollins et al., 1998; Zhang
et al., 2005; Karray et al., 2015) measurements of shear wave velocities (Vs), as the soil elastic
stiffness is straightforwardly related to its shear wave propagation velocity ( 2
max s
G V , with
being the density of the soil). However, the shear modulus measurements over a broad range of shear strains can be performed through specialized laboratory testing apparatus such as direct simple shear (DSS) (Bjerrum and Landva 1966; Dyvik et al. 1987; Boulanger et al. 1993) resonant column (RC) (Avramidis and Saxena 1990; Cascante et al. 1998; Wang et al. 2003), cyclic triaxial (CTX) ( Geremew and Yanful 2012; Ghayoomi et al. 2007) torsional shear (TS) (Tatsuoka et al. 1982; Koseki et al. 2000) and triaxial simple shear (TxSS) (Chekired et al. 2015;
2.4
Resonant Column test
2.4.1 RC apparatus
The method of resonant column (RC) test was developed in the 1930s by the Japanese engineer K.Iida. It became popular worldwide since the 1950s. The RC procedure, in particular, constitutes the most popular apparatus in evaluating the dynamic soil behaviour (Hall and Richart 1963; Schaeffer et al. 2013). The test is primarily based on wave propagation theories, and the specimen’s modulus and its damping ratio are, respectively determined at different strain levels from its resonant frequency in torsional vibrational mode, and the half-power bandwidth (in forced-vibration mode) or logarithmic decaying (in free-vibration mode) methods. Unlike the DSS and TS tests that are generally performed at quasi-static frequencies (i.e., < 5 Hz), excluding the influence of the inertia of the driving apparatus and the specimen itself, the RC test is performed, by necessity, at the specimen’s frequency, thus the RC output would be more sensitive to inertial effects of the attached apparatus. The resonant column apparatus has been successfully used to determine shear stiffness and damping at very small and small strains (e.g., Hardin and Music 1963; Hardin and Drnevich 1972; Drnevich et al. 1978; Saxena et al. 1988; Jamiolkowski et al. 1994; Tanaka and Shibuya 1996; Presti et al. 1997; Stokoe et al. 1999), although it has been recognized that, as with all geotechnical testing, inaccurate results can be obtained for a wide variety of reasons (Drnevich 1978; Ashmawy and Drnevich 1994).
The RC device is shown schematically in Fig. 2.8. In the resonant column test, a cylindrical soil specimen, usually enclosed with a thin membrane, is subjected to an imposed static axial and lateral stress condition. Torsional sinusoidal vibrations are applied at the top of the soil specimen and the rotational response is measured. The frequency of excitation is varied until the system resonant frequency is achieved. Given the geometry, mass and system parameters, the equivalent elastic shear modulus and damping capacity can be determined at a measured level of excitation vibration. The amplitude of vibration (which is related to shear strain) is typically varied to measure the variation of modulus and damping as a function of shear strain. The test is usually conducted at levels of shear strain between 0.00001 % and 0.2 %. (The upper limit of shear strain is dependent on the specimen stiffness and the maximum torque capability
2.4 Resonant Column test 37 of the excitation system). For specimens where the maximum shear strain measured is of the order of 0.01 %, the test is often conducted at several different sets of static axial and lateral stress conditions to measure the variation of moduli and damping with static stress states (
ASTM D4015 - 15e1).
Regarding boundary conditions in a RC, there are three types of equipment configurations. Fixed-free, fixed-spring top, and free-free (Drnevich 1985; Ashmawy & Drnevich 1994).
Wilson and Dietrich (1960) developed a fixed-free resonant column to measure both longitudinal and torsional vibrations. Hardin and Richart (1963) described two devices with free-free end conditions to measure torsional and longitudinal vibrations. Hardin and Music
(1965) developed a resonant column device which allowed the application of deviatoric axial loads. All these devices were designed to operate at small strains (in the range of 10-5). In 1967,
Drnevich developed a free-fixed resonant column which allowed for strains greater than 10-4.
Later, devices that combine resonant column and torsional shear were designed to measure dynamic properties of soils for shear strains between 10-6 and 10-1 (Drnevich, 1978; Drnevich
et al., 1978; Isenhower, 1980).
2.4.2 RC interpretation methods
Many interpretive methods have been, therefore, used with different theoretical bases to probably evaluate the strain-dependent dynamic characteristics of soil specimens tested in the RC apparatus. These methods of interpretation generally produce different results with respect to both the soil modulus and its damping ratio and it is very troublesome task for geotechnical engineers and practitioners to decide on the most appropriate method to follow for the back-analysis calculations with recourse to coupled soil-apparatus system.
The interpretation of RC test is generally based on the method of wave propagation in a cylindrical elastic rod; where the shear wave propagating in a soil specimen is assumed similar to that in a cylindrical elastic rod (Timoshenko et al. 1974; Richart et al. 1970), single degree of freedom (SDOF) torsional vibration method; as the shear strain increases beyond the linear elastic region, the shear modulus decreases, and the damping ratio increases and can become significant, then the model for wave propagation in an elastic rod may not applicable, especially in the medium to large strain regions (Timoshenko et al. 1974), and method of wave propagation in a cylindrical viscoelastic rod (Hardin 1965). Since the analyses of resonant column tests are based on the assumption that the behaviour of the soil is linear and elastic, analyses of the test data are strictly valid only in the region of very small strain (Isenhower 1979).
The shear modulus can be then determined at a given excitation/strain level (typical range of shear strain is between 10−5% and 0.5 %) based on the geometry, mass, and system parameters.
In other words, it has been shown (Richart et al.1970) that the relationship between the soil’s natural frequency and its shear wave velocity Vs and consequently its shear modulus, Go (
2
o s
G V , with being the density of the soil) can be obtained by:
tan 0 I I [2.6] s n V h [2.7]
2.4 Resonant Column test 39 where I and I0 are the specimen and the driving system polar moments of inertia, n is the
system natural frequency and h is the specimen height.
For the damping (D) at a given shear strain includes both the material damping and the system generated damping. D can be measured in a RC using either the free vibration decay (FVD) or the half-power-point bandwidth (HPP) method. Free vibration decay method without an excitation force, the vibration amplitude decays with time. In a RC test, a specimen is vibrated at its resonant frequency, and then the excitation source is cut off as shown in Fig. 2.9, and D is determined by observing the decay pattern. Based on an analysis of the recorded vibration decay curve, D can be calculated as
2 2 4 D [2.8] where 1 ln( n ) n [2.9] where n and n+1 are the amplitudes of two successive cycles during free-vibration.
Half-power-point bandwidth method an alternative method of determining D is to measure the half-power frequencies (f1 and f2) of two points, where the amplitude is equal to 1/ times the
peak amplitude (point A and B in the response curve illustrated in Fig. 2.10). The points are usually referred to as half-power points (HPP), and the bandwidth between these points is termed the half-power bandwidth, a term borrowed from the analysis of electrical systems:
2 1 r f f D f [2.10]
Figure 2.10– Half-power-point bandwidth method
2.4.1 RC limitations and sources of error
The RC apparatus has great limitations and various sources of error related to interpretation method, equipment and specimen compliance, and non-uniform stress/strain distribution (Drenvich 1978; Isenhower 1979; Scholey et al. 1995; Ishihara 1996;Sasanakul and Bay 2008; Bui 2009; Lashin et al. 2018).
The elasticity theory was utilized in RC analysis originally because the test was developed to measure the soil behavior at low strains. However, soils can behave nonlinearly when subjected to strain levels as low as 10−5% (Jardine 1992). Jardine (1992), described the soil stress-strain
behaviour of soil under monotonic loading in normalized stress- space, and divided the behaviour into three zones: I) linear elastic zone; corresponds to the region where behaviour is perfectly linear elastic, II) recoverable zone; where the stress-strain behaviour is non-linear but
2.4 Resonant Column test 41 complete load-unload cycles show fully recoverable be-haviour., and III) plastic zone (irrecoverable strains). However, it is difficult to prove that the apparently constant value of Go
applies when < 10-4 %, and the zone of truly elastic behaviour is also very small (Jardine
1992). Contact mechanics theories suggest that, because of micro-yielding at the edges of the particle contacts, the behaviour of norm sub ally consolidated, unbonded, particles subjected to both shear and normal forces should be gently non-linear from even such negligibly small strains (Bowden and Tabor 1964; Johnson 1985). Kuwano and Jardine (2002) concluded that the granular materials show linear behaviour over only a very small strain range. Non-linearity and plastic straining have a strong influence on the ground movement developed in most practical geotechnical engineering problems.
Bui (2009) adopted the finite element (FE) approach to investigate the errors related to equipment as well as specimen compliance, Fig. 2.11. His results indicated that when testing relatively stiff specimens in the Stokoe RC apparatus, significant errors in the measurement of the sample’s resonant frequency had been arisen due to the compliance of many parts of the system such as drive mechanism deformability, poor base fixity, and design of the calibration bars.
Figure 2.11– RC finite element simulation to investigate the errors related to equipment as well as specimen compliance (after Bui 2009)
Perino and Barla (2014) used the distinct element method (DEM) to assess the correction procedure required for the interpretation of the RC test results when specimens of stiff
geomaterials are used Fig. 2.12. They found that the shear modulus and the shear wave velocity of soft rocks can be properly determined using RC after applying a correction procedure. Their study showed also that the correction factor increases with the measured resonant frequency of
the soil specimen.
Figure 2.12– RC DEM model (after Perino and Barla 2014)
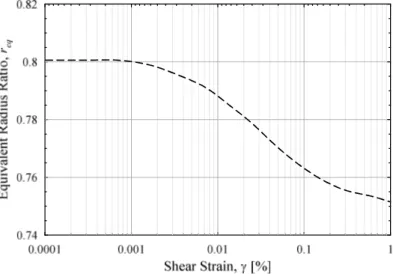
One of the weaknesses of the RC method is the fact that stress–strain distribution is not uniform in the radial direction of the horizontal plane of a soil specimen during torsional loading. The RC test has a problem with non-uniform strain distribution because the shear stresses increase from zero at the axis of rotation to a maximum value at the outside radius. To account for this non-uniform stress-strain problem, Chen and Stokoe (1979) developed an approach called the equivalent radius approach to account for the non-uniform distribution of strain in the soil specimen. This approach assumes that the representative stress and strain in soil specimen in torsion occur at a radius called the equivalent radius (req), which is a ratio of specimen radius
(r).
m ax
% re q %
[2.11]
where max is the max strain at the specimen perimeter; req= 0.8 r (ASTM D 4015), and based
2.5 Experimental assessment of soil degradation curve 43 However, the equivalent radius approach has limitations (Sasanakul and Bay 2008): 1) using a single value of req over a wide strain range leads to inaccuracies in both stress and strain for
RC testing; 2) this approach is limited to <0.1%; 3) req approach ignores the fact that different
soils begin to exhibit nonlinear behaviour at different strain levels and req should be decreased
at strains where the soil begins to behave nonlinearly. Sasanakul and Bay (2008) used the stress integration approach to provide an accurate analysis technique for evaluating the req over any
range of strains in RC testing as shown in Fig. 2.13, they proposed req relation considering
the soil nonlinearity and found that req should be decreased with the increase of strain level.
Figure 2.13– Proposed req relation based on stress integration approach (modified after
Sasanakul and Bay 2008)
2.5
Experimental assessment of soil degradation curve
The ratio of G (at a certain shear strain level) to Go is termed shear modulus degradation or
stiffness degradation; and a curve expressing the ratio G/Go against shear strain is termed shear
modulus degradation curve. Most of the researchers are employing more than one laboratory technique to estimate the G under very small and small strains; as each apparatus is applicable for a limited rang; torsional shear (TS), RC, and cyclic triaxial (CTX) are commonly used in
strains (e.g., Alarcon-Guzman et al. 1989; Vucetic and Dobry 1991; Darendeli 2001; Zhang et al. 2005; Vardanega and Bolton 2013). Fig. 2.14 illustrates the strain levels achieved in most common in-situ and laboratory techniques.
Figure 2.14– Shear strains mobilized in in-situ and common laboratory techniques (after
Ishihara 1996)
It is worth to mention that, these various tests differ one each other depending on the boundary conditions applied to the specimen (e.g. stress state, drainage, strain rate, etc.) and interpretation criteria (Cavallaro et al. 2003), and it should be pointed out that a lack of agreement between the G obtained from different techniques was observed (e.g. Cavallaro et al. 2003; Szilvágyi et al. 2016; Bedr et al. 2018), and it is a very troublesome task for geotechnical engineers and practitioners to decide on the most appropriate method to estimate the soils shear modulus over wide strain range.
Cavallaro et al. (2003); utilized different laboratory tests (dynamic resonant column tests, static cyclic torsional shear and simple shear test) on undisturbed specimens of lightly over consolidated clay. Test results are compared in terms of stiffness and damping properties over a wide strain range, from 0.0003% to almost 1%, as shown in Fig. 2.15. They observed different curves for each type of test, the comparison between RC and CTS tests, at the same isotropic consolidation stress, shows that shear moduli determined by the RC test are different from those