Cape Town, South Africa
June 9-11, 2008
Are Remittances More Effective than Aid to
Improve Child Health? An Empirical Assessment
Using Inter and Intra-country Data
Lisa Chauvet
Flore Gubert
Sandrine Mesplé-Somps
Institut de Recherche pour le Developpement and DIAL
Are Remittances More Effective Than Aid To Improve Child Health?
An Empirical Assessment using Inter and Intra-Country Data
Lisa Chauvet, Flore Gubert and Sandrine Mesplé-Somps1
Paper prepared for the ABCDE Conference held in Cape Town, South Africa
May 16, 2008
Abstract
The objective of the paper is to analyze the respective impact of aid and remittances on human development as measured by infant and child mortality rates and stunting incidence. Panel data on a sample of 98 developing countries, and cross-country quintile-level data on a sample of 47 developing countries are alternatively used. In addition to assessing the extent to which health aid and remittances contribute to reduce child health disparities between countries, the paper addresses two other questions. What is the net effect of migration when the brain drain of health workers is accounted for? What is the effective impact of aid and remittances on intra-country child health disparities? Our results suggest that both remittances and health aid significantly improve child health outcomes. The impact of health aid is non-linear, though, suggesting that aid to the health sector is more effective in the poorest countries. By contrast, medical brain drain, as measured by the expatriation rate of physicians, is found to have a harmful impact on health outcomes. The net impact of migration on human development is therefore mitigated. Medical brain drain is also found to reduce the effectiveness of health aid. Last, remittances seem to be much more effective in improving health outcomes for children belonging to the richest households, whereas neither pro-poor nor anti-poor effect is found for health aid.
Keywords: Child Health, Remittances, International Migration, Foreign Aid. JEL Codes: F24, F22, F35, I10, O15.
Introduction
Poverty reduction is increasingly put forward as the main objective of official development assistance (ODA) to developing countries. Both national leaders and the international community have indeed pledged to meet, by 2015, a series of poverty reduction targets known as the Millennium Development Goals (MDGs).2 The pursuit of these MDGs, however, calls for a dramatic increase both in infrastructure finance and in the provision of basic services to
1
Institute of Research for Development (IRD), DIAL, Paris.
2
The eight Millennium Development Goals are: 1) to halve extreme income poverty; 2) to achieve universal primary education; 3) to promote gender equality; 4) to reduce by two-thirds the under-five mortality rate; 5) to reduce by three-quarters the maternal mortality rate; 6) to reduce the incidence of AIDS; 7) to promote sustainable development and to halve the percentage of people without access to safe drinking water; 8) to set up a global partnership for development involving more generous, more widespread official development assistance.
the population of the developing world that official development assistance alone cannot accomplish. The Monterrey Consensus following the 2002 United Nations International Conference on Financing for Development has thus highlighted the need to find new sources of financing and the idea that more private funds should be invested in developing countries has received strong support since then.
Given this context and their ever-increasing volume, international migrant remittances have attracted a lot of attention in recent years. According to the latest World Bank estimates (see Ratha and others, 2007), recorded remittances to developing countries reached $240 billion in 2007. Their actual size is even larger when transfers going through informal channels are taken into account. In 36 out of 153 developing countries, remittances are larger than all capital flows, public and private, and voices have already been raised here and there to call for a progressive substitution of official aid by remittances.
Little is known, however, about the respective effectiveness of aid and remittances in alleviating poverty. Despite a burgeoning literature examining the impact of ODA on aggregate welfare, there exists to our knowledge almost no study analyzing to what extent aid and remittances may substitute in terms of external flows, and how they are related to inequality and poverty reduction. Exceptions include Chauvet and Mesplé-Somps (2007) who analyze the distributive impact of trade flows, foreign direct investment (FDI), official aid and migrants’ remittances using Branco Milanovic’s World Income Distribution database. They find that FDI increases intra-country disparities, while remittances tend to decrease them. They also find that trade and aid have a non-linear relationship with income distribution.
The objective of this paper is to fill this knowledge gap by analyzing the respective impact of aid and remittances on human development as measured by infant or child mortality rates. To what extent do aid and remittances contribute to reduce child health disparities between countries? What about their respective impact on child health disparities within countries? How do remittances compare to aid when migration costs, namely brain drain, are accounted for? Here is the list of questions this paper seeks to answer.
We choose basic indicators of human welfare instead of a monetary measure of poverty for three reasons. First, comparable cross-country data on monetary poverty over time are extremely scarce. Second, child health figures prominently in the list of MDGs. Donors have indeed committed themselves to reduce by two thirds the mortality rate among children under five (Goal 4). To this end, they have devoted an increasing share of official aid to the health sector. There is however very few empirical evidence on the effectiveness of increased aid flows on health outcomes in recipient countries. Whether donors are right to prioritize the health sector in the intra-country allocation of aid is thus an unanswered question that needs to be addressed. Third, the relationship between migration and health is increasingly emphasized in the microeconomic literature and donor agencies regularly report the success of most of their projects and programs in the health sector. It is therefore interesting to investigate whether successful health interventions from the donors’ or the migrants’ side at the micro-level translate into improved health outcomes at the macro-level and whether Paul Mosley’s micro-macro paradox also applies to the health sector.
Our empirical strategy relies on two econometric exercises. We first examine the respective impact of aid, remittances and medical brain drain on child health indicators using panel data on a sample of 98 developing countries. This first econometric exercise allows us to assess whether aid and/or remittances contribute to improve health outcomes, and whether the brain
drain of health workers mitigates the positive impact of remittances. We then assess the respective effectiveness of aid and remittances in reducing health disparities within countries using cross-country quintile-level data. We follow Mishra and Newhouse (2007) and use aid granted to the health sector instead of aggregate aid in our empirical analyses. Our implicit assumption is that not all types of aid can reasonably be expected to affect health outcomes and that narrowing the aid variable should help us to better measure, if any, the impact of official development assistance on basic indicators of human development.
Results of our first econometric exercise show that both remittances and health aid significantly reduce infant and child mortality rates. The impact of health aid is non-linear, though, suggesting that aid to the health sector is more effective in the poorest countries. By contrast, medical brain drain, as measured by the expatriation rate of physicians, is found to have a harmful impact on health outcomes. The net impact of migration on human development is therefore mitigated. Results of our second econometric exercise using cross-country quintile-level data show that remittances are effective to reduce infant and child mortality rates, but only for the richest quintiles. This result suggests that while remittances contribute to improve mean health outcomes in recipient countries, they tend to increase intra-country health inequality. The impact of health aid, by contrast, is hardly ever significant in our within-country regressions.
The remainder of the paper is organized as follows. Section II reviews the macro-literature on the poverty and inequality impact of aid and remittances. The data, method of estimation and results of the cross-country and intra-country analyses are presented in Section III and IV respectively. Section V offers concluding remarks and discusses the policy implications of our findings.
The Impact of Aid and Remittances on Poverty and Inequality: A Literature Review
Poverty and Inequality Impact of Aid
From the early 1960s to the mid 1990s, the literature investigating the macro-impact of aid exclusively focused on the link between aid and growth. The emerging picture from this literature is that aid can enhance growth, but that this result is very fragile and highly dependent on the choice of data, sample composition and estimation methods (Roodman, 2007). The adoption of the United Nations Millennium Declaration by UN members in 2000 and the obligation taken up by donors to financially support developing countries’ efforts to achieve the eight Millennium Development Goals by 2015 have progressively shifted the focus from the aid-growth nexus to the relationship between aid flows and welfare or poverty indicators.
The few existing studies belonging to this strand of the literature have adopted quite standard cross-country growth regression approaches, and replaced growth with an indicator of welfare or poverty as the dependent variable (see, e.g., Boone, 1996; Mosley, Hudson and Verschoor, 2004; Gomanee and others, 2005; Gomanee, Girma and Morrissey, 2005). Since comparable cross-country data on poverty over time are extremely scarce, most studies have concentrated on the effectiveness of aid in improving human development indicators such as infant or under-five mortality rate, life expectancy or primary schooling. In a famous paper, Boone (1996) finds no evidence that aid succeeds in improving human development indicators in recipient countries. While aid could reduce infant mortality either through an increase in
private consumption or through greater provision of public services to the poor, his results suggest that aid increases the size of recipient governments, but that it has no impact on basic measures of human indicators. Boone pushes his analysis further and investigates whether his result varies between alternative political regimes. He finds some evidence that liberal political regimes all else equal have lower infant mortality rates, which may reflect a willingness of liberal regimes to deliver more public services to the poor. Boone’s paper has been much criticized on two grounds. First, some authors have argued that the welfare impact of aid is not direct but goes through its impact on the amount of government spending allocated to social areas. Boone’s regressions would thus be inappropriately specified. Mosley, Hudson and Verschoor (2004) estimate a system of three equations with poverty, aid and pro-poor expenditure as their dependent variables. They find that aid is associated with higher levels of pro-poor spending, and that such spending is associated with lower levels of headcount poverty. Aid is also found to increase health spending which in turn decreases infant mortality. Gomanee, Girma and Morrissey (2005) reach the same type of conclusion using quantile regressions. In a companion paper, however, Gomanee and others (2005) find evidence that aid improves welfare indicators and this effect is predominantly through direct impacts. Other authors opposed to Boone’s conclusions have argued that while it may be true that aggregate aid has not impact on health, particular types of aid among which health aid are effective in improving human development indicators (see, e.g., Masud and Yontcheva, 2005; Dreher, Nunnenkamp and Thiele, 2006; Michaelowa and Weber, 2007; Mishra and Newhouse, 2007). Mishra and Newhouse (2007) in particular rely on a large dataset covering 118 countries between 1973 to 2004 to measure the effect of health aid on infant mortality. They estimate both OLS regressions and a system of moment equations using GMM and find that increased health aid is associated with a statistically significant reduction in infant mortality. The estimated effect of health aid is small, however, since doubling health aid within a country would reduce infant mortality in the next five-year period by only 2%. As an additional result, they do not find any significant impact of overall aid. Masud and Yontcheva (2005) use data on nongovernmental (NGO) and bilateral aid and assess the effectiveness of these financial flows on two social indicators, namely infant mortality and adult illiteracy. Their underlying assumption is that NGOs intervene at the grassroots level and could be more effective to alleviate poverty than other types of aid. Using an unbalanced panel of 58 countries from 1990 to 2001, they find that health expenditure per capita reduces infant mortality as does greater NGO aid per capita. By contrast they do not find any significant impact of total bilateral aid on infant mortality. The authors then list a number of reasons why NGO aid would work better than bilateral aid in reducing infant mortality. First, NGO aid would be allocated more toward countries with high infant mortality rate while bilateral aid would favor countries with lower infant mortality. Second, NGOs would have more direct links to the poor and vulnerable, which would make them more efficient; third, in line with Boone (1996), aid transiting through recipient governments could be diverted for the benefit of wealthy elites. Pushing their analysis further, the authors do not find any evidence of a positive impact of NGO and bilateral aid on the share of spending on health care in total expenditure.
Overall, as for the literature examining the aid impact on growth, the few existing papers examining the links between aid and aggregate welfare as measured by human development indicators do not allow to draw clear conclusions. Some papers find no impact at all while some other papers find evidence that aid decreases infant mortality rates, either directly or indirectly through higher levels of pro-poor spending. This lack of consensus in the macro literature is surprising given the number of successful health interventions financially supported by international assistance (Levine and the What Works Working Group, 2004).
Poverty and Inequality Impact of Remittances
Despite the increasing size of remittances, empirical macro-evidence on the poverty or inequality impact of these financial flows is even scarcer than that related to aid. Here again, this lack of evidence stems mainly from the absence of reliable and comparable cross-country data on several of the relevant variables (e.g. emigration rate by country, amounts remitted) and the absence of long-series that are required if use is to be made of the latest macroeconometric tools. Consequently, most of the empirical literature is confined largely to a few case-studies on villages or countries based on microeconometric data (see, e.g., Lachaud, 1999; Leliveld, 1997; Adams, 2004, 2006).
At the cross-national level, there are, to our knowledge, only four recent studies that have looked at the poverty impact of remittances (Adams and Page, 2005; World Economic Outlook, 2005; Gupta, Patillo and Wagh, 2007; Acosta and others, 2008). In addition, despite strong micro-evidence on a positive impact of remittances on education and health (see, e.g., Kanaiaupuni and Donato, 1999; Cox-Edwards and Ureta, 2003; Hildebrandt and McKenzie, 2005 and Mansuri, 2007), no one has ever investigated the impact of remittances on human development indicators at a macroeconomic level. Adams and Page use a panel of 71 low-income and middle-low-income countries for which data on migration, remittances, poverty and inequality are available and test whether countries producing more international migration or receiving more international remittances have less poverty. After instrumenting for the potential endogeneity of remittances, they find that a 10% increase in per capita official remittances leads to a 3.5% decline in the share of people living in poverty. Using a broader sample of 101 countries, World Economic Outlook (2005) provides further evidence that remittances have an effect on poverty, even though this effect is rather small: on average, a 2.5 percentage point increase in the remittances to GDP ratio is associated with less than a 0.5 percentage point decrease in poverty. As argued by the authors, this (disappointing) result could be due to the fact that average income and inequality are included as regressors next to remittances. Since these variables are themselves likely to be influenced by remittances, the true impact of remittances on poverty could actually be larger. Using a sample of 76 countries in which Sub-Saharan countries are substantially represented, Gupta, Patillo and Wagh (2007) adopt the same methodology as that of Adams and Page (2005) and model poverty as a function of mean income, some measures of income distribution and remittances. Their findings indicate that a 10% rise in remittances is associated with about a 1% fall in the incidence of poverty. In the case of Sub-Saharan Africa, however, their results suggest that the impact of poverty on migration and remittances is greater than the impact of remittances and poverty. Last, Acosta and others (2008) use both cross-country and household survey data to assess the impact of remittances on growth, poverty and inequality in Latin America. Their cross-country estimates suggest that remittances have a positive and statistically significant effect on growth on average, but that they tend to increase the level of income inequality. The effect for the average Latin American country is different, however, since an increase in remittances tends to be associated with lower levels of inequality. Turning to their micro-econometric analyses, their findings suggest that the poverty and inequality impact of remittances strongly varies across Latin American countries, depending on whether recipients are concentrated at the bottom or at the top of the distribution of non-remittances income.
In what follows, our aim is to provide additional insights into the question of whether aid and remittances as sources of external financing are effective in improving child health outcomes.
The Impact of Aid and Remittances on Health Outcomes: a Cross-Country Analysis
The aim of this section is to assess the impact of health aid and remittances on child health outcomes, using panel data on a sample of 98 countries from 1987 to 2004. After a brief presentation of the empirical strategy and description of the data, results of our baseline model are discussed. The analysis is then pushed further by testing for non-linearities in the aid-health relationship, and investigating the impact of the medical brain drain on health outcomes.
Model and Data
To explore the relative impacts of aid and migration on child health indicators, we estimate a model of the following form:
, ,( 1, 4) ,( 1, 4) ,( 1, 4) ,
LnHealthi t =α βi+ LnXi t− −t +δLnRemittancesi t− −t +θLnHealth aidi t− −t +εi t (1) Healthi,t is either the under-five or the infant mortality rate from the World Development Indicators (WDI, 2006). Under-five mortality rate is the probability (per 1000) that a newborn baby will die before reaching the age of five, if subject to current age-specific mortality rates. Infant mortality rate is the number of infants dying before reaching one year of age, per 1000 live births in a given year.
Since our dependent variables are bounded, we use a logarithmic transformation. To ease interpretation of our results and account for potential non-linearities, all our independent variables are also log-linearized.
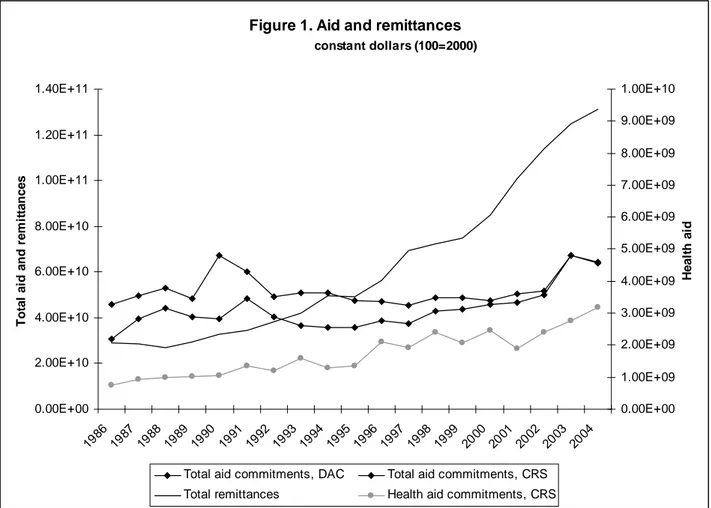
We measure Health aidi,t using aid commitments to the health sector as defined by the Country Reporting System (CRS) of the OECD.3 The main advantage of the CRS is to provide data on aid commitments with a high degree of disaggregation by purpose (sector). Its main disadvantage, though, is that the data are only reliable for recent years, as reflected in Figure 1 by the large underreporting of aid in the CRS data compared to those of the Development Assistance Committee (DAC). As noted by Mishra and Newhouse (2007), the extent of underreporting varies by sector, donor and time period and therefore missing data are omitted from the sample rather than considered as zero health aid. We also restrict our sample to relatively recent observations, starting in the mid-eighties.4 Figure 1 also shows that the share of aid commitments to the health sector has gradually increased since the eighties: at that time health aid was around 2% of total commitments, while it is now around 5%. This increase in health aid reflects the switch in donors’ priorities – notably from aid to infrastructures to aid to social sectors – which goes along with the adoption of the Millennium Development Goals.
The CRS also provides a disaggregation of disbursements by sector. Unfortunately disbursements are even more underreported than commitments. As an alternative variable for Health aidi,t, we proxy aid disbursements in the health sector by weighting total net disbursements with the share of health commitments in total commitments. Health aidi,t is expressed in per capita constant terms (using DAC deflator).
3
CRS data is available at:
http://www.oecd.org/document/0/0,2340,en_2649_34447_37679488_1_1_1_1,00.html.
4
Unlike us, Mishra and Newhouse (2007) include in their sample data on health commitments covering the sixties and seventies.
Remittancesi,t are defined as current transfers by migrants who are employed for more than a year in another country in which they are considered residents (WDI, 2006). We use the same deflator for remittances as for aid in order to transform this variable into per capita constant terms. As shown by Figure 1, worker’s remittances have been increasing both in absolute and in relative terms since the mid-eighties: while they only accounted for around 60% of total aid commitments in the eighties, they have represented more than 200% of aid commitments since 2000, reflecting the growing importance of this financing for developing economies.
Figure 1. Aid and remittances constant dollars (100=2000) 0.00E+00 2.00E+10 4.00E+10 6.00E+10 8.00E+10 1.00E+11 1.20E+11 1.40E+11 1986 1987 1988 1989 1990 1991 1992 1993 1994 1995 1996 1997 1998 1999 2000 2001 2002 2003 2004 T o ta l ai d an d r e m it tan ces 0.00E+00 1.00E+09 2.00E+09 3.00E+09 4.00E+09 5.00E+09 6.00E+09 7.00E+09 8.00E+09 9.00E+09 1.00E+10 H eal th a id
Total aid commitments, DAC Total aid commitments, CRS
Total remittances Health aid commitments, CRS
Source of the data: OECD-DAC, OECD-CRS, WDI (2006).
Following the existing literature on cross-country determinants of child health outcomes, equation (1) controls for a set of relevant socioeconomic variables, Xi,t. Since Ravallion (1993), and Pritchett and Summers (1996), a consensus has emerged concerning the negative relationship between child mortality and national income. Female education – measured either by educational attainment or illiteracy rates – has also been shown to be negatively correlated with child mortality (Filmer and Pritchett, 1999; Anand and Bärnighausen, 2004; Fay and others, 2005; McGuire, 2006; Ravallion, 2007). We measure income per capita in PPP constant terms (WDI, 2006) and female education using the average years of schooling of the female population aged 15 and over (Barro and Lee, 2000).
Anand and Bärnighausen (2004) show that the density of human resources in the health sector is significantly correlated with child health indicators. We proxy human resources for health
with the number of physicians (per 1000) provided by Bhargava and Docquier (2007). Finally, following Mishra and Newhouse (2007), Xi,t also includes the fertility rate (WDI, 2006).
Other cross-country determinants of child health have been identified in the literature, such as the size of the population (Mishra and Newhouse, 2007), the share of urban population (Masud and Yontcheva, 2005; Fay and others, 2005; Ravallion, 2007), inequality indicators (Filmer and Pritchett, 1999; McGuire, 2006; Fay and others, 2005; Ravallion, 2007), poverty rates (Anand and Bärnighausen, 2004), but none were significant in our analysis. Two other variables – ethnic fragmentation and whether the country is predominantly Muslim – were also significantly correlated with infant mortality in Filmer and Pritchett (1999) and McGuire (2006). Both are time invariant and could not be introduced in our panel data analysis.
Finally, there has been an intense debate concerning the impact of public spending on health outcomes. Because our core independent variable is health aid, and since the impact of health aid goes through the route of public spending, we exclude this variable from our analysis. Moreover, when public spending is introduced into the regressions, we lose half of the countries in the sample.
Equation (1) is estimated on a panel of 98 developing countries, among which 38 African countries, from 1987 to 2004 (the full list of countries included in the sample is provided in Table A1 in Appendix). Child health data is leaping every four or five years (1990, 1995, 2000 and 2004). All the right-hand side variables are averaged5 over three years from 1 to t-4 and are measured in logarithm. We control for unobservable heterogeneity with country fixed effects, αi.
Endogeneity of Aid, Remittances and Income
There are two potential sources of endogeneity of aid and remittances to child health indicators. First, aid and remittances are given purposively and both donors and migrants are likely to take into account the situation of child health when allocating their flows. Even if aid is determined at the macro-level and remittances are determined at the micro-level both are likely to reflect, to some extent, the chances of survival of children. Second, there could be some omitted variables which affect aid, remittances and child health. For example, natural disasters are likely to induce both a deterioration of child health indicators and an increase in aid and remittances inflows.
We therefore instrument health aid and workers’ remittances.6 As instruments, we use a set of variables that capture historical and cultural relationships between developing countries and donor/destination countries. These variables are more likely to be exogenous to child health than any recipient/origin countries’ own characteristics. More specifically, we use the total aid budget of the five main donors weighted by cultural distance between receiving and donor/destination countries (whether they speak the same language and have the same religion).7
5
This is true for all right-hand side variables but education. We use the 1985 level of education to explain 1990 health outcomes, etc.
6
Note that the introduction of country fixed effects contributes to solving, although imperfectly, the omitted variable bias.
7
Income per capita is also endogenous to health indicators (Pritchett and Summers, 1996; Filmer and Pritchett, 1999). It is instrumented using twice lagged income per capita and its square.
Estimation of the Baseline Model
Our estimation of the baseline model proceeds in three steps. Equation (1) is first estimated with simple OLS. We then introduce country fixed effects to take into account unobservable heterogeneity in our sample. Finally aid, remittances and income are instrumented using TSLS including country fixed effects.8 Instrumentation equations are provided in Table A2 in Appendix.
Regressions (1)-(6) of Table 1 present the estimations of the baseline model when the dependent variable is either the under-five mortality rate or the infant mortality rate. Income per capita is highly significant and tends to decrease child mortality. The impact is quite strong: the coefficients of income in regressions (3) and (6) suggest that a one percent increase in income decreases child mortality by around 0.35 percent and infant mortality by around 0.31. The coefficient of income per capita is interestingly close to the coefficients found by Pritchett and Summers (1996) in their fixed effect estimations on infant mortality (0.31) and in their IV estimations (around 0.3) using a different set of instruments.
High fertility rates are harmful to child health, though the coefficient of this variable using different methods of estimations varies quite a lot. It is much higher – around 60% larger – in OLS and fixed effects estimations than in the TSLS with fixed effect estimations. We rely on regressions (3) and (6) where endogeneity and omitted variable biases are taken into account: a one percent increase in the fertility rate increases child and infant mortality by around 0.4 percent.
Surprisingly, the number of physicians is not significant in regressions (2)-(6) of Table 1. This result is different from that of Anand and Bärnighausen (2004) who find a strong impact of doctor and nurse density on various health indicators. It is worth noting that the number of physicians is significant at 1% in regressions (2), (4) and (5) when the fertility rate is omitted.9 The number of doctors and the fertility rate have a significant correlation of -0.73. Anand and Bärnighausen (2004) do not control for the fertility rate, which may explain their finding of a significant impact of doctor density on child health. Our regression analysis suggests that this variable may proxy structural demographic characteristics, which if included into the regression are more significant than human resources in health. It also suggests that the impact of physicians on child health goes through a decrease in the fertility rate.
Only in OLS estimations does female education have a significant impact on child and infant mortality rates. Again this variable is significantly correlated with the fertility rate (-0.44) and is significant in all columns of Table 1 when the fertility rate is omitted from the analysis. This suggests that the impact of female education on child health works through a decrease in the fertility rate. Whether including the fertility rate or not in the regressions is a matter of
8
Following the literature on the determinants of health and contrary to Mishra and Newhouse (2007), we do not estimate a system of moment equations using Generalized Method of Moments (GMM) with a lagged dependent variable. The main reason is that the number of time periods is too small.
9
empirics. Because the fertility rate remains significant in all specifications, we chose to keep it.
Finally aid and remittances both have a negative coefficient in regressions (1)-(6), but contrary to Mishra and Newhouse (2007), we find no significant impact of health aid, at this stage of our empirical analysis. By contrast, remittances are found to be strongly significant in most regressions, with the expected sign. When instrumented, the coefficient of remittances is multiplied by more than four: a one percent increase in remittances decreases child mortality by 0.18 percent and infant mortality by 0.16 percent.
Table 1. Impact of health aid and remittances on child and infant mortality, baseline model.
Child mortality Infant mortality
OLS Within TSLS OLS Within TSLS
(1) (2) (3) (4) (5) (6)
GDP per capita (a) -0.436 -0.291 -0.354 -0.380 -0.246 -0.312
(5.41)*** (3.26)*** (2.62)*** (5.06)*** (3.03)*** (2.49)**
Number of physicians per 1,000 -0.065 -0.046 0.012 -0.035 -0.038 0.013
(1.68)* (1.43) (0.17) (0.97) (1.28) (0.20)
Female educational attainment -0.124 -0.052 -0.052 -0.126 -0.038 -0.039
(1.81)* (0.73) (0.57) (1.97)* (0.57) (0.47)
Dummy for missing education var. -0.151 -0.128 -0.284 -0.154 -0.091 -0.240
(1.99)** (1.29) (1.42) (2.31)** (1.02) (1.29)
Fertility rate 0.724 0.668 0.398 0.598 0.635 0.373
(5.37)*** (6.97)*** (2.46)** (4.78)*** (7.21)*** (2.48)**
Remittances per capita (a) -0.035 -0.043 -0.177 -0.028 -0.033 -0.158
(1.67)* (3.35)*** (3.48)*** (1.45) (3.00)*** (3.34)***
Health aid per capita (a) -0.017 -0.009 -0.004 -0.013 -0.008 -0.008
(0.78) (0.94) (0.09) (0.59) (0.91) (0.19)
Constant 6.755 5.671 6.998 6.200 5.020 6.321
(9.24)*** (7.71)*** (5.83)*** (8.93)*** (7.48)*** (5.67)***
Fixed effects No Yes Yes No Yes Yes
Observations 325 325 325 325 325 325
Number of countries 98 98 98 98 98 98
R-squared 0.81 0.56 0.26 0.77 0.54 0.22
Sargan (p-value) 0.43 0.35
Income instrument. F-Stat (p-value) 0.00 0.00
Aid instrument. F-Stat (p-value) 0.10 0.10
Remit. instrument. F-Stat (p-value) 0.00 0.00
Notes: Robust t-statistics in parentheses. All variables except the education variable are averages over three-year periods, from t-1 to t-4, measured in logs. * significant at 10%; ** significant at 5%; *** significant at 1%. In equations 1 and 4, standards errors are clustered by country. (a) Instrumented regressors in equations 3, 4 and 5. Instruments include twice lagged GDP per capita and its square, and instruments for aid and remittances in the tradition of Tavares (2003), namely total aid budgets of the five largest donors (USA, Japan, France UK, Germany) in constant dollars and total aid budgets weighted by cultural (same language, same religion) distance variables.
Non-Linearities in the Aid-Health Relationship
As a next step to our analysis we explore in more detail the relationship between health aid and child health indicators. So far, we find no significant impact of health aid commitments.
However, a relative consensus has emerged in the literature regarding the fact that aggregate aid disbursements impact macro outcomes, such as economic growth, in a non-linear way.10
Similarly, the impact of health aid on health outcomes may be non-linear. This non-linearity may be due to constrained absorptive capacity. A way to proxy constrained absorptive capacity in the health sector is through an interaction of health aid with income per capita: health aid would be relatively more effective in richer countries because they have a higher capacity to absorb aid.
In order to explore this kind of non-linearity in the health-aid relationship we estimate an equation of the following form:
, ,( 1, 4) ,( 1, 4) 1 ,( 1, 4) 2 ,( 1, 4) ,( 1, 4) , Ln Ln Ln Ln Ln .Ln i t i i t t i t t i t t i t t i t t i t Health X Remittances
Health aid Health aid Income
α β δ θ θ ε − − − − − − − − − − = + + + + + (2)
where LnHealth aid.LnIncome is an interaction variable of aid with income per capita. It is instrumented using the same set of instruments as those for health aid and income per capita.
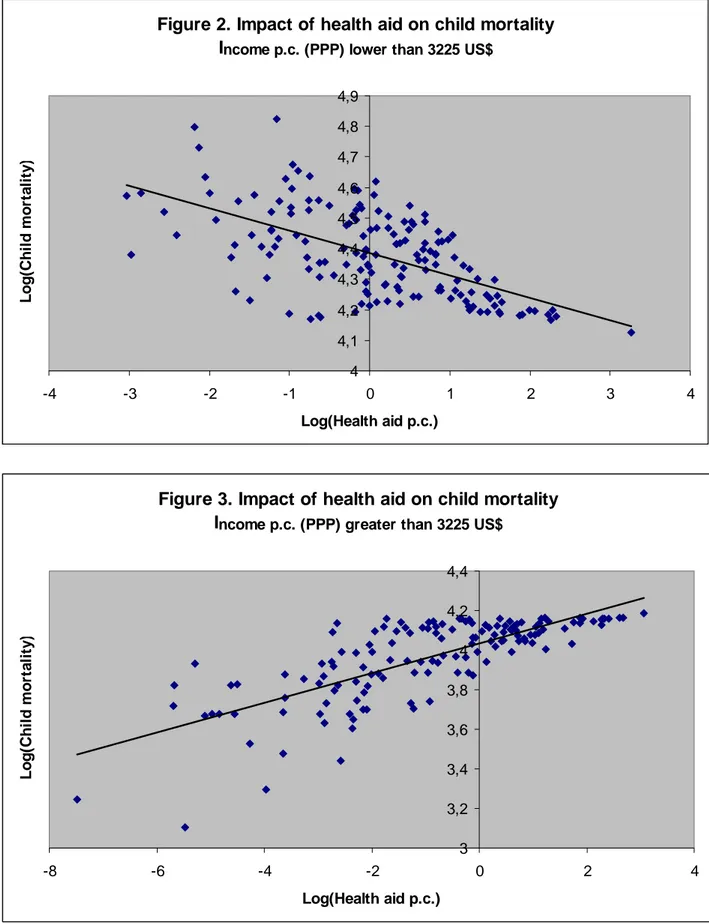
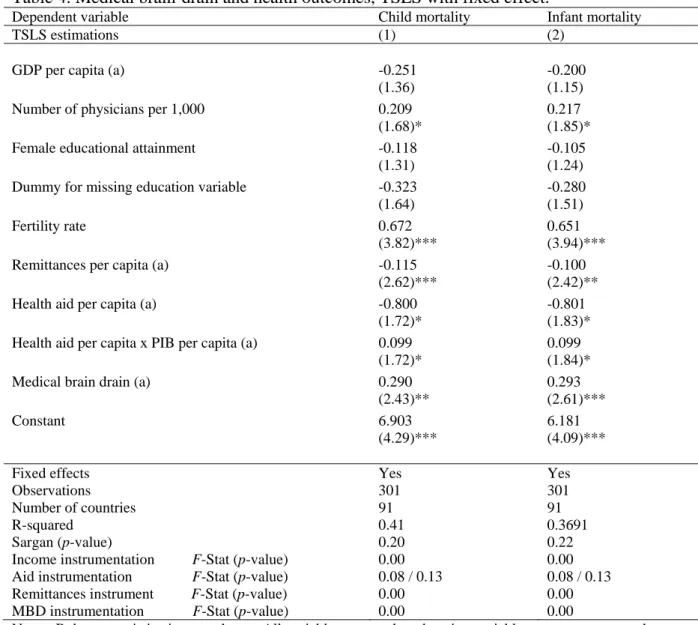
Results are presented in columns (1) and (2) of Table 2. The absorptive capacity hypothesis is not supported by our results. The impact of health aid is non-linear, but the non-linearity suggests that aid to the health sector is more effective in poorer countries. The threshold in income per capita corresponding to a switch to harmful aid is around 3,225US$ per capita (in PPP). Figures 2 and 3 depict the impact of aid on child mortality rate respectively below and above this income threshold. This threshold is quite high and implies that most African countries belong to the decreasing part of the relationship between health aid and health outcomes. Out of the 38 African countries in our sample, aid increases the child mortality rate in eight of them: Botswana, Cap Verde, Gabon, Mauritius, Namibia, Swaziland, Seychelles and South Africa. In the remaining 30 African countries, aid tends to improve child health indicators.
10
The kind of non-linearity is still debated, though. Some authors argue that the relationship is quadratic (Hansen and Tarp, 2001; Lensink and White, 2001). Other claim that aid’s impact depends on economic policy (Burnside and Dollar, 2000), on the vulnerability to external shocks (Guillaumont and Chauvet, 2001), on export price shocks (Collier and Dehn, 2001), on the fact of being a tropical country (Dalgaard, Hansen and Tarp, 2004).
Table 2. Non-linearity in the health-aid relationship, TSLS with fixed effects.
Dependent variable Child mortality Infant mortality
TSLS estimations (1) (2)
GDP per capita (a) 0.008 0.046
(0.03) (0.20)
Number of physicians per 1,000 0.009 0.011
(0.10) (0.11)
Female educational attainment -0.134 -0.121
(1.01) (0.95)
Dummy for missing education variable -0.467 -0.421
(1.59) (1.50)
Fertility rate 0.425 0.399
(1.85)* (1.82)*
Remittances per capita (a) -0.163 -0.144
(2.24)** (2.07)**
Health aid per capita (a) -1.784 -1.769
(2.54)** (2.64)***
Health aid per capita x Income per capita (a) 0.222 0.219
(2.55)** (2.64)***
Constant 4.269 3.621
(2.12)** (1.88)*
Fixed effects Yes Yes
Observations 325 325
Number of countries 98 98
R-squared 0.50 0.44
Sargan (p-value) 0.38 0.40
Income instrumentation F-Stat (p-value) 0.00 0.00
Aid instrumentation F-Stat (p-value) 0.10 / 0.15 0.10 / 0.15
Remittances instrument F-Stat (p-value) 0.00 0.00
Notes: Robust t-statistics in parentheses. All variables except the education variable are averages over three-year periods, from t-1 to t-4, measured in logs. * significant at 10%; ** significant at 5%; *** significant at 1%. (a) Instrumented regressors in equations 3, 4 and 5. Instruments include twice lagged GDP per capita and its square, and instruments for aid and remittances in the tradition of Tavares (2003), namely total aid budgets of the five largest donors (USA, Japan, France UK, Germany) in constant dollars and total aid budgets weighted by cultural (same language, same religion) distance variables.
Figure 2. Impact of health aid on child mortality Income p.c. (PPP) lower than 3225 US$
4 4,1 4,2 4,3 4,4 4,5 4,6 4,7 4,8 4,9 -4 -3 -2 -1 0 1 2 3 4 Log(Health aid p.c.) Log (C h il d m o rt al it y )
Figure 3. Impact of health aid on child mortality Income p.c. (PPP) greater than 3225 US$
3 3,2 3,4 3,6 3,8 4 4,2 4,4 -8 -6 -4 -2 0 2 4 Log(Health aid p.c.) L o g (C h ild m o rt a lity )
An alternative way of testing the constrained absorptive capacity hypothesis is to introduce the square of health aid into the regression. A quadratic relationship between health aid and health indicators would reflect marginal decreasing return to aid – after a given threshold of aid received, an additional dollar of aid is less effective, because the country no longer has the
capacity to absorb it. Aid square is never significant when introduced in any of the regressions.11 Moreover, its sign is negative, as is that of health aid. The absence of a quadratic relationship between health aid and health outcomes confirms our previous finding of no absorptive capacity constraints of aid to the health sector. Health aid seems to be more effective where the prospects of improvements in health indicators are higher i.e. in poorer countries.
Finally, we explore whether the results using health aid disbursements are similar to those with aid commitments.12 Regressions (1) and (3) of Table 3 reproduce the baseline model: health aid disbursements are not significantly different form zero. In regressions (2) and (4), health disbursements interacted with income are significant, confirming our previous result. The resulting income threshold – 2,200 US$ – is lower than when commitments are used. Three additional African countries – Cameroun, Lesotho and Zimbabwe – fall in the set of countries for which aid is harmful to health outcomes.
Table 3. Impact of health aid disbursements on health indicators, TSLS with fixed effects.
Dependent variable Child mortality Infant mortality
TSLS estimations (1) (2) (3) (4)
GDP per capita (a) -0.338 0.145 -0.288 0.190
(2.57)** (0.45) (2.33)** (0.61)
Number of physicians per 1,000 -0.001 0.064 0.009 0.073
(0.01) (0.58) (0.15) (0.67)
Female educational attainment -0.058 -0.129 -0.042 -0.113
(0.65) (0.85) (0.51) (0.76)
Dummy for missing education variable -0.282 -0.472 -0.237 -0.425
(1.44) (1.38) (1.29) (1.27)
Fertility rate 0.419 0.515 0.401 0.496
(2.73)*** (1.97)** (2.78)*** (1.93)*
Remittances per capita (a) -0.166 -0.159 -0.153 -0.146
(3.66)*** (2.09)** (3.58)*** (1.96)*
Health aid disbursements per capita (a) -0.016 -1.762 -0.011 -1.742
(0.33) (2.09)** (0.26) (2.11)**
Health aid disbursements per capita x PIB per capita (a) 0.229 0.227
(2.08)** (2.11)**
Constant 6.806 3.181 6.079 2.487
(5.79)*** (1.21) (5.51)*** (0.97)
Fixed effects Yes Yes Yes Yes
Observations 320 320 320 320
Number of pays 98 98 98 98
R-square 0.31 0.37 0.27 0.28
Sargan (p-value) 0.12 0.04 0.09 0.14
Notes: Robust t-statistics in parentheses. All variables except the education variable are averages over three-year periods, from t-1 to t-4, measured in logs. * significant at 10%; ** significant at 5%; *** significant at 1%. (a) Instrumented regressors. Instruments include twice lagged GDP per capita and its square, and instruments in the tradition of Tavares (2003), namely total aid budgets of the five largest donors (USA, Japan, France UK, Germany) in constant dollars and total aid budgets weighted by cultural (same language, same religion) distance variables.
11
Results are available from authors on request.
12
We also re-run all our regressions using aggregate aid disbursements instead of health aid disbursements, but the variable was never significant, suggesting that not all types of aid affect health outcomes. Results are available upon request.
Medical Brain-Drain
Our baseline model suggests that migrants’ remittances help improving health outcomes in developing countries. We now turn to analyzing the counterpart of workers’ remittances: the impact of the brain drain induced by migration on health outcomes in developing countries. More specifically, we explore the impact of the medical brain drain (MDB). Bhargava and Docquier (2007) provide a rich dataset containing information on the expatriation rate of physicians.13 We therefore introduce this latter variable into our model and estimate an equation of the following form:
, ,( 1, 4) ,( 1, 4) ,( 1, 4) 1 ,( 1, 4) 2 ,( 1, 4) ,( 1, 4) , Ln Ln Ln Ln Ln .Ln i t i i t t i t t i t t i t t i t t i t t i t
Health X Remittances MedicalBrainDrain
Health aid Health aid Income
α β δ γ θ θ ε − − − − − − − − − − − − = + + + + + + (3)
where MedicalBrainDraini,(t-1,t-4) is the expatriation rate of physicians, averaged over three years sub-period and transformed in logarithm. Health outcomes and medical brain-drain may be correlated to omitted variables – such as the quality of health infrastructures. We therefore instrument this variable using the income per capita of the main destination country.
Regressions (1) and (2) of Table 4 present the results when MBD is introduced into the analysis. The coefficient of MBD is highly significant and has the expected positive sign: a one percent increase in the rate of expatriation of physicians increases child and infant mortality rates by around 0.29%. The expatriation of human resources in the health sector has a harmful impact on health outcomes in developing countries. The net impact of migration on health outcomes is therefore mitigated. On the one hand remittances decrease child and infant mortality rates, while the medical brain drain increases them.
Interestingly, the MBD also affects the impact of health aid on health outcomes. Even though the threshold of income for which the relationship between aid and child health switches from negative to positive remains similar to those found in Table 2, the slope changes sensibly: it is divided by two (from -1.7 to -0.8), suggesting that the health improving impact of aid is much smaller when the MBD is taken into account. Not only the expatriation of physicians compensates the impact of remittances, but it also compensates the impact of health aid. One explanation of this phenomenon lies in the fact that health aid is partly targeted to training and education of physicians. When they leave the country part of aid investment is dissipated.
13
Table 4. Medical brain-drain and health outcomes, TSLS with fixed effect.
Dependent variable Child mortality Infant mortality
TSLS estimations (1) (2)
GDP per capita (a) -0.251 -0.200
(1.36) (1.15)
Number of physicians per 1,000 0.209 0.217
(1.68)* (1.85)*
Female educational attainment -0.118 -0.105
(1.31) (1.24)
Dummy for missing education variable -0.323 -0.280
(1.64) (1.51)
Fertility rate 0.672 0.651
(3.82)*** (3.94)***
Remittances per capita (a) -0.115 -0.100
(2.62)*** (2.42)**
Health aid per capita (a) -0.800 -0.801
(1.72)* (1.83)*
Health aid per capita x PIB per capita (a) 0.099 0.099
(1.72)* (1.84)*
Medical brain drain (a) 0.290 0.293
(2.43)** (2.61)***
Constant 6.903 6.181
(4.29)*** (4.09)***
Fixed effects Yes Yes
Observations 301 301
Number of countries 91 91
R-squared 0.41 0.3691
Sargan (p-value) 0.20 0.22
Income instrumentation F-Stat (p-value) 0.00 0.00
Aid instrumentation F-Stat (p-value) 0.08 / 0.13 0.08 / 0.13
Remittances instrument F-Stat (p-value) 0.00 0.00
MBD instrumentation F-Stat (p-value) 0.00 0.00
Notes: Robust t-statistics in parentheses. All variables except the education variable are averages over three-year periods, from t-1 to t-4, measured in logs. * significant at 10%; ** significant at 5%; *** significant at 1%. (a) Instrumented regressors in equations 3, 4 and 5. Instruments include twice lagged GDP per capita and its square, GDP per capita in physicians’ main destination country, and instruments for aid and remittances in the tradition of Tavares (2003), namely total aid budgets of the five largest donors (USA, Japan, France UK, Germany) in constant dollars and total aid budgets weighted by cultural (same language, same religion) distance variables.
Table 5 presents some simple descriptive statistics to investigate the correlation between aid to training and education in the health sector and the expatriation rate of the physicians. There are 130 countries for which we have both informations. Countries which receive more aid to training (fifth quintile) are also those who have the highest rates of expatriation. Similarly, countries which receive less aid to training (first quintile) are also those where the expatriation rate of physicians is lower. The picture is more blurred for intermediate quintiles. Table 5 says nothing about causation of any sort. However, it seems that higher aid to training in the health sector is associated with higher expatriation rates. This may be due to the fact that aid to education and training often takes the form of granting studies abroad or financing research exchanges.
Table 5. Distribution of countries by quantiles of aid and expatriation rate of physicians, 2004.
Aid training/education in health sector
Quantile First Second Third Fourth Fifth
Expatriation rate o f physicians First 8 2 9 3 4 26 Second 8 6 3 8 1 26 Third 5 7 6 5 3 26 Fourth 1 6 5 5 9 26 Fifth 4 5 3 5 9 26 26 26 26 26 26 130
Data on expatriation rate are from Bhargava and Docquier (2007) and data on training in the health sector financed by aid are from the CRS of the OECD (purposes 12181, 12182 and 12282).
Intra-Country Empirical Assessment
In this section, we investigate the intra-country impact of aid and remittances on child health indicators, by analyzing to what extent these transfers are targeted or not to the poorest. The discussion begins with a description of the data and the empirical strategy and ends with comments on our main findings.
Model and Data
We use the World Bank’s comprehensive database of Health, Nutrition and Population (HNP) statistics that compile development indicators from Demographic and Health Survey (DHS) by asset quintiles within countries (Gwatkin and others., 2007). Asset quintiles are computed using the first principal component in an analysis of the correlations between various consumer durables and other household characteristics, following a method proposed by Filmer and Pritchett (2001).
Few studies have used the HNP database to analyze the determinants of child-health outcomes. To our knowledge, the first one is Fay and others (2005). Using a sample of 39 countries and a country random-effect model, they assert that apart from traditional variables like GDP per capita, assets, education, and direct health interventions, better access to basic infrastructure services has an important impact on infant and child mortality, and stunting incidence. Nevertheless, Ravallion (2007) questions the robustness of their results, and criticizes their empirical strategy on three points. First, the model of Fay and others (2005) is a linear model, whereas a logarithm functional form would have be more appropriate given the fact that dependent variables are bounded. Second, by estimating a random-effect model, the authors implicitly assume that their country fixed-effects are not correlated with the regressors. This is a strong assumption, though, since many sources of latent heterogeneity across countries are suspected. Finally, there may be a strong presumption of bias due to the omission of within–country differences in women’s schooling. Using exactly the same data but estimating a fixed-effect model that includes female education and variables in log-linear form, Ravallion does not find any significant impact of infrastructure access on child health outcomes anymore. By contrast, his findings suggest a significant effect of health care access
and women educational attainment on child health.14 The paper by Fielding, McGillivray and Torres (2008) also uses the same data. Its purpose is to empirically examine the strength of the links between a number of MDGs and related variables including health, educational status and access to water and sanitation; and the extent to which aid impacts on these variables. They find that while aid is effective overall, the poorest sub-groups within each country are typically not the primary beneficiaries of these inflows.
In what follows, we use an updated HNP database in which some countries have multiple year data (the list of countries and years is provided in Table A3 in Appendix). This temporal dimension of the panel makes it possible to assess the impact of country-specific variables such as GDP per capita, aid, and remittances (that varies over time) in a model including country fixed effects.The dataset covers 47 developing countries among which 25 are in Africa, with five asset quintiles for each country-year, giving a total of 380 observations.
Table 6 provides summary statistics on the main variables of interest. As suggested by the figures, there exist strong health disparities within country that are correlated with wealth inequality. Households belonging to the poorest quintile of assets have the highest mean infant and child mortality rates and stunting incidence. For instance, child mortality is twice as high for the poorest quintile as for the richest one, whereas stunting is three times higher. Such a gap can be observed for the fertility rate that varies from 5.9 for the poorest to 3.0 for the richest. Nevertheless, these observed disparities between asset quintiles do not manifest themselves for female educational attainment. It should also be noted that the differences in the mean health indicators between the poorest and richest quintiles are always smaller than the ranges across countries within each quintile.
14
Table 6. Summary statistics
Variable Obs Mean Std. Dev. Min Max
Full sample
Infant mortality (a) 380 72.13 33.75 11.90 187.70
Child Mortality (b) 380 113.80 67.00 14.20 354.90
Severe Stunting (c) 345 12.17 8.70 0.30 36.70
Fertility rate (d) 380 4.55 1.80 1.20 8.50
Female educational attainment (e) 380 50.44 31.94 0.50 99.80
Poorest quintile by an "asset index"
Infant mortality (a) 76 86.88 31.32 32.00 187.70
Child Mortality (b) 76 140.08 62.82 39.10 297.90
Severe Stunting (c) 69 17.87 8.65 2.10 36.70
Fertility rate (d) 76 5.92 1.48 2.20 8.50
Female educational attainment (e) 76 29.15 25.98 0.50 98.70
Second quintile
Infant mortality (a) 76 82.62 32.71 23.80 152.30
Child Mortality (b) 76 132.33 69.25 27.30 354.90
Severe Stunting (c) 69 14.92 8.67 1.40 35.60
Fertility rate (d) 76 5.14 1.55 1.80 8.20
Female educational attainment (e) 76 39.24 29.75 1.00 99.50
Third quintile
Infant mortality (a) 76 75.91 34.14 19.70 157.20
Child Mortality (b) 76 120.08 69.44 23.50 348.30
Severe Stunting (c) 69 12.66 8.31 0.50 31.40
Fertility rate (d) 76 4.68 1.65 1.40 7.80
Female educational attainment (e) 76 48.38 30.98 1.50 99.80
Fourth quintile
Infant mortality (a) 76 65.64 32.17 11.90 142.00
Child Mortality (b) 76 102.63 64.63 14.20 314.90
Severe Stunting (c) 69 9.90 7.23 0.50 27.10
Fertility rate (d) 76 4.02 1.61 1.50 7.20
Female educational attainment (e) 76 59.09 29.71 4.80 99.60
Richest quintile
Infant mortality (a) 76 49.58 24.51 13.80 97.20
Child Mortality (b) 76 73.88 45.93 15.80 183.70
Severe Stunting (c) 69 5.51 4.57 0.30 19.90
Fertility rate (d) 76 2.96 1.15 1.20 6.20
Female educational attainment (e) 76 76.34 20.13 27.00 99.80
Notes
(a) Infant mortality: number of deaths to children under twelve months of age per 1,000 live births, based on experience during the ten years before the survey.
(b) Child mortality: number of deaths to children under five years of age per 1,000 live births, based on experience during the ten years before the survey.
(c) Severe Stunting (height-for-age): percent of children with a height-for-age Z-score of below –3 standard deviations of the median reference standard for their age.
(d) Fertility rate: average number of births a woman could expect to have during her lifetime if she followed the levels of fertility currently observed at every age. The TFR is calculated as the sum of average annual age-specific fertility rates for all reproductive age groups (usually 15-49 years) in the three years before the survey. (e) Female educational attainment: percent of women aged 15-49 years who had completed the fifth grade.
The intra-country model to be estimated is very similar to the cross-country model presented in the previous section in the sense that control variables are roughly the same and are expressed in log-linear form. The baseline model may therefore be written as follows:
, , ,( 1, 4) , , ,( 1, 4) ,( 1, 4)
LnHealthj i t =α βi+ LnXi t− −t +νLnXj i t+δLnHealth aid Lni t− −t +γ Remiti t− −t 5 5 5 ,( 1, 4) ,( 1, 4) , , 2 2 2 * Ln * Ln j j j j i t t j j i t t j i t j j j
q q Health aid q Remit
ϕ τ − − ω − − ε
= = =
+
∑
+∑
+∑
+(4)
where j is quintile index and qj are quintile dummy variables.
Vector Xi,(t-1,t-4) includes GDP per capita in PPP constant terms and the number of physicians per 1,000 inhabitants. These variables are averaged over three years from t-1 to t-4 and are measured in logarithm. Vector Xj,i,t contains quintile- and time-specific fertility rates and female educational attainment expressed in log-linear form.
In order to test whether the impact of health aid and remittances differs between quintiles, LnHealthaid and LnRemit are interacted with quintile dummies q2 to q5, the poorest quintile being the reference. We chose not to interact quintile dummies with the other control variables such as GDP per capita to limit the number of instruments when the IV specification is used. Finally, we control for quintile (
5 2 j j j q τ =
∑
) fixed effects as well as for country fixed effects.As in the cross-country analysis, endogeneity of aid, remittances and income is controlled for using an IV specification. Instruments include lagged GDP per capita and its square, total aid budgets of USA and Europe (i.e. the sum of France, UK and Germany aid budgets) in constant dollars. We also include total aid budgets of USA and Europe interacted with quintiles q2 to q5 among the instruments.
Estimation Results
The intra-country impact of aid and remittances on child health is assessed using three health outcomes, namely child and infant mortality rates and malnutrition as measured by stunting incidence.15 We proceed in two steps. First, the baseline model is estimated without including any interaction terms between health aid and remittances on the one hand and quintile dummies on the other hand (Table 7). We then add these interaction terms to our set of regressors (Table 8). Even though controlling for endogeneity and countries’ unobserved heterogeneity is likely to provide more reliable results (as in regressions (3), (6) and (9)), Tables 7 and 8 also present the results of simple OLS and fixed-effects regressions.
As suggested by Table 7, the impact of our control variables is quite similar to the one found using our cross-country specification. What differs is its magnitude. GDP per capita for instance tends to decrease infant and child mortality rates. However, when controlling for intra-country variance in health and wealth indicators, the coefficient of this variable is found to be twice higher than the one estimated in section III, suggesting that an increase of 1 percent of GDP per capita decreases child and infant mortality by about 0.8 percent. By contrast, the level of per capita income has no impact at all on stunting incidence. This result is not surprising, though. It is indeed commonly acknowledged that height-for age differences
15
This last variable could not be used in our cross-country regressions given the number of missing observations.
in poor countries have to do with factors such as food habits (the meat content of a meal, for example) that are not necessarily correlated with income per capita.
High fertility rates are detrimental to child health. This is especially true when stunting is used as our child health outcomes (its elasticity with regards to fertility rate is equal to 1.3%, whereas it is equal to around 0.5% for mortality rates). In accordance with our previous results but contrary to Ravallion (2007), female education is found to have no impact on child health. This lack of impact may result from the strong correlation between education and fertility rate. But it could also well be that the variable we extracted from the HNP database to measure female education available is less precise than the one used by Ravallion. Female education in Table 7 is measured by the percentage of women aged 15-49 years who have completed their fifth grade, whereas it is measured by female years of schooling in Ravallion (2007).
Turning to our variables of interest, estimation results suggest that remittances have a significant impact on stunting incidence only, whereas health aid is found to have no impact at all. The same holds true for the number of physicians per 1,000 inhabitants, which is found to have no significant impact on child health outcomes, except in the IV specification on child mortality.16
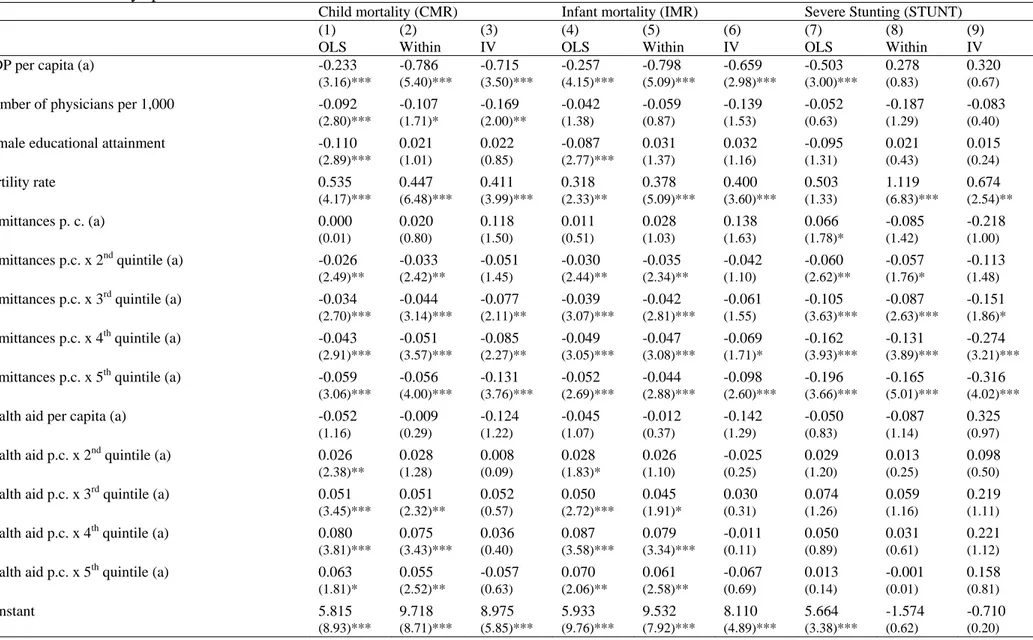
Adding interaction terms substantially alter the picture. As suggested by Table 8 indeed, migrants’ remittances are now significant and their impact on child health outcomes is found to be stronger for the richest quintiles than for the poorest ones (tests of joint significance of remittances and remittances interacted with quintile dummies are strongly significant in the regressions using child mortality rate and stunting incidence as dependent variables; they are not in the infant mortality equation). The impact of remittances is rather small, though. It is significantly negative only for the richest quintile in the child mortality equation (column (3)), with a very small coefficient (0.013). Remittances are more effective in reducing stunting rates, with an estimated elasticity of about -0.5 for the fourth and fifth quintiles. Overall, these results suggest that remittances tend to increase health disparities within countries.
By contrast, neither anti-poor nor pro-poor impact is found for health aid. This finding contrasts with that of Fielding, McGillivray and Torres (2008) who estimate a system of simultaneous equations on several welfare measures including health outcomes and find a significant negative impact of total aid (in percentage of GDP) on child mortality and an increased effectiveness of aid for the richest quintile.
As a final step, we check whether including medical brain-drain among the set of regressors changes the baseline results (Table 9). The expatriation rate of physicians does not seem to have a direct significant impact but seems to slightly reduce the impact of remittances on stunting incidence for the richest quintile, with an elasticity decreasing from 0.5 to 0.4%.
16
Note that substituting physician density for a health PC index like Fay et al. (2005) makes health care access negatively significant.
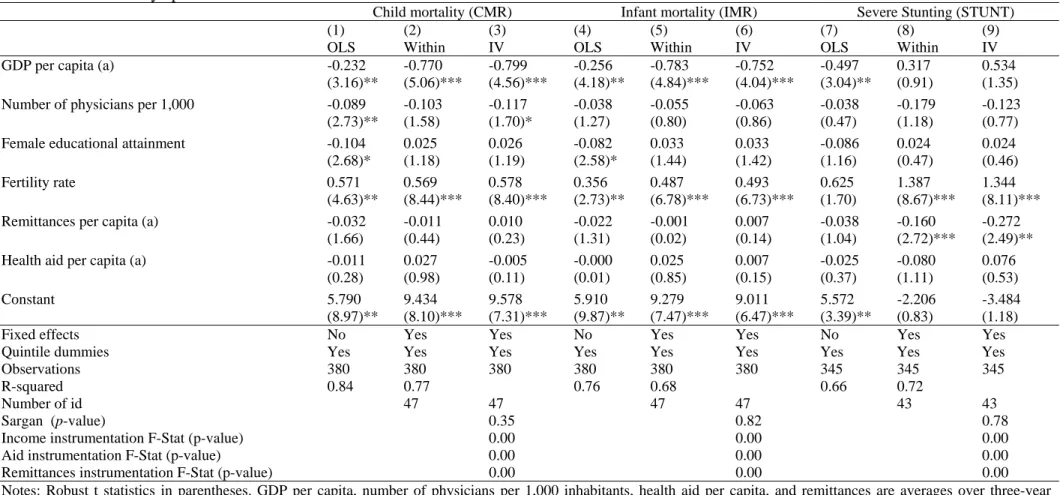
Table 7. Intra-country specification without interaction terms.
Child mortality (CMR) Infant mortality (IMR) Severe Stunting (STUNT)
(1) (2) (3) (4) (5) (6) (7) (8) (9)
OLS Within IV OLS Within IV OLS Within IV
GDP per capita (a) -0.232 -0.770 -0.799 -0.256 -0.783 -0.752 -0.497 0.317 0.534 (3.16)** (5.06)*** (4.56)*** (4.18)** (4.84)*** (4.04)*** (3.04)** (0.91) (1.35) Number of physicians per 1,000 -0.089 -0.103 -0.117 -0.038 -0.055 -0.063 -0.038 -0.179 -0.123
(2.73)** (1.58) (1.70)* (1.27) (0.80) (0.86) (0.47) (1.18) (0.77) Female educational attainment -0.104 0.025 0.026 -0.082 0.033 0.033 -0.086 0.024 0.024 (2.68)* (1.18) (1.19) (2.58)* (1.44) (1.42) (1.16) (0.47) (0.46) Fertility rate 0.571 0.569 0.578 0.356 0.487 0.493 0.625 1.387 1.344 (4.63)** (8.44)*** (8.40)*** (2.73)** (6.78)*** (6.73)*** (1.70) (8.67)*** (8.11)*** Remittances per capita (a) -0.032 -0.011 0.010 -0.022 -0.001 0.007 -0.038 -0.160 -0.272
(1.66) (0.44) (0.23) (1.31) (0.02) (0.14) (1.04) (2.72)*** (2.49)** Health aid per capita (a) -0.011 0.027 -0.005 -0.000 0.025 0.007 -0.025 -0.080 0.076
(0.28) (0.98) (0.11) (0.01) (0.85) (0.15) (0.37) (1.11) (0.53)
Constant 5.790 9.434 9.578 5.910 9.279 9.011 5.572 -2.206 -3.484
(8.97)** (8.10)*** (7.31)*** (9.87)** (7.47)*** (6.47)*** (3.39)** (0.83) (1.18)
Fixed effects No Yes Yes No Yes Yes No Yes Yes
Quintile dummies Yes Yes Yes Yes Yes Yes Yes Yes Yes
Observations 380 380 380 380 380 380 345 345 345
R-squared 0.84 0.77 0.76 0.68 0.66 0.72
Number of id 47 47 47 47 43 43
Sargan (p-value) 0.35 0.82 0.78
Income instrumentation F-Stat (p-value) 0.00 0.00 0.00
Aid instrumentation F-Stat (p-value) 0.00 0.00 0.00
Remittances instrumentation F-Stat (p-value) 0.00 0.00 0.00
Notes: Robust t statistics in parentheses. GDP per capita, number of physicians per 1,000 inhabitants, health aid per capita, and remittances are averages over three-year periods, from t-1 to t-4, measured in logs. Female educational attainment and fertility rate are measured at the same period as the outcome variable by quintile and are in logs. * significant at 10%; ** significant at 5%; *** significant at 1%.
(a) Instrumented regressors in equations 3, 6, and 9. Instruments include lagged GDP per capita and its square, and total aid budgets of USA and France, UK and Germany in constant dollars.
Table 8. Intra-country specification with interaction terms.
Child mortality (CMR) Infant mortality (IMR) Severe Stunting (STUNT)
(1) (2) (3) (4) (5) (6) (7) (8) (9) OLS Within IV OLS Within IV OLS Within IV GDP per capita (a) -0.233 -0.786 -0.715 -0.257 -0.798 -0.659 -0.503 0.278 0.320
(3.16)*** (5.40)*** (3.50)*** (4.15)*** (5.09)*** (2.98)*** (3.00)*** (0.83) (0.67)
Number of physicians per 1,000 -0.092 -0.107 -0.169 -0.042 -0.059 -0.139 -0.052 -0.187 -0.083
(2.80)*** (1.71)* (2.00)** (1.38) (0.87) (1.53) (0.63) (1.29) (0.40)
Female educational attainment -0.110 0.021 0.022 -0.087 0.031 0.032 -0.095 0.021 0.015
(2.89)*** (1.01) (0.85) (2.77)*** (1.37) (1.16) (1.31) (0.43) (0.24)
Fertility rate 0.535 0.447 0.411 0.318 0.378 0.400 0.503 1.119 0.674
(4.17)*** (6.48)*** (3.99)*** (2.33)** (5.09)*** (3.60)*** (1.33) (6.83)*** (2.54)**
Remittances p. c. (a) 0.000 0.020 0.118 0.011 0.028 0.138 0.066 -0.085 -0.218
(0.01) (0.80) (1.50) (0.51) (1.03) (1.63) (1.78)* (1.42) (1.00)
Remittances p.c. x 2ndquintile (a) -0.026 -0.033 -0.051 -0.030 -0.035 -0.042 -0.060 -0.057 -0.113
(2.49)** (2.42)** (1.45) (2.44)** (2.34)** (1.10) (2.62)** (1.76)* (1.48)
Remittances p.c. x 3rdquintile (a) -0.034 -0.044 -0.077 -0.039 -0.042 -0.061 -0.105 -0.087 -0.151
(2.70)*** (3.14)*** (2.11)** (3.07)*** (2.81)*** (1.55) (3.63)*** (2.63)*** (1.86)*
Remittances p.c. x 4thquintile (a) -0.043 -0.051 -0.085 -0.049 -0.047 -0.069 -0.162 -0.131 -0.274
(2.91)*** (3.57)*** (2.27)** (3.05)*** (3.08)*** (1.71)* (3.93)*** (3.89)*** (3.21)***
Remittances p.c. x 5thquintile (a) -0.059 -0.056 -0.131 -0.052 -0.044 -0.098 -0.196 -0.165 -0.316
(3.06)*** (4.00)*** (3.76)*** (2.69)*** (2.88)*** (2.60)*** (3.66)*** (5.01)*** (4.02)***
Health aid per capita (a) -0.052 -0.009 -0.124 -0.045 -0.012 -0.142 -0.050 -0.087 0.325
(1.16) (0.29) (1.22) (1.07) (0.37) (1.29) (0.83) (1.14) (0.97)
Health aid p.c. x 2ndquintile (a) 0.026 0.028 0.008 0.028 0.026 -0.025 0.029 0.013 0.098
(2.38)** (1.28) (0.09) (1.83)* (1.10) (0.25) (1.20) (0.25) (0.50)
Health aid p.c. x 3rdquintile (a) 0.051 0.051 0.052 0.050 0.045 0.030 0.074 0.059 0.219
(3.45)*** (2.32)** (0.57) (2.72)*** (1.91)* (0.31) (1.26) (1.16) (1.11)
Health aid p.c. x 4thquintile (a) 0.080 0.075 0.036 0.087 0.079 -0.011 0.050 0.031 0.221
(3.81)*** (3.43)*** (0.40) (3.58)*** (3.34)*** (0.11) (0.89) (0.61) (1.12)
Health aid p.c. x 5thquintile (a) 0.063 0.055 -0.057 0.070 0.061 -0.067 0.013 -0.001 0.158
(1.81)* (2.52)** (0.63) (2.06)** (2.58)** (0.69) (0.14) (0.01) (0.81)
Constant 5.815 9.718 8.975 5.933 9.532 8.110 5.664 -1.574 -0.710
Table 8. (continued)
Child mortality (CMR) Infant mortality (IMR) Severe Stunting (STUNT)
(1) (2) (3) (4) (5) (6) (7) (8) (9) OLS Within IV OLS Within IV OLS Within IV
Fixed effects No Yes Yes No Yes Yes No Yes Yes
Quintile dummies Yes Yes Yes Yes Yes Yes Yes Yes Yes
Observations 380 380 380 380 380 380 345 345 345
R-squared 0.84 0.79 0.77 0.71 0.68 0.75
Number of id 47 47 47 47 43 43
Joint significance of aid variables 0.0101 0.0105 0.6518 0.0343 0.0145 0.6129 0.4723 0.7195 0.5970 Joint significance of remittances variables 0.0109 0.0017 0.0086 0.0137 0.0286 0.1273 0.0065 0.0000 0.0012
Sargan (p-value) 0.53 0.56 0.92
Income instrumentation F-Stat (p-value) 0.00 0.00 0.00
Aid instrumentation F-Stat (p-value) 0.06 0.06 0.03
Aid X q2 instru. F-Stat (p-value) 0.03 0.03 0.01
Aid X q3 instru. F-Stat (p-value) 0.01 0.01 0.01
Aid X q4 instru. F-Stat (p-value) 0.01 0.01 0.02
Aid X q5 instru. F-Stat (p-value) 0.00 0.00 0.01
Remittances instrumentation F-Stat (p-value) 0.08 0.08 0.12
Remit. X q2 instru. F-Stat (p-value) 0.00 0.00 0.00
Remit. X q3 instru. F-Stat (p-value) 0.00 0.00 0.00
Remit. X q4 instru. F-Stat (p-value) 0.00 0.00 0.00
Remit. X q5 instru. F-Stat (p-value) 0.00 0.00 0.00
Notes: Robust t statistics in parentheses. GDP per capita, number of physicians per 1,000 inhabitants, health aid per capita, and remittances are averages over three-year periods, from t-1 to t-4, measured in logs. Female educational attainment and fertility rate are measured at the same period as the outcome variable by quintile and are in logs. * significant at 10%; ** significant at 5%; *** significant at 1%.
(a) Instrumented regressors in equations 3, 6, and 9. Instruments include lagged GDP per capita and its square, total aid budgets of USA and Europe (i.e.the sum of France, UK and Germany aid budgets) in constant dollars, and the lagged GDP per capita and the two aid budget donors crossed with quintiles q2 to q5.
Table 9. IV Intra-country specification with medical brain-drain.
(1) (2) (3)
CMR IMR STUNT
GDP per capita (a) -0.704 -0.637 0.211
(3.57)*** (3.04)*** (0.47)
Number of physicians per 1,000 -0.200 -0.165 -0.148
(2.63)*** (2.04)** (0.82)
Female educational attainment 0.030 0.041 0.004
(1.16) (1.49) (0.06)
Fertility rate 0.322 0.299 0.826
(2.51)** (2.19)** (2.51)**
Medical brain drain (a) -0.102 -0.109 0.077
(1.23) (1.24) (0.39)
Remittances per capita (a) 0.078 0.084 -0.043
(1.00) (1.01) (0.21)
Remittances p.c. x 2ndquintile (a) -0.054 -0.045 -0.106
(1.58) (1.25) (1.43)
Remittances p.c. x 3rdquintile (a) -0.087 -0.072 -0.134
(2.39)** (1.87)* (1.63)
Remittances p.c. x 4thquintile (a) -0.098 -0.084 -0.251
(2.57)** (2.07)** (2.83)***
Remittances p.c. x 5thquintile (a) -0.138 -0.105 -0.305
(4.01)*** (2.87)*** (3.94)***
Health aid per capita (a) -0.101 -0.110 0.183
(1.01) (1.03) (0.59)
Health aid p.c. x 2nd quintile (a) 0.019 -0.013 0.090
(0.22) (0.13) (0.47)
Health aid p.c. x 3rd quintile (a) 0.061 0.041 0.208
(0.69) (0.43) (1.10)
Health aid p.c. x 4th quintile (a) 0.046 0.001 0.208
(0.52) (0.01) (1.09)
Health aid p.c. x 5th quintile (a) -0.045 -0.053 0.138
(0.51) (0.57) (0.73)
Constant 8.690 7.778 -0.258
(5.74)*** (4.82)*** (0.07)
Fixed effects Yes Yes Yes