Crossing takeover premiums and mix of payment: Empirical test of
contractual setting in M&A transactions
Hubert de La Bruslerie1
Professor of Finance DRM-Finance
University Paris-Dauphine
Place du Mal de Lattre 75116 PARIS (France) [email protected]
Abstract
The analysis of the offer premiums and means of payment should not be done separately. In the empirical literature these two variables are often considered separately and independently although they may have endogenous relation. Using a sample of European M&As over the 2000-2010 decade, we show that these two variables are jointly set up in a contractual approach. The relationship of the percentage of cash with the offer premium is positive: higher premiums will yield payments with more cash.
We highlight that the payment choice is not a continuum between full cash and full share payment. The existence of two regimes of payment in M&A transactions is the first conclusion we draw. We analyze the major determinants of M&A terms when the offer premium and the means of payment are jointly set. The underlying rationale of asymmetry of information and risk sharing calculus is found significant in the setting of the agreement.
27/12/2010
Keywords : M&A, takeover premium, means of payment, contract setting JEL: G32, G34
1
The financial support of the Chair of Corporate Finance – Fédération Bancaire Française is greatly acknowledged.
Introduction
The empirical literature privileges largely the acquirer’s point of view: Why does he take the decision to bid for a target? How does he set his offered price? However, according Faccio and Masulis (2005), « In assessing potential determinants of an M&A payment method, our focus is on a bidder’s M&A financing choices, recognizing that targets can also influence the final terms of an M&A deal. » We will follow the latter’s intuition by analyzing a (successful) takeover as a contractual agreement where both parties find enough interest to lead the offer to a success. The two key variables defining a contract are the takeover premium, and the offered means of payment. The basis of a contractual approach is that these key variables are jointly determined and agreed as a package. We will not follow the track of numerous empirical studies that looks individually at premiums or means of payment because such an approach is incomplete.
A M&A is an economic project per se that bears some economic risk either for the target’s shareholder or for the acquirer’s shareholders. This new risk can be dealt with ex ante, at the contract setting using an appropriate choice of means of payment. Cash payment, i.e. receiving liquidity, is a way for the seller to avoid risk. For the same, shares payment is a way to bear some of the new risk introduced by the project. The M&A project and the means of payment are linked together as part of the same global setting agreed between the seller and the buyer. The means of payment decision is a part of the contract, which is as important as the price itself. In a risk sharing perspective, the means of payment are ex ante choice to share the expected risk (and profit) from the transaction. This should be particularly true in mixed payment schemes where the relative percentage between shares and cash payment is an equilibrium variable. In these contexts, the package of mixed payment percentage and takeover premium will define the contract, and both will refer to asymmetry of information. The link between these two variables has not been extensively analyzed in the empirical literature.
This paper tests the hypothesis of a global contractual setting linking the takeover offer premium and the means of payment. Empirical studies have often privileged the analysis of either the takeover premiums, or the means of payment. A joint empirical analysis is developed with regard to a sample of 528 EU deals using systems of simultaneous equations.
We show that offer premiums and means of payment interfere. We consider completed deals in the empirics of this paper. For a deal to success, it needs to satisfy both the bidder and the seller. Our findings support the view of M&A deals as global contractual equilibrium.
The development will be divided into three parts. Section 1 proposes a review of the literature. Section 2 will present the sample and the variables. The empirical results are analyzed in the third section. A conclusion follows.
1.1 Review of Literature
The takeover premium and the mix of payment have often been considered in separate strands in the literature.
1.1 Takeover premium
Takeover premium have been extensively studies in the empirical corporate finance literature in relation to ownership structure or to acquirer’s or target’s characteristics.
-) Ownership
Takeover premium level is linked with the ownership structure of the target. The high bargaining power of large blockholder may force acquirers to higher bids (Stulz, 1988). The use of controlling devices such as double voting rights, separation of votes and cash flow rights may enhance that positive relationship. The existence of shareholders agreement is also viewed as an efficient mechanism of coordination inside the controlling group. It leads to higher firm valuation (Volpin, 2002; Belot, 2010), and it results in higher takeover premiums. Either the existence of an agreement between blockholders or the aggregate voting rights of the controlling party influences positively the takeover premium for French firms (Belot, 2010). However premiums are also the consequence of private benefits paid to the inside owners or to incumbent blockholders. The latter trade their benefits against a higher premium, otherwise the incumbent shareholder will not accept to loose their control and /or their private benefits. Bebchuk (1994), Burkard et al. (2000) or Burkart and Panunzi, (2004) support theoretically this view, Empirically; Moeller (2005) gives support to it.
Deal characteristics also are important. The contestability of the offer is an element leading to higher prices (Stulz et al., 1990; Song and Walking, 1993). The empirical literature documents a positive relation between the target cumulative abnormal returns and the competitive nature of the bid.
-) Firms’ characteristics
When the target and the acquirer belong to the same economic sector, merging may yield economies of scale and higher profitability. The consistency of the project is measured by proximity or identity of the SIC codes of the buyer and the seller. Synergy gains will motivate higher bids by the bidder (Sundarsanam et al. 1996, Officer 2003). If the acquirer has already a stake of the target’s capital, it will give him a possible access to inside information. The toehold is defined by the percentage of shares owned by the bidder; it will explain a lower asymmetry of information. Betton and Eckbo (2000) showed that a toehold influences negatively the takeover premium.
On the target’s characteristics side, size is a traditional control variable. The premium is spread over a larger investment. In line with Officer (2003), the relationship between size and premium is expected to be negative. The financial leverage of the target is also important because it may signal a monitoring of the target firm by debtors. This is particularly true for controlled companies or family firms. It will limit private benefits and then explain lower premiums. On the other hand, higher debt leverage may be used as a power enhancing tool for the controlling group and consequently may help appropriating private benefits. Stulz (1988) mentions that target’s entrenched controller may force a bidder to pay a higher premium. So the sign of the relationship is not defined.
The process of takeover develops in a context of a double information asymmetry between the acquiring and target firms. Hansen (1987) was the first to mention the so-called “double lemons effect”, where each one has private information on his own value and has incomplete information on the nature of the assets he receives. The bidder buys assets of uncertain value. Being risk averse, he is willing to pay less when facing an information risk. He may also want to share the valuation risk by paying with equity of the newly merged group. The target’s shareholders will receive shares based on a new economic project based on forecasted profits and synergies. They may also insure themselves by receiving cash and avoiding share payment. Asymmetries of information will explain the risk-sharing attitudes of the buyer and
the seller and consequently the choice of a mix of payment (see below). Hansen (1987) measures the double asymmetry of information using the relative size of the target compared with the size of the bidder. The risk-sharing explanation is developed by Berkovitch and Narayanan (1990) who introduced the sharing of the synergy gains between the buyer and the target firm’s shareholders into the analysis. The seller’s appropriation of the synergy gains is linked to the difference in information between the two parties. Chang and Mais (1998) expanded the idea that an exchange of information can help to solve the problem of double information asymmetry. They introduced a prior holding in the target’s capital (“toehold”) as a means to reduce the buyer’s asymmetry of information. In such a situation the buyer has a better inside knowledge of the target, especially if he holds a large portion of capital (Goldman and Qian, 2004). Cheng et al. (2008) used a sample of US firms to compare asymmetry of information, bid premiums and means of payment. They show that means of payment and bid premiums are interdependent, with means of payment conditioning heavily the price paid in the deal for a given asymmetry of information between the two parties. This suggests that the two terms are linked in a contract design perspective.
1.2 Means of payment
The literature devoted to means of payment follows another strand. A payment by shares has no consequence on the cash situation of the firm because the acquirers issues new shares. However, it may have consequence in terms of (i) signal to the firm’s shareholders and (ii) wealth situation of the final shareholders because of the dilution of the perspectives in value creation.
In a M&A decision, a bidder is facing a choice between using cash and stocks as deal payment consideration. This alternative choice has conflicting effects and follows different explanations. A first rationale ensues from the starting idea that the financing decision is separated from the investment decision. The M&A project is first selected and then the acquirer considers ways to optimally finance the possible deal. The constraints here are the limits of the financial leverage or of the shareholder control structure of the bidder. Generally bidders have limited cash and liquid assets, so cash offers require debt or equity financing. The pecking order theory says that acquirers will first choose internal funds. These funds are available either as holdings or as internally generated cash flow. Initiators with cash
availability will prefer cash payment (Martin, 1996). Partial or full payment in shares may express the existence of financial constraints (Myers and Majluf, 1984). However, equity financed transactions may yield problems in keeping up control when shareholding is concentrated. As Faccio and Lang (2002) pointed out, this situation occurs frequently in the EU. As a consequence, a bidder implicitly faces a choice of debt or equity financing, which involves a trade-off with corporate control concerns. Faccio and Masulis (2005) explain mixed payment in takeover by the structure of control and by the debt level of the acquiring firms. Their empirical tests on European mergers and acquisitions support the idea of a preference for a cash payment when there is a large shareholder owning 20% to 60% of the capital of the buyer. The bidder’s M&A currency decision is strongly influenced by his debt capacity and existing leverage. It can also be strongly influenced by entrenched managers or by the blockholder’s desire to maintain the existing corporate governance structure.
Payments in cash, either full-cash or mixed cash payments, need to be financed. The literature analyzes classically means of payment without questioning the source of funding the M&A transaction at the acquirer’s level. The acquirer may issue and sell new equity stocks, or issue debt, or use the firm’s cash holdings. Martynova and Renneboog (2009) analyzed the financing decision behind the choice of the means of payment in M&A transactions. Externally financed M&A are funded by 30% by equity and 70% by using debt. In a sample of Europeans deals they show that the financing decision and the choice of means of payment are driven by distinct determinants and are not interdependent. However, there show a significant evidence of an indirect and reverse influence of the means of payment on the internal/external financing choice. There is also an influence of the bidder’s choice to share or not the risk of the transaction with the target’s shareholders and/or to buy out these shareholders. In such a situation, equity payment and equity financing are privileged.
The means of payment choice is also sensible to the genuine context of the deal. Strategic competition between bidders is the first reason given to prefer cash. Fishman (1989) analyzes the strategic role of the means of payment in public takeover and considers that a pure cash offer is dissuasive and signals good quality target firms. However, his model leads to cash-only or share-cash-only payments. Fishman relates the payment by cash to the future profitability of the target as expected by the competing bidders. Cornu and Isakov (2000) develop a model in a context of a competitive offer between two acquiring firms. The risk, when the first one sets a price offer and a means of payment, is to trigger a counter-offer by the other firm. In
order to disclose information on his strategy, the first bidder can use a signal through an announcement of a pure cash payment or a pure share payment. However, the large majority of mergers and acquisitions are non-hostile and the means of payment are diversified. The characteristics of the payment scheme have to be analyzed in a context of a known success of the takeover
The portion of capital the bidder wants to receive (beyond gaining control) is an adjustment variable. That fraction reveals private information about the buyer’s real value. If the means of payment disclose private signals to other parties, it will in return also influence the process of negotiation. Hansen’s model explains the probability of paying in cash or in shares but does not focus on mixed-payment schemes. Double asymmetry of information may explain risk sharing choices and payment with shares issued by the initiator. Eckbo, Giammarino and Heinkel (1989) refer explicitly to the idea of an optimal mixed cash-shares payment. They were the first to highlight that the weighting between these two means of payment will reveal to other parties the respective quality of competitive buyers. Martin (1996) links the cash payment with private information: an acquirer with good growth opportunities will prefer a shares payment.
The empirical literature on means of payment identifies the existence of different rationale explaining the cash or the equity choice (Carleton et al., 1983). The cash paid acquisitions are found to have better performances after (Linn et al. 2001). The literature on mixed cash-equity payments is relatively recent. On a factual ground, mixed payment schemes have become increasingly important in mergers and acquisitions, particularly when considering offers for large firms. Goergen and Renneboog (2004) analyzed public takeover bids in Europe during the 1990s. Looking at a sample of 156 offers, 93 were pure cash, 37 pure shares and 18 were mixed payment. Among the latter, the portion of cash accounted for 45.9% of the total payment. Faccio and Masulis (2005) considered a larger sample of 3,667 mergers or acquisitions of European firms at the end of the nineties. The number of mixed payment operations is only 11.3% (with an average proportion of 57% in cash and 43% in shares). The size of a mixed payment takeover bid was five times (1.1 billion USD) greater than the size of a standard pure cash offer (209 million USD). Mixed payment schemes represent a far greater proportion of transactions as the value of transactions rises2. However,
2
The high number of all-cash takeovers in their sample is partly explained by the number of cross-border takeovers with US bidding firms, who are used to propose full payment in cash.
this discrepancy is largely explained by cross-border transactions, where a large number of small deals are paid in cash. Comparing average relative sizes of the target with the acquirer gives similar results between mixed (16%) and full-shares payments (18%). Cash payments seem more devoted to relatively small targets, with an average relative size of 8% for transactions dealt fully in cash. In recent years, the number of mixed-payment takeovers has been increasing. Martynova and Renneboog (2006) considered 1,721 European takeovers between 1993 and 2001 and discovered that 54% were all-cash, 25% were mixed and 20% were all-equity transactions. On average, the mixed payments comprised 47% of stocks and 53% of cash. Ben-Amar and Andre (2009) examined 293 Canadian mergers and acquisitions over the period 1998-2002. The sample composition was 58% cash-only, 19% stocks-only and 22% mixed payments. However, the latter represented 32.3% of the total value of the transaction, pointing out that mixed payment takeovers occur particularly in the higher value transactions. For mixed-payment takeovers, the average percentage of cash was 49% but with a standard deviation of 50%, corresponding to huge differences within payment schemes.
Cross border M&A are usually more paid in cash. This traditional setting is documented by Chevalier and Redor (2007). They show that geographical distance is a good proxy for cultural distance. It is also a source of asymmetry of information for transactions located in far countries. This explains why cross border acquisitions are per se more paid in cash. Their dependant variable is the percentage paid in cash for US acquiring firms and includes mixed payment. The target shareholders will prefer cash because shares from a foreign firm may be not easily traded. The quality of the assets of a far away company is more difficult to assess. The information asymmetry develops with distance as shown by Chevalier and Redor (2010). Conversely, tax system will favor equity payments. In European tax systems, the payment by cash is considered as sales and the shareholder will exhibit effective gains submitted to income tax. Share payments are exchange of assets and are not considered as taxable effective gains. The target’s shareholders can defer later tax liabilities by accepting stocks as payment.
1.3 The contractual nature of the transaction
The chosen means of payment may also reveal the specific characteristics of the transaction. An M&A is an economic project and a contractual agreement with a seller. When it occurs, it signals a joint agreement between parties. The target’s shareholders are not forced to sell (except in buyout transactions).
The risk of asymmetry of information is (partially) solved in such a contractual setting, by the level of the premium and by the choice of means of payment. La Bruslerie (2010) showed that choices are not univocal but occur in a process conveying private information from one party to the other. Mix of payment and takeover premium interfere. If the risk on the target’s assets is important or if the acquirer is risk averse, he may prefer payment in shares. However if the perspectives of profit after the acquisition are large, the acquirer’s shareholder will privilege a payment in cash in order to keep all the profit. Equilibrium between risk and return explains the choice between means of payment, and a trade-off will develop with the acquisition premium. If a buyer is insured against future bad news through a payment by shares, he can offer a better price. This equilibrium may give “corner solutions”, i.e. either full cash or full share payments. But it may also lead to mixed payment were the percentage paid in cash is a relevant measure of information asymmetry. The same calculus is followed from an inverse point of view by the targets’ shareholders. They are exposed to an information risk on the future gains in synergy and on the expected profit of the newly merged company. If they are expecting high profit or if they are delivered optimistic information, they will prefer share payment (for a given price paid). Except for corner solution where other determinants fully explains all–cash or all-shares payments, the percentage of cash in mixed payment schemes is part of the deal and defines the equilibrium concurrently with the agreed price.
In a model, La Bruslerie (2010) shows that, from the buyer’s point of view, (i) correlated activities and economic risk between the target and the acquiring firms will result in a larger payment with cash; (ii) a trade-off develops between the percentage in cash and the premium paid in the acquisition. For the acquirer, the cash payment portion increases with the perspectives of profit due to synergy gains. The seller will accept a negative trade-off between a higher (lower) cash payment and a lower (higher) transaction price (i.e., a lower/higher portion of the expected acquisition gain). It is shown that mixed payment will only develop between “corner solutions” of full cash or full share payments, where the expected profit from the acquisition is between two limits.
The regulatory environment may also play a significant role in the contract setting. Some countries developed investor protection regulations which facilitate M&A transactions. In the European Union, a regulation is effective and gives strength to the protection of shareholders. It enforces an equal treatment principle between shareholders. The EU 13th directive was formally adopted in 2000 and implemented in the European countries, although with some local difference. Any takeover bid or private acquisition should be analyzed by the EU administration and comply with anti monopoly rules. European financial regulation is made at the global level and tries to set up “a unique global financial market”. The accounting policy in Europe should also comply with common rules. As an example, the introduction of the new common IFRS rules was enforced in 2005. Legal rules and procedures are taken at the countries level but must conform to the EU “directives”. The introduction in the domestic law system of each country may also explain differences. La Porta, Lopez-de-Silanes, Shleifer, and Vishny (1998) highlight the importance of the legal system. However the legal code indicators, flagging Scandinavian, French, Anglo-Saxon or German origins, are found insignificant by Faccio and Masulis. We will thereafter limit the influence of regulatory environment by looking only to M&A transaction targeted at firms located in the 7 major European countries (i.e. UK, France, Italy, Germany, Spain, Italy and Belgium). We will disregard the recent European becoming countries (such as Eastern Europe countries) or tax-heaven countries (Luxembourg). The sample is then homogeneous with regard to the regulation context.
2 Data and variables
2.1Data
The sample of European takeover was built from the Thomson One Banker date base. The period was limited to transactions between 01/01/2000 and 01/05/2010. The following filter was used to focus on meaningful operations: a minimum value of 50 million USD is required. Target companies are limited to firms belonging to seven EU countries: France, Germany, United Kingdom, Spain, Belgium, Netherlands, and Italy. We select deals where the type of assets targeted by the acquirer is stock or equivalent stocks (i.e. assets giving rights to stocks). The means of payment referred at are only cash or stock (see Annex 1).
We excluded offers coming from non developed countries, restricting to North American, European, or Japanese buyers. If the acquirer proposes his stocks as a valuable mean of payment, it requests that a large transparent and market exists for his stock to be accepted. This is why we restricted both targets and acquirers to be public firms. A sample of 528 transactions is followed. We checked the used mode of payment through the data. A lot of deals are qualified “cash only” or “stock only” in the data base. Mixed payment transactions have also been screened. Those qualified as “hybrid” show a payment scheme with a percentage of cash and stocks. We only consider “pure” mixed payment with a percentage of cash and a percentage of stock summing up to one. Some deals are qualified as “unknown”. By looking at each operation syllabus we can allocated a lot of them to mix payment schemes. Deals with earn out payment considerations are excluded because of this uncertainty and complex features. Some transactions may involve payment in debt (particularly in the UK). This possibility is proposed alternatively with a cash payment. When analyzing deals with a debt payment, they generally appear to be equivalent to cash payment. So “cash payments” in the paper are defined as in Faccio and Masulis (2005) and includes cash, non-contingent liabilities and newly issued notes. We incorporate in the sample a lot of hybrid cash/debt/stock payment and recalculate the percentage of cash and shares summing up to one.
The Faccio and Masulis sample considered deals from European bidder directed to any country in the world. It gives a large weight to UK firm deals (65% of the sample). We look at M&A targeted at European firms from major developed countries. Similarly to Faccio and Masulis, our sample is mainly intra EU: in their sample 77% of the bids come from European countries, 79% in our sample.
Some deals were not documented without any price, or were initiated by Russian entities, or were squeeze out transactions (2 deals).3 They were not considered. So we are left with 504 transactions. The analysis of the sample leads to identify some transactions that are buyback programs launched by the company’s board. Here the target’s shares are the company’s stocks or a subsidiary’s. In these situations we do not have independent targets and acquirers. The buybacks were deleted (72 transactions). The remaining core of our sample is 432
3
We eliminated also buyout deals from the analysis. They are not transaction between shareholders of two different and independent firms. They are decisions made by managers on behalf of the controlling shareholders to buy the shares of the firm. It does not involve another party.
transactions of which 294 full cash payment, 62 mixed cash-share (called “hybrid”) and 76 full share payments. The global value of theses deals is 898 billions USD. Some big acquisitions will explain this amount: the biggest transaction is the Bencham/Glaxo acquisition and has a transaction value of 76 billions USD. The smallest operation shows a transaction value of 50.2 millions USD.
2.2 Descriptive statistics
When considering the 3 sub samples of full cash, full share and hybrid (i.e. mixed cash-share) payments, we point out differences in the average deal size (see Table 1). As in Faccio and Masulis, we find that cash deals are the most numerous but also have a relatively small size. Hybrid transactions are 3 times larger than cash paid deals (five times in the Faccio and Masulis’ sample). Full share payments are important deals. The cumulated values of the deals paid fully either in cash or in stock, are equivalent (i.e. around 40% of the grand total each). The mixed payment transactions are not negligible; they represented a cumulated value of 211 billions USD and 24% of the total sample. A test of difference in size show that shares and hybrid transactions are not different (p=0.34), but the sizes between full cash and hybrid transactions, on one hand, and full cash and full share transactions, on the other hand, are different at the 5% level (both p=0.03).
Number Total value Av. deal size
Cash 294 68.1% 365192 40.7% 1242.15
Hybrid 62 14.4% 211775 23.6% 3415.72
Shares 76 17.6% 321091 35.8% 4224.89
Total 432 898058
Table 1 Number and value of European M&A 2000-2010
(Sample of 432 transactions after exclusion of squeeze out and buyback programs of the original sample of 528 deals, 2000-2010, see annex1; values in million USD; source Thomson One Banker)
An important number of deals were private deals. Direct negotiation between the two parties converged and a block sale occurred. A total of 66 private transactions were identified, often linked to going private operations. All these private acquisition are “cash only” deals.
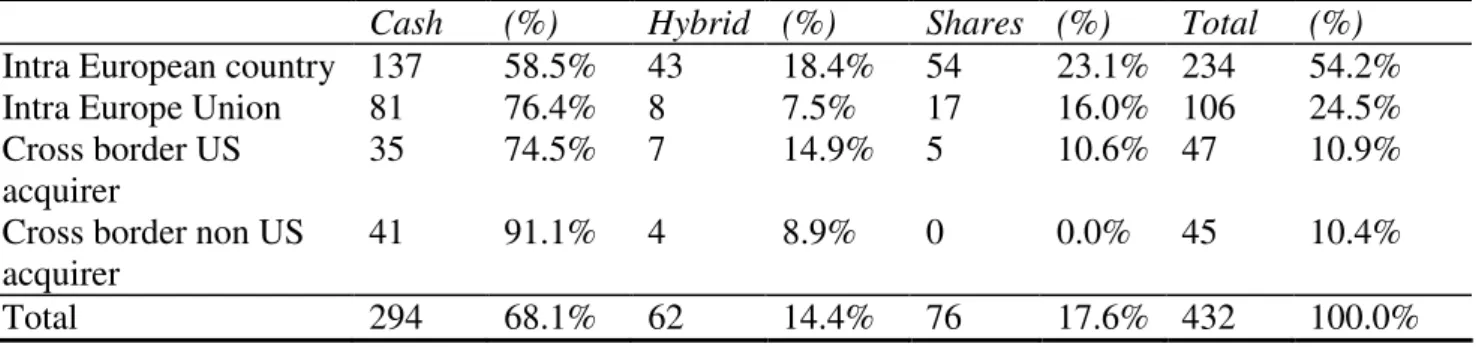
The sample of targets firms shows a large number of deals targeted at British firms (43%). Martynova and Renneboog (2009) noticed the same dominance of British firms in their sample. The transactions initiated by acquirers located in the EU represent 79% of the sample (see Table 2). Cross border deals (21% of the total) will refer to outside EU acquirers. Table 3 analyzes the origin country of the target by means of payment. We introduce a distinction between cross border acquirers coming from the USA and acquirers coming from the rest of the world. We see that pure intra country deals are more often paid full share than full cash. Conversely, non US acquirer entering into a cross border acquisition will pay 9 times out of 10 fully in cash. However looking at initiators coming from other EU countries or from the USA, they have similar proportions of mean of payment. For instance, we cannot say that US acquirers will systematically pay in cash. They use full cash payment only 3 times out of 4.
Target Country Number %
Italy 18 4.17% France 69 15.97% UK 186 43.06% Netherlands 46 10.65% Germany 48 11.11% Spain 52 12.04% Belgium 13 3.01% Total 432 100.00% (Intra EU acquirer) (340) (78.70%)
Table 2 European M&A transactions by country of target firm
(Sample of 432 transactions, period 2000-2010, target firms incorporated in Italy, France, the UK, the Netherlands, Germany, Spain and Belgium; Intra EU acquirer: Initiator incorporated in North America, Japan or other European countries; see Table 1)
Cash (%) Hybrid (%) Shares (%) Total (%)
Intra European country 137 58.5% 43 18.4% 54 23.1% 234 54.2%
Intra Europe Union 81 76.4% 8 7.5% 17 16.0% 106 24.5%
Cross border US acquirer
35 74.5% 7 14.9% 5 10.6% 47 10.9%
Cross border non US acquirer
41 91.1% 4 8.9% 0 0.0% 45 10.4%
Total 294 68.1% 62 14.4% 76 17.6% 432 100.0%
Table 3 Target country and means of payment
(Number of transactions, sample of 432 European transactions, period 2000-2010, see Table 2)
We analyzed the industry sector of the acquirer and the target firm using the Thomson Financial mid code. A total of 219 deals (51%) are within industry M&As.
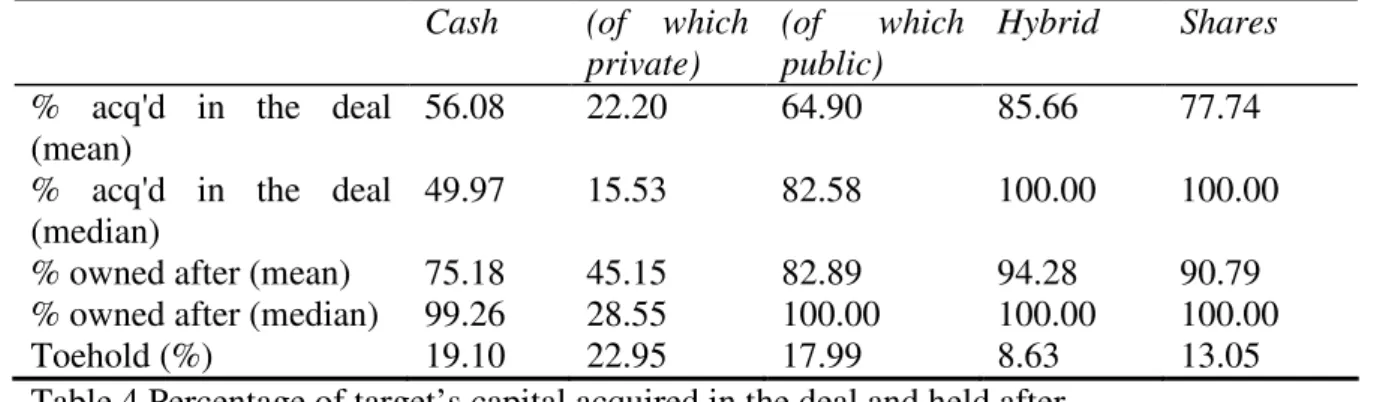
A deal is aimed at buying a large block of stocks, generally giving the initiator majority of the equity capital. However the aim to get a controlling block should at the end take into account the percentage of share previously owned by the bidder. A toehold block may explain why the percentage of shares sought is lower, although it gives a controlling position at the end of the deal. A first feature of M&A transactions is the percentage of shares acquired in the deal. It cumulates with the percentage of shares previously held to give the percentage of shares owned after the transaction. On average over the sample, the percentage of acquired shares is 58%, the percentage sought in the deal is 63% and the percentage owned after the transaction is 73% of the capital. It means that significant toeholds exist representing on the average 15% of the capital. It is explained by the subsidiary feature of many target firms. A total of 101 targets are subsidiary (19% of the total sample). Among the subsidiary targets sub sample, the toehold percentage is on average 45.6% (median 54.6%) of the capital. The non subsidiary firms have an average toehold of 8.5%.
In a contractual approach a deal is an agreement set on a quantity and a price. Looking at firm’s acquisition, the quantity side is the percentage of shares of the target acquired in the transaction. It cumulates with shares previously held by the bidder. Looking at means of payment, the percentage of shares acquired in the deal is similar using hybrid or share payments considerations. Cash payments exhibit lower acquired percentage and lower owned percentage after the deal. This is explained mainly by private block acquisition where the average bought block represents 22% of the capital. However, in that situation, the toehold is more important and shows a significant previous investment in the target’s capital (around 23%). The cash payment in public takeover is targeted at larger acquisition of capital (average of 65%). As a result we see that the aim of M&A transactions is control because the final owned percentage is largely around 80 to 90% of the capital of the target firm. We separate in the cash deals those following a private acquisition mechanism and those following a public takeover bid procedure. Private deals seem to follow a rationale of control building process. The acquirer of a block takes advantage of an opportunity given by a seller even if the size of the block in itself does not give him an immediate control of the target. Many blocks are small block acquisitions (with median private acquisition of 16% of the target’s capital). In the case of private deals, cumulating with previous ownership results in a final blockholding of 45% of the capital. It implies a controlling position.
Cash (of which private)
(of which public)
Hybrid Shares
% acq'd in the deal (mean)
56.08 22.20 64.90 85.66 77.74
% acq'd in the deal (median)
49.97 15.53 82.58 100.00 100.00
% owned after (mean) 75.18 45.15 82.89 94.28 90.79 % owned after (median) 99.26 28.55 100.00 100.00 100.00
Toehold (%) 19.10 22.95 17.99 8.63 13.05
Table 4 Percentage of target’s capital acquired in the deal and held after (Sample of 432 European transactions; 2000-2010)
The average data in table 4 will cover very different situations particularly for cash payments where the median is lower than the mean. M&A transactions are joint contractual agreements between the bidder and the shareholders of the target firm, which are characterized (among other variables) by the percentage of acquired shares. If the means of payment have no significant influence on the contract setting, we will get similarly distributed variables in table 4 and no significant differences in the percentage of acquired or owned capital. A t-test of average is run to check if the difference in percentages of capital acquired or owned is significant according the mean of payment. Table 5 puts into evidence different rationales. The percentages of capital got through different means of payment are significantly different. The nature of the deal is different if we consider cash payment in private or public transaction. Cash payment involves percentages of capital of the target firm significantly larger than the other means of payment. The unidimensional test shows that the choice of mean of payment interferes with one of the main terms of the contractual setting. For rational players it is a significant variable that influence the agreements. However, in any situation, the averages are not different when considering hybrid and full share payments. If we look at the targeted share of capital, there is no difference in the nature of the deal between hybrid and share payments.
Means of payment % acq'd in the deal % owned after
Cash vs. share deals 0.00 0.00
Cash/private deals vs. Cash/public deals
0.00 0.00
Cash/public vs. hybrid deals 0.00 0.00
Cash vs. hybrid deals 0.00 0.00
Hybrid vs. share deals 0.14 0.32
Table 5 Test of difference between the percentage of acquired and held capital after the transaction
Looking at hybrid payments, the average percentage paid in cash is 47%. The distribution of the percentage of cash is large. For instance 25% of the mixed payment deals have a cash part lower than 30% of the transaction value (see table 6).
Average Median 1st Quart. 3rd Quart N
% paid in cash 47,19 49,14 29,97 66,09 58
Table 6 Percentage paid in cash in mixed payment transactions (Sample of 432 European M&A transactions)
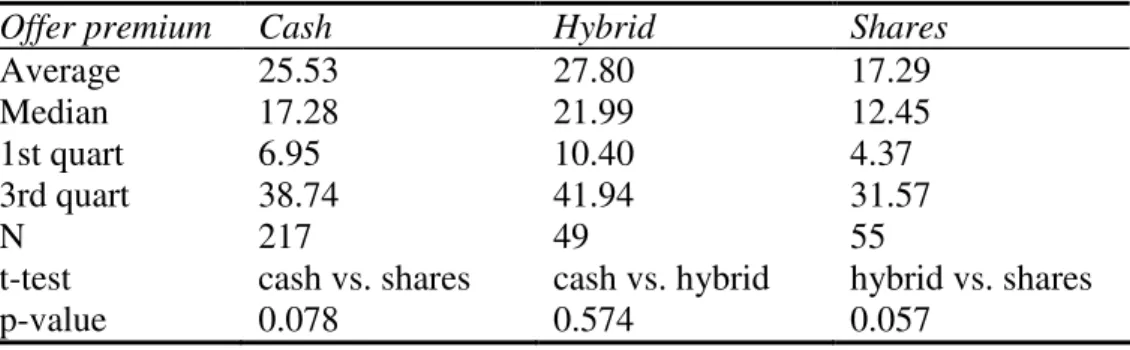
The offer premium in percentage is another term of the transaction. On average the premium is between 17 and 28% of the target’s share price 1 day before announcement. Looking at the means of payment, average paid premiums seem to be similar. Particularly, average full cash and hybrid premiums are very close. A t-test confirms the rejection of the idea of different premiums according to hybrid or full cash payments. However these results are not strong comparing shares payment premiums between with the others. Share payment premiums are different and significantly lower only at the 10% level.
Offer premium Cash Hybrid Shares
Average 25.53 27.80 17.29
Median 17.28 21.99 12.45
1st quart 6.95 10.40 4.37
3rd quart 38.74 41.94 31.57
N 217 49 55
t-test cash vs. shares cash vs. hybrid hybrid vs. shares
p-value 0.078 0.574 0.057
Table 7 offer premium by mean of payment 2.3 Variables
The variables are described in Table 8. Most of them are taken from the Thomson One Banker data base. A lot of variables are calculated from the previous one.
Variables names Description
ACQ_CASH_HLDG Acquirer cash and receivables as of the previous financial report ($mil)
ACQ_CUR_LIAB Acquirer Current Liabilities: All debts that come due in the current year ending on the date of the most current financial information prior to the announcement of the transaction ($mil). ACQ_EBITDA Acquirer EBITDA at last financial report ($mil)
ACQ_LEV Calculated using the ratio of ACQ_NET_DEBT divided by ACQ_NET_DEBT plus ACQ_NET_ASS
($ mil)
ACQ_NET_ASS Acquirer net assets : Total asset at last financial report minus total liabilities ($mil)
ACQ_NET_DEBT Acquirer Net Debt: Calculated by adding the acquirer's straight debt, short-term debt, and preferred equity and subtracting cash and marketable securities as of the date of the most recent financial information prior to the announcement of the transaction ($mil).
ACQ_PC_CASH Acquirer ratio of cash holding (ACQ_CASH_HLDG) divided by transaction value, TRANS_VAL
ACQ_PC_EBITDA Acquirer ratio of EBITDA (ACQ_EBITDA) divided by transaction value, TRANS_VAL
ACQ_PC_PPE Ratio of acquirer’s ACQ_NET_DEBT compared to ACQ_PPE ACQ_PPE Acquirer property, plant, equipments at LTM ($mil)
ACQ_Q ACQ_MKT_VAL_4W divided by ACQ_NET_ASS
ASYMMETRY1 Ratio of relative net assets: TARG_NET_ASS divided by ACQ_NET_ASS
ASYMMETRY2 Ratio of target market value TARG_MKT_VAL divided by acquirer market value 4 week prior ACQ_MKT_VAL_4W ASYMMETRY3 Ratio of transaction value of the target compared with the
accounting value acquirer: TRANS_VAL divided by (ACQ_NET_ASS+ACQ_NET_DEBT)
ASYMMETRY4 Ratio of the target’Q and the acquirer’s Q: TARG_Q/ACQ_Q DESEQ Disequilibrium in the transaction setting: difference between the
percentage of shares sought by the acquirer and the percentage of shares acquired.
DOMESTIC_ACQ Dummy if the target and the acquirer are incorporated in the same country
DUM_CASH Dummy for full cash payment
DUM_CHALLGED_DEAL Dummy challenged deal where a third party launched an offer DUM_EU_ZONE Dummy if acquirer is incorporated in the EU (limited to 7
contries)
DUM_MANDATORY_OFFER Dummy if the acquirer is required by law to acquire the remaining interest in the target
DUM_PRIVATE_ACQ Dummy for privately negotiated e acquisition of a block of shares
DUM_SH Dummy for full share payment
DUM_SUBSIDIARY Dummy is target is a subsidiary
DUM_TARG_FAM_OWN Target is family owned/controlled at the 20% level. This dummy is indicated also if a chairman owns a substantial stake (defined as 20%).
DUM_TOE Dummy for toehold shares of the target held before the transaction. See TOEHOLD.
DUM_WHITE_KNIGT Acquirer is a “white knight” making an friendly offer competing an hostile offer
DUM_HYBRID Dummy for mixed cash-share payment transaction
EBIT_ROA Target EBIT divided by Total Assets for the last 12 months ending on the date of the most current financial information EBITDA_MARGIN Target EBITDA Margin: Ratio of Target EBITDA to Target
Sales for the 12 months ending on the date of the most current financial information prior to the announcement of the transaction.
EBITDA_ROA Ratio of Target EBITDA to Target total assets the 12 months ending on the date of the most current financial information prior to the announcement of the transaction
ENT_VAL Enterprise Value of the target calculated by multiplying the number of actual target shares outstanding (from the most recent balance sheet released prior to the announcement) by the offer price and then by adding the cost to acquire convertible securities,
plus short-term debt, straight debt, and preferred equity minus cash and marketable securities, stated in millions. This data item is for the enterprise value of 100% of the company based on the offering price, regardless of how much was actually acquired in the transaction.
ENTVAL_OV_NET_AS Ratio of Enterprise Value to Net Assets: Enterprise value divided by target net assets as of the date of the most current financial information. The enterprise value of a transaction is calculated by multiplying the number of target actual shares outstanding from its most recent balance sheet by the offer price and then by adding the cost to acquire convertible securities, plus short-term debt, straight debt, and preferred equity minus cash and
marketable securities as of the date of the most recent financial information
ENTVAL_OV_TARG_C Ratio of Enterprise Value to Target Capitalization: Enterprise value is calculated by multiplying the number of actual target shares outstanding by the offer price and then by adding the cost to acquire convertible securities, plus short-term debt, straight debt, and preferred equity minus cash and marketable securities. Capitalization is defined at Short-Term Debt + Long-Term Debt + Shareholder’s Equity as of the date of the most current financial information prior to the announcement.
EQ_VAL Equity Value of the target calculated by multiplying the actual number of target shares outstanding from its most recent balance sheet by the offer price per share plus the cost to acquire
convertible securities, stated in millions. This data item is for the equity value of 100% of the company based on the offering price. EQ_VAL_OV_COM_EQ Ratio of Target Equity Value to Common Equity: Equity value is
calculated by multiplying the actual number of target shares outstanding from its most recent balance sheet by the offer price per share plus the cost to acquire convertibles. Common equity is as of the date of the most current financial information
FRIEN_ATTITUD Attitude of the board of the target company (0: not friendly, 1:yes)
INIT_PR_P_SH Initial offer price ($)
NB_COM_SH_ACQ Nb of common shares acquired (mil)
NB_COM_SH_HELD Number of common shares held by the acquirer prior to 6 months before the announcement date (mil)
NB_COM_SH_OUT Number of shares outstanding (mil)
OFFER_PREMIUM_1D Offer price to target stock price premium 1 day prior announcement
OFFER_PREMIUM_1W Same as previous but 1 week prior OFFER_PREMIUM_4W Same as previous but 4 weeks prior
PERC_ACQ_SH_ISSU Percentage of acquirer’s shares issued: Number of common shares issued in the transaction divided by total number of acquirer’s shares.
PERC_CASH Percentage of cash and assimilated (debt) paid in the transaction PERC_CHGE_FINAL Percentage Change Final Price to Initial Price: Percentage change
from the final price paid per share to the initial price offered per share
PERC_OWN_AFTER Percentage of shares own after transaction
PERC_SEEKING_TO_OWN Percentage of shares acquirer is seeking to own after the transaction. It includes shares held before.
PERC_SH Percentage of the transaction paid by issued shares of the acquirer PERC_SH_ACQ Percentage of shares acquired in transaction
PERC_SOUGHT Percentage of shares sought by acquirer in the transaction PERC_TENDERED Percentage of shares tendered in the tender offer
Premium, expressed as a percentage as of the date of the most current financial information prior to the announcement. PRICE_P_SH Price per share paid by the acquirer
SAME_SECTOR Dummy for same industry codes between target and acquirer. Thomson mid sector codes are used.
TARG_BK_P_SH Target book value per share (LTM, $)
TARG_CASH_HLDG Target cash and marketable securities held ($mil) TARG_COM_EQ Target common equity (book value LTM, $mil)
TARG_DEBT_TO_CAPITAL Target long term debt divided by total capitalization as of the date of the most current financial information. Total capitalization is long term debt plus equity.
TARG_LEV Ratio of 1 minus EQ_VAL divided by ENT_VAL.
TARG_LEV1 see TARG_DEBT_TO_CAPITAL
TARG_MKT_VAL Target Market Value: Calculated by multiplying the total number of target shares outstanding times the target stock price 4 weeks prior to announcement date ($mil)
TARG_MKT_VAL_4W Target market value of shares 4 weeks prior to the announcement. TARG_PC_CASH Ratio of target cash and receivables (TRAG_CASH_HLDG)
divided by transaction value, TRANS_VAL.
TARG_NET_ASS Target Net Assets: Total assets minus total liabilities on the date of most recent financial information ($mil)
TARG_PPE Target property, plant, equipments at LTM ($mi)
TARG_Q see ENTVAL_OV_TARG_CAPITALIZATION
TARG_Q1 see ENTVAL_OV_NET_ASS
TARG_R_D Target research and development expenses (LTM, $mil) TARG_SHP_1D Target share price 1 day prior announcement ($) TARG_SHP_1W Target share price 1 week prior announcement ($) TARG_SHP_4W Target share price 4 weeks prior announcement ($)
TARG_TOTL_ASS Target Total Assets: Total balance sheet assets as of the date of the most current financial information prior to the announcement of the transaction ($mil)
TOEHOLD Percentage of share of the target held before the transaction. Calculated using the difference between PERC_OWN_AFTER minus PERC_SH_ACQD
TRANS_VAL Value of Transaction ($ mil): Total value of consideration paid by the acquirer, excluding fees and expenses.
Table 8 (LTM: Last Twelve Months: financial information is taken from the last reports prior the announcement; source: Thomson and after treatments)
The variables considered to determine the contractual setting of M&As are those mentioned in the literature.
Financing conditions of the acquirer is a first explanation of the choice of means of payment and of the paid price. Cash capacity of the acquirer is identified with ACQ_PC_CASH and ACQ_PC_EBITDA. Raising debt is also a substitute to internal cash payment: It depends on the debt capacity of the acquiring firm. Two variables can be used to proxy it: The collateral value of his assets is ACQ_PC_PPE; it is expressed as the ratio of net debt compared to the acquirer’s plant, property and equipment. A low value shows an important debt capacity
based on fixed assets. The other variable is the acquirer’s financial debt leverage ACQ_LEV. The idea here is simply that highly leveraged firms are more likely to choose equity financing. These variables are drawn from the financial report at the end of the year prior to the deal. Target leverage is also an element that can influence the acquirer capacity to finance the deal. In a situation of success, a low leveraged subsidiary with a good debt capacity will help the initiator to finance the deal using debt and cash. TARG_LEV is a variable which measure the target financial leverage. It is set as the ratio of the equity value of the target valued (using the offer price) divided by the total enterprise value of the target (with equity also taken at the offer price) minus one. This leverage is market valued. We also use TARG_LEV1 which is book valued. The cash situation of the target is also an element which is of interest because a buyer cans self pay an acquisition. We used the variable TARG_PC_CASH. A good cash-flow from the target is also an element which helps to repay debt issued by the initiator when implementing the transaction. We considered the EBIT_ROA ratio
The target Tobin’s Q may be proxied by the ratio of his equity valued at the offer price compared with the book value of equity at the last financial report named ENTVAL_OV_TARG_CAPITALIZATION in table 8 (hereafter TARG_Q). Another proxy is ENTVAL_OV_NET_ASS (labeled by TARG_Q1). The acquirer Tobin’s Q is proxied using the ratio of his market value four weeks before the transaction divide by his equity net asset amount taken from the mast financial report (ACQ_Q). The Q values measure the growth opportunities of the buyer and of the seller. It also proxies a possible market overvaluation of the acquirer’s stock value.
The PERC_ACQ_SH_ISSUED variable is used as a proxy for assessing a risk on the control situation of the acquirer. As in Faccio and Masulis (2005), this variable is set using a 20% control threshold. The control situation of family firms is acknowledged using a dummy DUM_TARG_FAM_OWN. Another dummy takes into account the subsidiary feature of the target (DUM_SUBSIDIARY)
The competitive nature of the takeover has been identified in the literature as a strong argument for cash payments. The idea is simple: cash is a signal of the will of the bidder to acquire a target and deter competition by other potential bidders (Fishman ,1989; Berkovitch and Narayanan, 1990; Cornu and Isakov, 2000) The competitive context can be measured by
a dummy variable (DUM_CHALLGD_DEAL). A dummy for friendly attitude of the target is also used (FRIEN_ATTITUD).
We introduce a variable for toehold (which is set comparing the percentage of share own after the transaction and the percentage acquired through the transaction). The variable TOEHOLD gives the percentage of share owned before. A dummy DUM_TOE is also used when toehold exists. Toeholds may limit asymmetry of information.
The double asymmetry of information using the relative size of the target compared with the size of the bidder. A first measure of asymmetry following Hansen (1987) is the relative net asset values using book data (ASYMMETRY1). Another relative value is set comparing the transaction value spent in the transaction (TRANS_VAL) and the market value of the acquirer valued 4 weeks before (ASSYMMETRY2). The relative size is also measured comparing the total book assets (ASYMMETRY3). We may think that the Q value of each firm is also a proxy of some internal value that is not disclosed in the financial report. Each firm knows better his own growth potential. The relative size of it may be a measure of the internal private information discrepancy between the two (ASYMMETRY4).
The deal characteristics are measured using the premium (OFFER_PREMIUM_1W) or the mean of payment either in the dummy form (DUM_CASH, DUM_SH, DUM_HYBRID) or in percentage (PERC_CASH). We introduce ex ante features of the deal: PERC_SOUGHT may help in comparing if the ex post result is in linked with ex ante goals of the initiator. It compares with PERC_SH_ACQUD after the deal. The DESEQ variable measures the imbalance from the acquirer’s point of view. The institutional context of the deal is acknowledged with a dummy for domestic acquisitions (DOMESTIC_ACQ) or a dummy for intra EU transactions (DUM_EU_ZONE flagging initiators that are incorporated in the EU). The TRANS_VAL value is in absolute size; it is used to see if the absolute amount of the transaction influences its outcome. The economic context of the deal and the purpose of business diversification is followed thought the dummy SAME_SECTOR.
A filtering has been applied to the asymmetry, the leverage, and the Tobin’s Q variables. We eliminate the extreme values below the 1% and above the 99% of the cumulated distribution. We checked the correlation between the variables. Cross correlations between
ACQ_PC_CASH and ACQ_PC_EBITDA, PERC_SOUGHT and DUM_TOE, PERC_ACQ_SH_ISSU and ASYMMETRY1, PERC_ACQ_SH_ISSU and ASYMMETRY3, EBIT_ROA and ASYMMETRY4, TARGET_Q and ASYMMETRY4, ACQ_PC_CASH and TARG_LEV, TARG_Q and EBIT_ROA, PERC_ACQ and TOEHOLD are important (above 0.30). So we disregard the redundant explaining variables.
The proxy of asymmetry of information shows that the bidder is relatively better informed than the target. However the relative Q ratio (ASYMMETRY4) is interesting in the sense that it is above 1. It should not be considered as a good measure in absolute terms because our measures of acquirer’s Q and target’s Q are not perfectly homogenous.
The correlation matrix among information asymmetry measures (see Annex 2) shows that the variables ASYMMETRY1 2 and 3 are highly correlated .ASYMMETRY 2 is populated with a limited number of observations. It is cross correlated with ASYMMETRY3 and ACQ_LEV. We will hereafter only consider either ASYMMETRY1 or ASYMMETR3. The two variables TAR_LEV and TARG_LEV1 are perfectly correlate and redundant. We choose TARG_LEV. The two TARG_Q and TARG_Q1 measures are also highly correlated. We choose the first.
The descriptive statistics of the variable are presented in Annex 1. The Tobin’s Q value of the target and the acquirer are similar (3.6 vs. 3.3). An average toehold of 14% for those firm holding shares (30% of the sample) is evidenced. The acquirer seeks a percentage of 61% of the target’s capital. He gets only 58%, so a 3% disequilibrium is evidenced. Due to previous toeholds, the percentage sought after the transaction is 76% but the acquirer ends the transaction with a cumulated stake of 73%. The average premium is between 25 to 30% depending if it is calculated 1 day or 4 weeks before.
3 Empirical tests
3.1 Methodology and hypotheses
According Faccio and Masulis (2005), « Since we expect both bidder and target preferences to affect the offer price and its form of consideration, we would ideally like to simultaneously estimate equations capturing the two parties’ preferences. However, identification requires
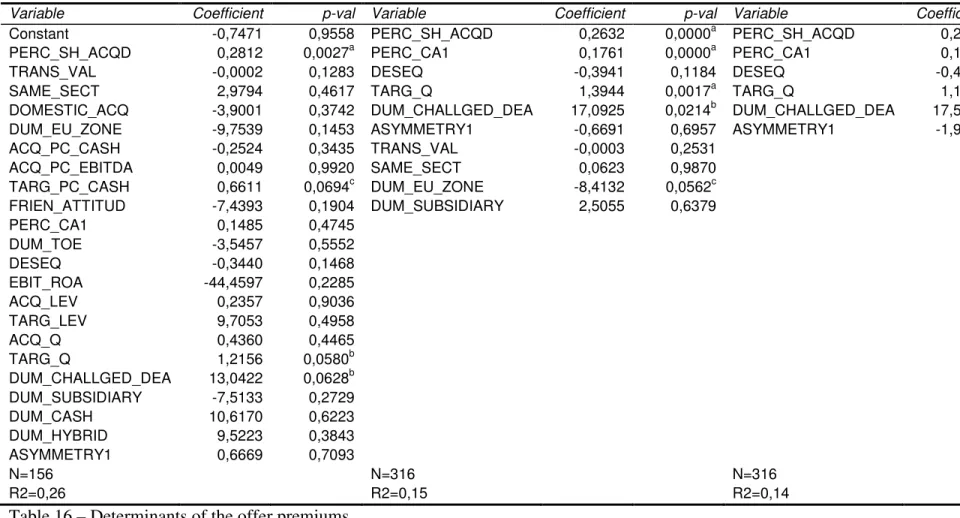
information about a target’s stand alone value relative to its purchase price (takeover premium) as well as the form of payment. Access to information about a target’s stand alone value is unavailable, given that most of these firms are privately held. This precludes estimating the alternative purchase prices conditional on form of payment. As a consequence, we have chosen to estimate a reduced form equation that includes both parties’ preferences as explanatory variables. ». The test we implement considers the transaction characteristics as a whole. Cash payment and premiums are jointly set. We intend to set up a simultaneous equations model explaining the means of payment and the takeover premium. However in a first step we analyze separately the determinants of the payment decision and those of the premium.
The variable conditioning the parameters setting of the contract are mentioned in table 9. We considered a limited sub-sample of variable after taking into account colinearities. The expected relationship of each one versus either the percentage of cash (covering the three situations of full share/mixed/full cash payments) or the premium paid is also mentioned. We introduce a distinction between the three main explicative theories: (i) the financing decision explanation, (ii) the asymmetry of information and contractual setting approach, and (iii) the conditioning by environmental characteristics of the deal.
I
Dependant variable Perc cash Premium
Independent Financial constraint Contractual & AI Environment Financial constraint Contractual & AI Environment PERC_SH_ACQD - TRANS_VAL - - SAME_SECT - DOMESTIC_ACQ - - ACQ_PC_EBITDA + TARG_PC_CASH + + FRIEN_ATTITUD - - - OFFER_PREMIUM_1W + ns ns ns DUM_TOE + + EBIT_ROA + + ACQ_LEV - TARG_LEV - ACQ_Q - + TARG_Q +/- + DUM_CHALLGED_DEA + + PERC_SOUGHT - DUM_SUBSIDIARY + + ASYMMETRY1 - -
DESEQ -
PER_ACQ_SH_ISSU +
PERC_CASH ns ns ns +
Table 9 - Expected sign between the percentages paid in cash and the offer premium and possible determinants
(According to three main theoretical approaches: Financial constraint and limitation theory, asymmetry of information and contract theory, environment and firm characteristics; AI: asymmetry of information)
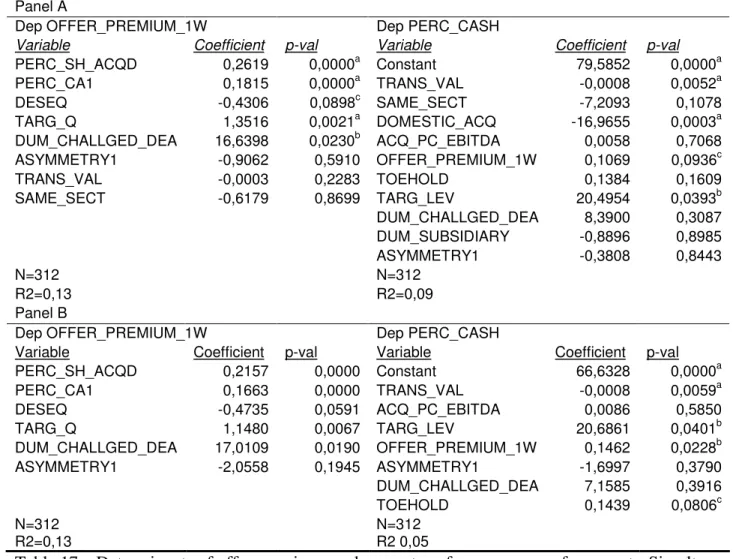
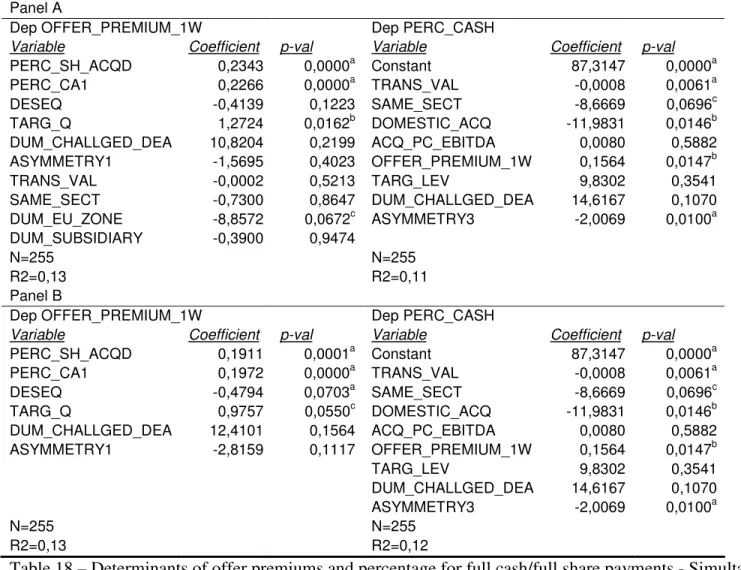
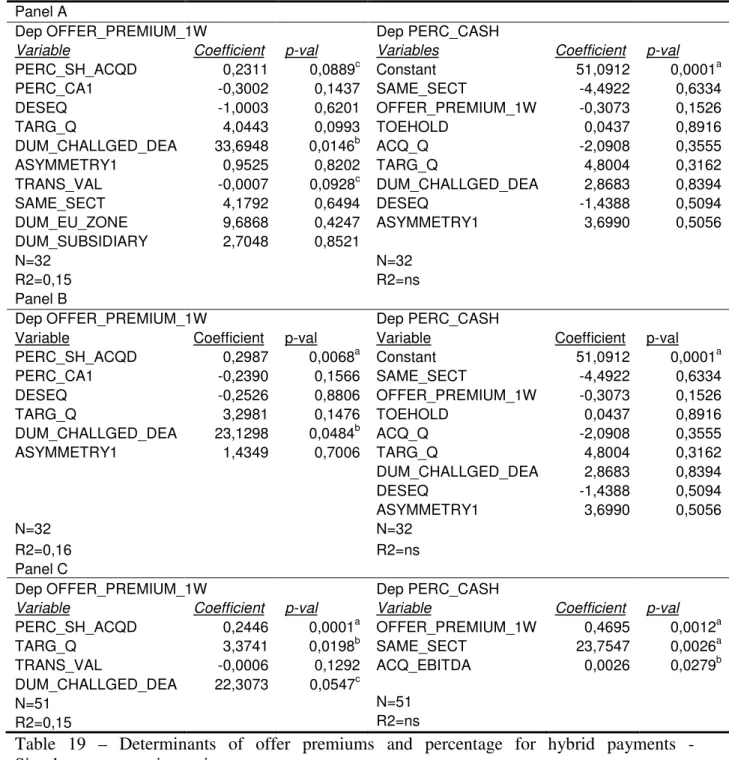
The percentage of cash in a financial constraint approach is positively linked with acquirer’s cash holding and Ebitda, and with the target’s margin. It is negatively linked with leverage, with the absolute size of the transaction and the percentage of acquired shares. The overvaluation hypothesis introduces a negative link when the acquirer wants to time the stock market to finance the transaction. The asymmetry of information introduces a risk sharing preference. The existence of a toehold will favor share payment in the mix. The toehold is a driver to access to better information and to reduce the asymmetry problem. The bidder will pay more in shares when he enjoys better information. This is not intuitive. Same results are got with the variables used as device to reduce the asymmetry of information. The existence of toehold or the subsidiary status of a target, are viewed as a device to reduce the asymmetry and the acquirer does not need to issue shares for risk-sharing purpose. Similarly, the relationship with the absence of economic diversification is negative. The premium is linked in the contractual setting with the means of payment. At equilibrium, for hybrid payments, the acquirer may be willing to pay a slightly higher premium (i.e. to abandon a higher part of the M&A creation of value to the seller) if he can seize a larger part of the future profits by paying by cash to avoid dilution. The target’s shareholders capture the actual value of future gains by accepting more immediate cash. The environmental features are known: cross border and challenged deals are more largely paid in cash.
Looking at the premium, liquid and profitable firms can pay more. The same may be true if they have large Tobin’s Q to time the market and issue largely priced shares. The asymmetry of information approach says that asymmetry of information is a risk which is balanced by lower prices and premiums. Targets which are subsidiaries, or where toehold stakes held by the acquirer exist, are more transparent to the buyer and can be paid more. The same is true if the opportunity growths of the target are large. The percentage of cash has a trade-off relationship with the premium paid. The context of the deal will also influence the paid price with an increase if it is competitive or if it is a cross border deal. Similarly for characteristics
of the firms: for instance when the size of the target is large, the bidder will pay more in shares.
The DESEQ variable takes into account a possibility that the final terms are not equilibrium terms from the buyer’s point of view. It is the difference between the percentage of shares sought in the deal and the percentage effectively bought. A positive discrepancy means that, to his opinion, he should have paid more to get a higher stake of capital. So we expect a negative sign.
The acquirer’s Q ratio is a double face variable: it can signal an overvalued share value and a possibility to time the market by the bidder’s managers. But it may also signal good future perspectives of the firm (Martin, 1996). Former shareholders may not want to share growth opportunities with new blockholders. To avoid dilution of the former shareholder’s, the payment in shares to new shareholders is voluntarily limited. Financial constraints or limitation may explain equity payment and financing: this will occur when the percentage of share acquired is important, or when the size of the deal is important.
..
3.2 Determinants of the payment decision
The mean of payment decision may be analyzed as a continuum between 0 and 100% cash payment. This approach views the determinants as playing a continuous role to explain the cash percentage. Traditionally a linear model will imply that a significant given determinant explains at the same time a full cash, a full equity or a mixed payment. The hypothesis of a unique set of determinants over the scope of cash percentage payment is very strong and questionable. The alternative hypothesis is that there are possibly three different regimes of means of payment, each one explaining either the full-cash, or the full equity or the mixed equity payment. The idea of three regimes is based on the idea that the full-equity and the full-cash payments are « corner solutions » for a rational investor (La Bruslerie, 2010). Even a methodology of Tobit regression, as the one implemented by Faccio and Masulis (2005), relies one the hypothesis of a unique set of determinants. It only takes into account the fact that the dependant variable (i.e. the percentage of cash payment) is constrained. So the distribution of errors hypothesized in a simple Probit or Logit model may be not satisfied.
However a Tobit model does not allow for the possibility of different rationales in choosing the means of payment.
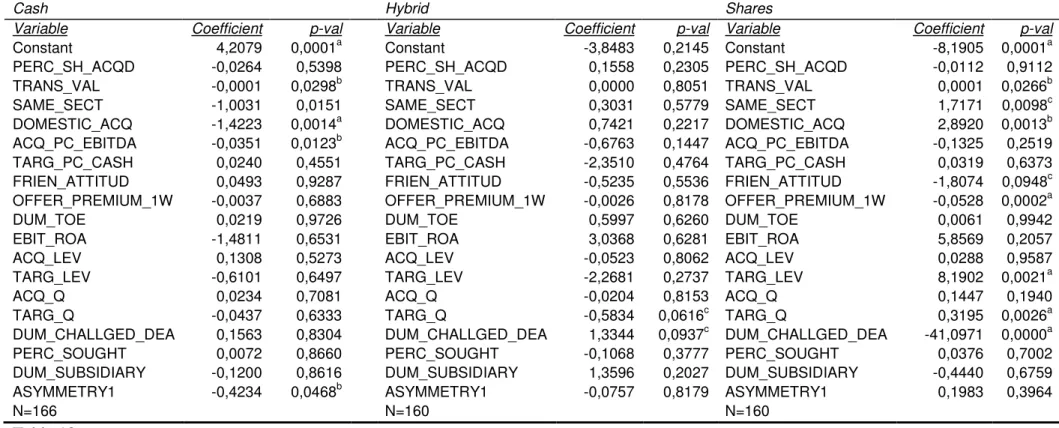
In a first step we will regress globally the whole observations. The regressors are taken from the list of 18 non cross correlated variables we selected. We used first a Probit analysis to identify the variable influencing the decision of each mean of payment against the other two (see Table 10)
INSERT TABLE 10
The absolute size of the transaction favors share payment. The economic diversification is positively linked with share payment and negatively with cash. Domestic deals are more prone to cash exchange. Conversely, cross border are more paid with cash; cash payments are negatively related to the relative size of the cash flows at the acquirer’s level. All these results confirm the theories and what is expected, except the last one.
The probability of share payments are negatively linked with the offer premium and cash payment is also negatively linked with the information asymmetry. This is in line with the contractual analysis of M&A deals and with the role of information asymmetry in the equilibrium contract setting. A challenged deal results in a more important probability to abandon share payment and to use cash in mixed payment. The above results come from opposing one choice against the other two; but the alternative is not sound. Can we say that, when choosing a hybrid payment and rejecting full cash or full share payments, the acquirer is indifferent between the last two? We turn to analyze pure alternative choices.
The pure alternative choice is based on a Probit analysis of a mean of payment against another one. With three means of payment, it gives three Probit analyses. Table 11 confirms that a larger offer premium increases the possibility of a hybrid or a cash payment. Asymmetry variable is not significant, but when the target is a subsidiary or when the acquirer has a toehold stake, the probability of a hybrid payment increases compared with a full share one. It means than the lower asymmetry of information linked with such a situation does not result in a risk sharing full share scheme. The presence of an important internal cash flow favors cash payment. The challenged deals are more frequently paid in cash. As Martynova and Renneboog (2009), we do not find a significant or consistent relationship between the bidder's
financial condition (e.g. leverage) and the means of payment. A leveraged target makes the deal more frequently paid with shares or hybrid payments. The explanation here should be set in conjunction with the no relevance of acquirer’s debt leverage. The latter has a good financial structure before the deal, and the new financial structure of the group after the merger should not be hit by a larger debt linked with cash payment. This rationale impacts the deal when it implies merging with a relatively indebted target. So the acquisition of a leveraged target is more paid with shares to limit the side effect of the acquisition on the acquirer’s own leverage. This explanation goes along with dynamic debt capacity limitation which occasionally will stress the cash payment scheme.
INSERT TABLE 11
The acquirer’s Q is positively linked with share payment, what is in line with the stock overvaluation explanation. It does not support the idea of privately known growth opportunities at the acquirer’s level which would lead him to prefer cash payments (Martin, 1996). The target’s Q ratio is significant against cash payment. Good opportunity growths at the target’s level may favor full or partial payment with shares. The target’s Q is significant and goes with the probability to have a full equity payment. This is in line with what was expected since the acquirer is facing an information risk about the opportunity growth of the target. A large part of the latter’s value is not linked with accounted assets in the balance sheet. Therefore, a higher exposure to risky information on the off-balance sheet value may push the acquirer to cover that risk using share payment.
-) Robustness checks over the whole sample
We tried to use an ordered Logit model where the dependent variable equal 2 in full cash, 1 in hybrid, and 0 in full equity payment situations (as in Faccio and Masulis, 2005). We also tried to use a multinomial Logit test of the three cases in the spirit of Martynova and Renneboog (2009). However the structure of the data is not conclusive and no convergent results are obtained with the full set of explaining variables. A restricted ordered Logit model with 3 ordinal dependant variable works well with 5 dependant variables plus a constant. Four out of five are significant. However this model introduces a unique model value and uses cuts to create three classes. A restricted multinomial Logit is also run. It tests jointly the difference between all-cash and hybrid payments and the difference between cash and all-share
payments. The variables are not significant in the first alternative case but are with regard to the cash/share payment alternative. We still have a probability to choose cash payment increasing with the offer premium and the target leverage and a probability of choosing share payment increasing with the information asymmetry and the transaction absolute value (see table 12). This result illustrates that full cash and full share are opposite corner solutions (Carleton et al., 1983). At the same time the variable explaining the choice between cash and hybrid payments are not the same because none of the previous ones are significant. It supports the idea that hybrid payment choice follows a different rationale and is explained by other variables. The overall regime of payment choice is a pure alternative between these two schemes.
Ordered Logit Multinomial
Cash vs. Hybrid
Variable Coefficient p-val Variable Coefficient p-val
Constant 1,6488 0,0000a Constant -0,1998 0,7886 TRANS_VAL 0,0000 0,0313b TRANS_VAL 0,0000 0,4542 TARG_LEV 1,3210 0,0547c TARG_LEV 1,2509 0,5662 OFFER_PREMIUM_1W 0,0101 0,0457b OFFER_PREMIUM_1W 0,0193 0,3102 ACQ_Q 0,0292 0,4495 ACQ_Q 0,0054 0,9703 ASYMMETRY1 -0,5641 0,0001a ASYMMETRY1 -0,2361 0,5068
Cut(1) -0,0624 0,7118 Cash vs. Shares
Cut(2) 1,0000 0,0000a Constant 1,3898 0,0000a TRANS_VAL -0,0001 0,0812c TARG_LEV 1,9682 0,0347b OFFER_PREMIUM_1W 0,0192 0,0075a ACQ_Q 0,0290 0,5985 ASYMMETRY1 -0,7349 0,0002a N=221 Log Likelihood=-178.68 N =221 Log likelihood=-176,13
Table 12 - Determinants of ordinal choices between cash, hybrid and shares payments
(Ordered values: Cash(2), Hybrid(1), Shares(0); ordered Logit and multinomial Logit estimates; cut are estimated limits between classes; multinomial estimates of cash vs. hybrid alternate choice and cash vs. shares choice; robust covariance estimate are used to adjust for heteroscedasticity; variables definition: see Table 8; European M&A transactions; 2000-2010; a: 1% significance level; b: 5% significance level; c: 10% significance level)
The above Logit and Probit models do not see the means of payment as a continuum but see 3 ordered classes. We now turn to the percentage of cash as dependant variable covering the continuum from 0 to 100% data. Using Tobit analysis may appear to take into account the truncated nature or the percentage of cash payment. The truncation applies if the independent variable observations are truncated for any reasons versus their real underlying values. It is not the case here where the observations are not truncated compared with the underlying