FINANCIAL DEVELOPMENT, INTERNATIONAL TRADE AND WELFARE
Michel Blanchard∗
INALCO/CPEI and University of Paris Dauphine-EURIsCO, Paris, France. Frédéric Peltrault
University of Paris Dauphine-EURIsCO, Paris, France. Abstract
Differences between domestic financial systems can lead to international trade. A country with relatively developed or decentralized financial systems will export innovative commodities while a country with less developed and centralized financial systems will export traditional commodities. Trade is always welfare improving before the resolution of uncertainty but the country with the more risk averse financial system and the world as a whole can be worse off with trade after the resolution of uncertainty. A temporary protection can be welfare improving for such risk averse countries which are often the less developed ones.
Keywords: Financial systems; Free Trade Commitment; Trade Losses; Idiosyncratic Risk,
Risk Aversion.
JEL Classification: G3 ; F 11; F 13
∗ Corresponding Author : CPEI /INALCO, centre dauphine, place du maréchal de Lattre de Tassigny, 75775 Paris Cedex 16.
1 INTRODUCTION
King and Levine (1993) confirm the Schumpeterian idea that financial institutions are important because they finance entrepreneurs for their introduction of innovative activities. Therefore, “Financial sector taxes are equivalent to taxes on innovative activities, since they reduce the net returns that financial intermediaries gain from financing successful entrepreneurs, it thereby impedes innovative activity”1. That is, the financial development, as revealed by the level of credit and the size of the capital market, encourages innovative activities.
Another important feature is that stock markets enable individuals to diversify away idiosyncratic risk of individual projects. As quoted by Saint-Paul (1992) “capital markets make possible the spreading of risk through financial diversification (…). Financial markets allow riskier technologies”. Therefore, without banks or with imperfects financial markets, choices of individuals are affected by their degree of risk aversion.
Developing countries are mainly concerned by these problems. Greenwood and Jovanovic (1990) model explains how income levels can affect the structure of the financial system. Financial intermediaries appear only with the increasing of national income. Consequently, poor countries can be trapped in producing traditional commodities while richer countries can produce innovative commodities.
But the structure of the financial system is also important for developed countries as well since different types of financial systems provide different incentives for investment and firms’ governance. For instance, the UK and US market oriented systems, with dispersed shareholdings, is often opposed to the Continental European and Japanese system where banks and large dominant shareholders play a dominant role. Then “Continental European and Japanese systems are thought to be characterized by tem relations which encourage long-term, primarily bank, finance. On the other hand, the UK and the US are regarded as benefiting from high levels of equity risk capital.”2
A theoretical argument is developed by Qian and Xu (1995). The authors oppose the soft budgeting constraints of centralized financial systems and the hard budgeting constraints of decentralized finance. Their model is relevant to understand the impact of various financial institutions. They show that R&D in small firms financed by venture capitalists enjoys an
1King R., Levine R. (1993). 2 Mayer C. (1998).
advantage in highly uncertain innovative projects, while R&D in large corporations has an advantage in less uncertain projects: centralized, large firms are more prudent.
So, the level of financial development as well as the structure of the financial system matter regarding the incentives to innovate. More precisely, developed finance systems, small firms, and market oriented finance encourages ceteris paribus risk taking and then innovative activities which are riskier and more uncertain than traditional one (Schumpeter (1942)). Hence it is assumed in our model that each country has its proper attitude towards risk depending on the level of development and the characteristics of its financial system3.
In this paper, we introduce international trade between such different countries and we focus on the resulting welfare consequences. The theory of the second best developed by Lancaster and Lipsey (1956) and Bhagwati (1971) is helpful to understand the normative consequence of free trade. Actually, the theory of the second best predicts that countries can be worse with trade when autarky equilibrium is not Pareto optimal. Grossman and Helpman (1991) have already studied the link between innovation and trade. They showed that some countries will export traditional commodities while others will export innovative commodities. Moreover they suggest that the opening to trade is not always welfare increasing. In their model, the distortion comes from dynamic increasing returns.
In this paper, autarky equilibrium is not Pareto optimal because imperfect financial markets imply a suboptimal production of innovative commodities. This distortion is increasing with the level of risk aversion in the country. Contrary to Newbery and Stiglitz (1984) and Shy (1988), we assume that risk is idiosyncratic to each manager rather than global. This assumption allows us to focus on entrepreneurial and personal dimension of innovative activities. Moreover, it also permits to analyse, in static comparative model, the welfare consequences of international trade from an ex ante and an ex post perspectives.
Section 2 defines the microeconomic foundations of innovative choice, section 3 recalls some salient stylised facts about finance and innovation. Section 4 develops the model and its results. Section 5 concludes.
3 Of course, other institutional characteristics certainly matter such as administrative barriers or legal consequences of failure which can deter managers to undertake risky businesses.
2 MICROECONOMIC FOUNDATIONS OF INNOVATIVE CHOICE
The link between macroeconomic financial systems and the individual managerial microeconomic decision to invest in innovative activities can be captured by the concept of entrepreneur.
According to Schumpeter (1911), the entrepreneur breaks the stationary state by introducing innovations into the economic system. But, motivation of entrepreneurs is not pecuniary but glory. Entrepreneur is a kind of romantic and irrational hero. So, microeconomic foundations of his behavior are irrelevant. For Frank Knight (1921), entrepreneur is rational. Uncertainty bearing is the true function of his entrepreneur. Then a manager becomes an entrepreneur if he chooses an uncertain activity rather than a routine one. To make up his mind, a manager has to anticipate the price of the final product which depends on the decision of other managers and on the demand conditions. Then for Knight, the level of entrepreneurship is resulting from a rational decision making process in a context of true uncertainty.
In this paper we build the decision to innovate on microeconomic foundations in a context of risk rather than true uncertainty (in the Knight’s sense). We consider that a manager has to choose between a risky activity and a routine one. He compares the expected gains of each alternative following the Von Neumann-Morgenstern decision theory. By definition, managers become entrepreneurs when they choose the innovative activity.
It seems reasonable to assume that entrepreneurs have lower risk aversion than non entrepreneurs. The question is to examine if empirical studies support this statement. Consider that entrepreneurs invest only a part of their wealth in their business which is very risky compared to other equities. Then if entrepreneurs were as risk averse as others, they should invest the remainder of their wealth in less risky assets. For Gentry and Hubbard (2001), this is not the case so entrepreneurs seem to have lower risk aversion.
Another salient characteristic of entrepreneurs is documented by Moskovitz and Vissing-Jorgensen (2002) who point out that entrepreneurial investment is very concentrated. In fact, they find that “about 75% of all private equity is owned by household for whom it constitutes at least 50% of their net total worth”. This lack of diversification is very puzzling because the return of entrepreneurship tends to be low when controlling for risk. Lower risk-aversion, overoptimism, non-pecuniary benefits partly explain why entrepreneurs accept a low return compared to risk.
In this paper, we connect the microeconomic entrepreneurial foundations of an innovative choice and the macroeconomic domestic financial system by the manager’s risk aversion. We
capture institutional differences by assuming a country’s specific measure of constant risk relative aversion of its managers. Within one given country, all managers have the same measure of risk aversion depending on the domestic financial system of the country in which they operate. Between countries, risk aversion measures can be different: the more the domestic financial system is risk friendly, the more the countries’ managers have, ceteris paribus, a small measure of their constant risk relative aversion.
Managers of one country are assumed to be more risk averse than the managers of the other country. This is consistent with empirical study of Nakagawa and Shimizo (1999) which shows that Japan’s households are two or three times as risk averse as those in the United States: that is an average relative risk aversion around 2 in USA and 6 in Japan since 60’s years to 90’s.
3 STYLIZED FACTS
Domestic financial systems have different characteristics between countries. For instance, in Japan, banks play a crucial role since they are closely linked with firms. The firms which are members of a keiretsu are both financed and monitored by their main bank4. The American
firms prefer the financial markets when they seek external financing.5 So, stock markets are
well developed, and pension funds are important actors. The monitoring is less efficient in such a market oriented financial system, but the budgeting constraint is surely stronger than in a bank oriented system.
So, following the arguments of Qian and Xu (1995), risky innovations will be more promoted is the decentralized system. Start-up firms and innovative projects will be numerous and market will only select and refinance the more efficient ones. In the bank centralized system, the weaker budgeting constraint prevents to stop bad firms or bad projects. So, in order to avoid this difficulty to stop inefficient projects, the famous “Concord Effect”, firms are more prudent in the screening and financing of innovative projects.
So, following those theoretical predictions, the stylized facts should confirm those predictions. Prior to this verification, some data and indicators are needed.
4 Aoki and Patrick (1994)
The data
Financial system Index
In order to compare nations, it is useful to build a quantitative measure of the financial systems.
Block (2002), have build, by using principle components analysis, a composite index incorporating several financial structure variables: bank concentration, an index of accounting standards, ownership concentration, the ratio of assets of deposit money bank over GDP, the stock market capitalization, the availability of company information.
This composite index reveals the diversity in the size and the character of national financial systems. The financial systems which are well developed and market oriented are called by Block (2002) the outsider systems (high value of the index). The poorly developed financial systems and bank oriented ones are called the insider systems. Outsider systems, (small value of the index) are characterized by lower bank and ownership concentration as well as better accounting standards and greater stock market orientation relative to insider systems. Figure 1 shows the values of the Outsider/Insider index for the 17 OECD countries.
Figure 1. Insider and outsider system
Source : Block (2002), page 32.
We verify that, US and UK, countries who have a market oriented financial market are ranked on the top. The case of Japan is less intuitive but the share of financial markets in the global source of funds of firms has grown rapidly during the 90’s.
According to Mayer (1998), countries characterized by the continental system of finance, that is, Germany, Italy, are revealed to be endowed with insider systems. France seems to be in an intermediate situation.
If our intuition is correct, countries endowed with relative risk friendly institutions (outsider systems) must have an higher proportion of innovations than countries endowed with relative risk averse institutions (insider systems).
For illustration, we must find an index of innovative activities. Innovation Index
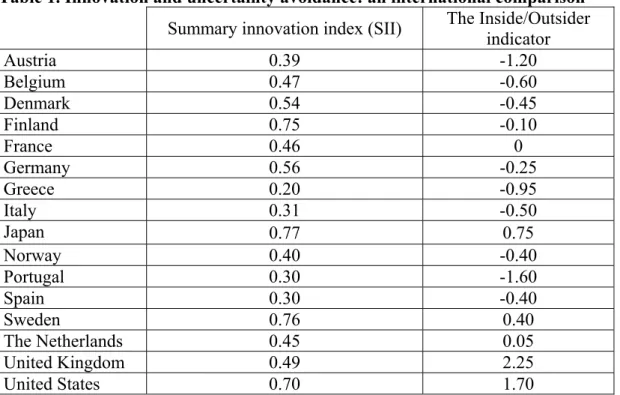
The Summary Innovation Index (SII) proposed by the European Commission, in the European Innovation Scoreboard (See Bugnot (2004)), is useful for our purpose.
Table 1. Innovation and uncertainty avoidance: an international comparison Summary innovation index (SII) The Inside/Outsider
indicator Austria 0.39 -1.20 Belgium 0.47 -0.60 Denmark 0.54 -0.45 Finland 0.75 -0.10 France 0.46 0 Germany 0.56 -0.25 Greece 0.20 -0.95 Italy 0.31 -0.50 Japan 0.77 0.75 Norway 0.40 -0.40 Portugal 0.30 -1.60 Spain 0.30 -0.40 Sweden 0.76 0.40 The Netherlands 0.45 0.05 United Kingdom 0.49 2.25 United States 0.70 1.70
Source: The Summary Innovation Index is provided by the European Innovation Scoreboard (2004), page 9. The Insider/Outsider indicator comes from Block (2002), page 32.
Japan, Finland, Sweden and US are clearly on the top of innovative countries and (Except Finland) have outsider systems. Another group of countries, Belgium, Denmark, France, Germany, Norway, The Netherlands, UK, can be ranked as intermediate countries regarding
innovative activities. They are also intermediate regarding their financial systems (except UK). Other countries, endowed with very insider systems, are poor innovators.
But, the link between financial system and innovation is indirect. First, Financial system biases the attitudes of managers and firms towards risk and uncertainty. Second, the different attitudes towards uncertainty lead to different level of innovation inside countries. Consequently, we need an index of the different attitude towards uncertainty in countries. Uncertainty Avoidance Index
A way to estimate the attitude towards uncertainty of countries can be found in the empirical study of Hofstede (2001) regarding the cultural differences between countries. Hofstede defines the cultural attitude towards uncertainty with the Uncertainty Avoidance Index. Countries are ranked regarding their UAI: a high value of the index corresponds to high uncertainty avoidance.
UAI can be influenced by the structure and level of the financial system. But UAI can also be influenced by psychological, cultural or institutional characteristics. We use UAI as an index of reluctance to undertake innovative activities.
Table 2. Innovation and uncertainty avoidance: an international comparison Summary innovation index (SII) uncertainty avoidance
Austria 0,39 70 Belgium 0,47 94 Denmark 0,54 23 Finland 0,75 59 France 0,46 86 Germany 0,56 65 Greece 0,20 112 Ireland 0,44 35 Italy 0,31 75 Japan 0,77 92 Norway 0,40 50 Spain 0,30 86 Sweden 0,76 29 Switzerland 0,68 58 The Netherlands 0,45 53 Turkey 0,05 85 United Kingdom 0,49 35 United States 0,70 46
Source: The Summary Innovation Index is provided by the European Innovation Scoreboard (2004), page 9. The uncertainty avoidance index comes from Hofstede (2001), page 151.
If our intuition is correct, the more the countries avoid uncertainty, the less they should innovate. SSI and UAI are presented in the following table 2. The well known outsider countries UK, US, Sweden, have a low Uncertainty Aversion Index while Spain, Italy, Austria have a strong UAI. France and Japan are more averse than their financial system can suggest but, cultural and historical features can also influence their aversion.
Are the intuitions correct?
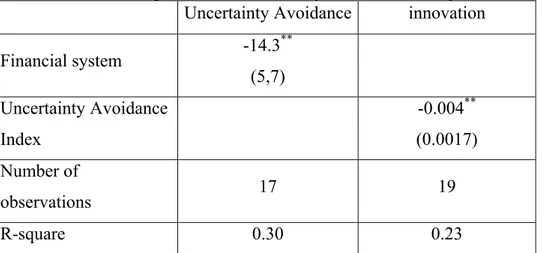
Ordinary Least Squares regressions show that, first, the uncertainty avoidance index is decreasing with the financial system index and, second, the summary innovation index is decreasing with the uncertainty avoidance index.
Table 2. Relationship between financial system, uncertainty avoidance and innovation Uncertainty Avoidance innovation
Financial system -14.3 ** (5,7) Uncertainty Avoidance Index -0.004** (0.0017) Number of observations 17 19 R-square 0.30 0.23
Dependent variables are reported in columns.
Standard errors are reported below the coefficient estimates. Intercept are not reported for ease of presentation. ** define 5 per cent significance level.
Even though regressions are significant at 5% significant level, we must be cautious with these results since the sample of countries is limited. Nevertheless, our intuition that financial systems features influence attitudes towards risk and consequently biases the innovative behaviour inside countries seems correct.
International specialization under free trade
From international trade point of view, the question is to examine the revealed comparative advantages regarding patterns of financial systems. Countries with outsider financial systems should exhibit a revealed comparative advantage in the innovative commodities. Block (2002)
obtains some interesting results, when innovative commodities exportations are measured by outputs of technological sectors. In his econometric study, bank and ownership concentration are associated negatively with export performance in sectors with high science inputs.
These stylised facts seem to corroborate the possibility of an influence of financial systems on the trade patterns.
4 THE MODEL
Our theoretical analysis confirms the previous stylised facts. In the model, the differences between financial systems are captured by differences between the managers’ coefficient of risk aversion between countries. Moreover, the model permits to examine the welfare consequences of international trade grounded on such institutional determinants.
4.1 The framework
Let us assume two countries M, the More risk averse and L, the Less risk averse. So M has a risk averse, poorly developed, insider financial system while L has a risk friendly, well developed, market oriented, an outsider financial system.
As in Kihlstrom and Laffont (1979), each country has a continuum of risk averse managers indexed on the interval [0,1]. Managers have to choose exclusively between two production projects C and R. Project C is certain and provides one unit of (traditional) commodity C. Project R is risky and provides one unit of (innovative) commodity R with probability θ, and k<1 unit of R with probability 1-θ. So expected production of R is: µ=θ+(1−θ)k.
The risk is idiosyncratic to each manager’s project rather than global. Though risk is idiosyncratic, aggregate uncertainty is cancelled by the application of the law of large numbers6.
Within one given country, managers have the same Constant Relative Risk Aversion measure affecting their indirect ex ante utility function. But, the risk aversion levels of managers differ between countries. LetαM; be the CRRA of managers in M and L we assume that: αL αM> . αL Commodity C is the numéraire so p refers to the relative price of commodity R in terms of C. Aggregate demand functions for the two commodities have unitary price and income
6 As quoted by Judd (1985), there are some difficulties with the application of the law of large numbers in a continuum. However, we follow here the tradition of economic literature, as the seminal works of Diamond and Dybvig (1983) or Lucas and Prescott (1974), which explicitly or implicitly avoid this difficulty.
elasticity and b denotes the share of income devoted to the consumption of commodity R; so, j Cj (1 b)y d = − and p by
dRj = j where y is the aggregate income of country J. j
Welfare analysis is based on two criteria, an ex ante criterion (before the resolution of uncertainty) and an ex post criterion (after the resolution of uncertainty). This distinction is useful to explain why a country can regret ex post a free trade commitment based on the ex ante welfare analysis.
Before the resolution of uncertainty, the aggregate welfare comes from the indirect ex ante utility function which depends on the risk aversion measure of managers and on the expected income y~ and p.
The indirect ex ante utility function V=V(~y,p)is quite the same as in Newbery and Stiglitz (1984) and Shy (1988): (1) α α − − = − − − 1 ] ~ ) 1 ( [bb b1 byp b1 V , for α ≠1 ) ln( ) ~ ln( ) 1 )ln( 1 ( lnb b b b y b p b V= + − − + − , for α =1
Moreover, an ex post welfare analysis can be evaluate with idiosyncratic risk. After the resolution of uncertainty, the aggregate welfare depends on yj the effective income of country J. Then ex post welfare of country J is:
(2) b j b b j b b y p U = (1− )1− − .
4.2. The autarky equilibrium
General equilibrium is reached when the risky commodity market clears. At the equilibrium price, the amount of risky commodity demanded by all agents equals the amount supplied (ex post) by managers who have chosen (ex ante) the risky process.
Since commodity C is the numéraire, the expected income of entrepreneurs is p whereas µ the income of managers is, of course, certain and equal to 1. Let n be the number of managers who choose the risky project and let call them the entrepreneurs. The number of managers who choose the certain project is 1−n.
Aggregate income is then: y=pµn+1−n
As risk is idiosyncratic, the law of large numbers holds and so global ex post supply is certain and equal to µ×n. The global demand is
p y
b . Then equalization of global supply and global demand of the risky commodity gives the market clearing price p:
(3)
[
p n n]
p b n= µ +1− µ ⇔ nn b b p= − ×1µ− 1Managers choose between R versus C by maximizing their indirect ex ante utility function. Hence, for a given p , they maximize their expected income following Von Neumann and Morgenstern (VNM) expected utility theory. The certain projects delivers always VC=1 but the VNM expected income of the uncertain project is V =θp1−α+(1−θ)(kp)1−α
U .
Decision rule
•A given manager chooses the project C if and only if VC> ; VU •A given manager chooses the project U if and only if VU> ; VC •A given manager is indifferent between both projects if VU= . VC
But, as managers are all identical inside a country, it implies that the equilibrium (ex post) market clearing price is reached when identical managers are indifferent between both projects, that is:
(4) θp1−α+(1−θ)(kp)1−α=1 ⇔ p=
[
θ+(1−θ)k1−α]
α1−1Since managers are risk averse, p is always superior to µ1 which holds for α=0. Moreover, (4) ensures that p is an increasing function of α .
The equilibrium level of entrepreneurship n is given by (3) and (4): a (5)
[
k]
b b b na + − − + = − − (1 ) ) 1 ( θ 1 11µ θ α αFrom (5) we can verify that the level of entrepreneurship in autarky is a decreasing function of the measure of risk aversion. Recall that, in this paper, the coefficient of risk aversion is postulated to be a decreasing function of the level of development of financial markets. It follows that entrepreneurship, that is innovative activities are an increasing function of the financial development. This is consistent with King and Levine (1993) and Saint-Paul (1992) results and with the previously mentioned stylised facts.
4.3. The free trade equilibrium
We verify from (5) that n is a decreasing function of the risk aversion measure α . So it follows that M, the more risk averse country has a lower nin autarky than L. From (4), it follows that the autarky price in M is higher than the autarky price in L. So, the law of comparative advantages lead to international trade. Hence, the opening of trade will lead country L to export the risky commodity R, while the country M will export the certain commodity C. Let denote p the free trade price, with complete specialization we have: ∗
(6) µ ) 1 ( bb p∗= −
Global ex post supply of R in free trade with complete specialization is sr=µ while global demand is = +∗ = ∗∗+ p p b p y y b d L M
R ( ) (µ 1).With sr= , we obtain equation (6). dr
Moreover, specializations can be either complete or incomplete depending on the value of b, L p and p . From (6), M ∗ ∗ ∗ + = ⇔ − = p p b b b p µ µµ 1 ) 1
( , we deduct the three following cases: • Specialization of country L is incomplete when (7) p∗=pL ⇔
L L p p b µ µ + ≤ 1 • Specialization of country M is incomplete when (8) p∗=pM ⇔
M M p p b µ µ + ≥ 1 • Specializations are complete when: (9) pL<p∗<pM ⇔
M M L L p p b p p µ µ µ µ + < < + 1 1 Notice that in (9), p p b p p > ⇔ > +µµ 1 * . As p is always superior to µ1 then it implies b>21
So, the differences between financial systems of countries can lead to different attitudes towards risk and consequently innovations and entrepreneurship. International trade leads to specializations. The more risk averse country, endowed with a weak financial system (or bank oriented one) will export the traditional and certain commodity whereas the less risk averse country, endowed with a well developed financial system (or market oriented one), will export the risky commodity.
4.4. The effect of free trade on ex ante welfare
The consequence of such a trade, grounded on differences between financial systems is now examined relatively to its welfare consequences.
From an ex ante perspective, before the resolution of uncertainty, we compare aggregate indirect ex ante utility function under autarky and free trade.
Proposition 1: Both countries are indifferent or better off under free trade from an ex ante welfare analysis.
Proof:
In autarky, the managers of the country M are indifferent between projects. So, their expected income is 1. Then, if specialization is complete, M is always better off ex ante with trade: its global income is still 1, because all managers of M produce the certain commodity and consumers of the country M have a positive price effect since the risky commodity becomes cheaper.
For L, gain from trade can be easily shown:
[
]
[
]
(1 ) ) 1 ( 1 1 1 1 ) 1 ( ) 1 ( α α α α α α θ θ θ θ − ∗ − − − − − ∗ ∗ × − + − + = b b a a a L L p p k p k p V V then 1 ) 1 )( 1 ( ) 1 )( 1 ( > = − − − − ∗ ∗ b a b a J J p p VV α αWhen specialization is incomplete for a country, this country is indifferent between autarky and trade because nor its income neither its price change with the opening of trade. The other country is always better off , the proof is identical to that of the complete specialization case. Before the resolution of uncertainty, trade is expected to improve welfare because the differences in the risk aversion act as if technologies were not identical between countries. Hence, ex ante welfare increases thanks to traditional gains from specialization and managers would clearly lobby in favour of a free trade commitment.
4.5. The effect of free trade on ex post welfare
Risk aversion induces a distortion in the allocation of managers between sectors in autarky. Without risk aversion, or with perfect insurance markets, the allocation between sectors comes from the tastes of consumers: the share b of managers devoted to the production of risky commodity. This first-best Pareto optimum is achieved when managers are risk neutral. Hence, risk aversion leads to a share of managers devoted to the risky sector different from b. With imperfects financial markets, choices of individuals are affected by their risk aversion
(Saint-Paul (1992)). So, imperfection of markets for risk hedging leads to a sub-optimal allocation of managers in autarky. Then, in the spirit of the theory of second-best of Lipsey and Lancaster (1956), the salient question is to examine if free trade can correct this autarky distortion or not, the
After the resolution of uncertainty, i.e. with ex post welfare analysis, the effective levels of consumption and welfare are revealed and the attitude towards risk doesn’t matter anymore.
b j b b j b b y p U = (1− )1− −
Proposition 2: From an ex post welfare analysis, the less risk averse country is always better off with trade. Proof: See appendix A
Proposition 3: From an ex post welfare analysis, the more risk averse country can be worse off with trade. Proof: See appendix B
Proposition 4: From an ex post welfare analysis, the world as a whole can be worse off with trade. Consequently, lump-sums transfers are not always possible.
Proof: See appendix C.
5 CONCLUSION
Differences between domestic financial systems can lead to international trade as those differences biases the attitude towards risk of domestic managers. Countries with relatively developed or decentralized financial systems will export innovative commodities while countries with less developed and centralized financial systems will export traditional commodities. The opening of trade can ceteris paribus, amplify the concentration of innovative activities in some countries.
As this trade is grounded on countries’ specific attitude towards risk, ex ante analysis and ex post welfare analysis of the opening of trade can lead to opposite assessment. If free trade is always preferred from an ex ante welfare analysis, free trade can lower the ex post welfare of the more risk averse country and the world as a whole. Autarky distortions can be amplified by trade. Then, free trade commitment which are decided from an ex ante welfare analysis can be regretted ex post.
It could be preferable for the more averse country, i.e. the country with the less developed or the more centralized financial system to protect itself from trade. In fact, the less developed countries which have obviously a less developed financial system can be in such a case. Nevertheless, protectionism is not the first-best solution and a better policy is to deal with institutional or financial factors. A better way is to develop financial markets, access to credit, to avoid financial repression, before the opening of trade. Remark that our model leads to conclusions which remain close in spirit to the arguments mobilized in favour of temporary protection for infant industries.
REFERENCES
Aoki M., Patrick H., eds. (1994), The Japanese Main Bank System, Oxford: Clarendon Press, 1994.
Bhagwati, J., (1971), “The Generalized Theory of Distortions and Welfare”, in J. Bhagwati et al., Trade, Balance of Payments and Growth: Papers in International Economics in Honour of Charles P. Kindleberger, Amsterdam: North-Holland.
Block T.H., (2002), Financial Systems, Innovation and Economic Performance, MERIT Publications.
Bugnot P., (2004), European Innovation Scoreboard, Comparative Analysis of Innovation Performance, Council of the European Commission, Commission Staff Working Paper.
Diamond D.W., Dybvig P.H., (1983), Bank runs, Deposit Insurance and Liquidity, Journal of Political Economy”, 91,401-419.
Fry M.J., (1995), Money Interest, and Banking in Economic Development, Second Edition, The John Hopkins University Press, Baltimore and London.
Gentry W.M., Hubbard R.G., (2001), “Entrepreneurship and Household Saving”, NBER, Working Paper, N°. 7894.
Greenwood J., Jovanovic B., (1990), “Financial Development, Growth, and the distribution Income”. Journal of Political Economy, 98, 5, October, 1076-1107.
Grossman G. M., and Helpman E., (1991), Innovation and Growth in the Global Economy, MIT Press. Various Chapters.
Kihlstrom R.E., Laffont J.J., (1979), A General Equilibrium Entrepreneurial Theory of Firm Formation Based on Risk Aversion, The Journal of Political Economy, Vol.87, 4, 719-748. Lucas R.E., Prescott E., (1974), Equilibrium Search and Unemployment, Journal of Economic Theory, 7, 188-209.
King R., Levine R., (1993), “Finance, Entrepreneurship and Growth”, Journal of Monetary Economics, 32, 513-542.
Knight., F.H., (1921), Risk, uncertainty and profit, Boston: Houghton Mifflin.
Lipsey R.G., and Lancaster K., (1956), The General Theory of Second Best,” Review of Economic Studies, 24, 11-32.
Mayer C., (1998), Financial Systems and Corporate Governance: A Review of the International Evidence, Journal of Institutional and Theoretical Economics, vol.154, 144-165. Moskovitz T., and Vissing-Jorgensen A., (2002), “The Private Equity Puzzle”, Americain Economic Review, vol. 92, n°4, pp. 745-778
Nakagawa S., Shimizo T., (1999), Portfolio Selection of Financial Assets by Japan’s Households, Bank of Japan Monthly Bulletin, November.
Newbery D., Stiglitz, J.E., (1984), Pareto Inferior Trade, Review of Economic Studies 51, 1-12.
Qian Y., Xu C., (1998), Innovation and Bureaucracy under Soft and Hard Budget Constraints, Review of Economic Studies, 65,151-164.
Rajan R., Zingales L., (1998), “Financial dependence and growth,” American Economic Review, 88, pp. 537-58.
Saint-Paul G., (1992), Technological Choice, Financial Markets and Economic Development, European Economic Review 36, 763-781.
Schumpeter J.A., (1911), The Theory of Economic Development: An inquiry into profits, capital, credit, interest and the business cycle. 1934 translation, Cambridge, Mass: Harvard University Press.
Schumpeter J., (1942), Capitalism, Socialism and Democracy, New-York, Harper 1950.
Shy O., (1988), A General Equilibrium Model of Pareto Inferior Trade, Journal of International Economics 25, 143-154.
Appendix A: Ex post gains for country L
• if specialization is complete then L is always better off with trade: From (4) and (5), autarky income is: (10)
[
]
[
k]
b b k yL + − − + − + = − − − − ) 1 ( ) 1 ( ) 1 ( 1 1 1 1 1 1 µ θ θ θ θ µ α α α αMoreover, from (6), we have the free trade income of L: (11)
b b yL∗=1− Ex post welfare of free trade relative to autarky is (12) bb
L L L p p y y U = ∗× ∗
(10),(11),(12) gives the ex post welfare of L:(13)
(
p b b)
pb b U b L × − + − = − ) 1 ( 1 1 µ µAs 1µp(1−b)+b> as µp>1and that from (9) ∗> ⇔
L p p ⇒ + > L L p p b µ µ 1 1−pb>1 b µ then (13) is superior to 1 (Q.E.D).
• if specialization is incomplete for L, L is better off:
Then L has no price effect; p∗=p. Moreover its income effect is always positive:
np n
y∗L=1− +µ so with n=bypL+bp
∗
µ supply/demand equilibrium gives
b ) b 1 ( p 2b n=µ − + then b b p b b p y∗L=µµ ((11+− ))+− . From (10),yL=µp(1µ−pb)+b, then = (1+ )− >1 ∗ p b b p y y L L µ µ since µp>1 Q.E.D.
• if specialization is incomplete for M, L is better off:
Then there is a negative price effect for L while its income effect is positive: 1 ) ) 1 ( ( ) ) 1 ( ( 1 1 > + − = × + − = × ∗ ∗ ∗ ∗− − ∗ b b b b b b L L p b b p p p p p b b p p p p y y µ µ µ µ
with p∗b>pb and µp>1 Q.E.D.
Appendix B: Ex post gains for country M are indeterminate
• When specializations are complete. Ex post welfare for M is from (12):
[
]
b b M p b b b b p U − − + − = 1 ] [ ) 1 ( ) 1 ( µ µAs b>0.5 and as [µp]1−b>1, the denominator is superior to 1. On the contrary, nothing guarantees that the numerator is superior to 1 and a fortiori superior to the denominator. Hence, we can’t conclude without numerical simulations. The following numerical example shows that the more averse country can be worse off with trade.
Let ,α=0.7,β=0.5,k=0.3,θ=0.8 so 86µ=0.
We verify that L is always better off with trade while the benefit of trade for M depends from the value of b. If b is less than 0.55, M is worse off with trade, while if b is greater than or equal to 0.55 then M is better off with trade.
Let ,α=2,β=1.5,k=0.3,θ=0.8 so 86µ=0. . If b is less than 0.65, M is worse off with trade, while if b is greater than or equal to 0.65 then M is better off with trade.
Let ,α=20,β=2,k=0.3,θ=0.8 so 86µ=0. . If b is less than 0.525, M is better off with trade, while if b is greater than or equal to 0.525 then M is worse off with trade.
But M can be always worse off when: α=2,β=1.5,k=0.1,θ=0.8,or always better off when: 8 . 0 , 8 . 0 k , 5 . 1 , 2 β= = θ= = α
Appendix C: The world as a whole can be worse off with trade.
LetR the hicksian compensated income such that country J achieves the same level of utility J given the price change from p to a p :* U*j(p*,y*J+Rj)=U*J(paJ,yJa). Then, we have
*J a J b a J * J p y y p R × −
= for each J=O,P and the world welfare decreases when R 0 J J
>
∑
Numerical illustration
For example, whenb=0.7,α=20,β=2,k=0.3,θ=0.8,so 86µ=0. , the world welfare decreases. In this case, specializations are complete and we haveRM =0.62 RL =−0.53 so
0 09 . 0 R J J= >