HAL Id: hal-02913112
https://hal-centralesupelec.archives-ouvertes.fr/hal-02913112
Submitted on 7 Aug 2020
HAL is a multi-disciplinary open access
archive for the deposit and dissemination of
sci-entific research documents, whether they are
pub-lished or not. The documents may come from
teaching and research institutions in France or
abroad, or from public or private research centers.
L’archive ouverte pluridisciplinaire HAL, est
destinée au dépôt et à la diffusion de documents
scientifiques de niveau recherche, publiés ou non,
émanant des établissements d’enseignement et de
recherche français ou étrangers, des laboratoires
publics ou privés.
GroDDViewer: Dynamic Dual View of Android Malware
Jean-François Lalande, Mathieu Simon, Valérie Viet Triem Tong
To cite this version:
Jean-François Lalande, Mathieu Simon, Valérie Viet Triem Tong. GroDDViewer: Dynamic Dual View
of Android Malware. GraMSec 2020 - 7th Seventh International Workshop on Graphical Models for
Security, Jun 2020, Virtual Conference, France. pp.127-139, �10.1007/978-3-030-62230-5_7�.
�hal-02913112�
GroDDViewer:
Dynamic Dual View of Android Malware
Jean-Fran¸cois Lalande[0000−0003−4984−2199], Mathieu Simon, and
Val´erie Viet Triem Tong
CentraleSup´elec, Inria, Univ Rennes, CNRS, IRISA, Rennes, France {firstname.lastname}@inria.fr
Abstract. Understanding an Android malware is a difficult task that requires strong skills in reverse engineering. Few tools exist except the well know IDA and Ghidra tools that are more focused on the analysis of binaries. In the Android world, understanding a malware requires to analyze the bytecode of the application, possibly obfuscated or hidden in a benign application that has been modified. At execution time, the malware can download new payloads, compromise the smartphone, and install new apps. We believe that a security analyst would appreciate to visualize and replay an execution of an Android malware. In particular, an analysis that bridges the gap between the bytecode and the events occurring during the execution would help to understand the malware behavior. In this article, we propose GroDDViewer the first tool offer-ing a dual view of the execution of an Android malware. The first view represents the execution at operating system level through the represen-tation of all information flow between files, processes and sockets. The second view represents what happened in the code of the application, during its execution. The benefit of this visualization tool is illustrated on a ransomware sample. In future, we plan to evaluate the tool with a panel of users on a benchmark of malware samples.
Keywords: malware · visualization
1
Introduction
Security researchers have different goals when working on Android malware anal-ysis. Faruki et al. have discussed these goals and the associated methodologies [6]. Most contributions try to decide if an application is a malware or not. Few works try to address the problem of understanding the behavior of a malware appli-cation. Nevertheless, such an activity is an important task for security analysts of companies or government agencies that are involved in cyber security. Their state of practice is still manual code inspection, which is time-consuming and error-prone without automated support [16]. Any tool supporting this process speeds up the investigation when a malware has to be characterized.
Analyzing and understanding Android malware can have multiple goals. Most of the time it consists in locating a payload, triggering it, for example if it is
encrypted. By observing the actions of the malware, the analyst should be able to classify a sample as a locker, a Remote Administration Tool, a ransomware, etc. If the application has been piggybacked [11], the analyst should find out the malicious code. Then, he has to understand what the malicious code is doing, when executed, and we believe that for these tasks, the security analyst needs to be helped by tools, especially visualization tools.
A lot of approaches are based on static analysis but well known contributions such as CopperDroid [17], CrowDroid [5], DroidScope [22], Harvester [4] have focused on extracting malware information from an execution. As mentioned by Faruki et al., such approaches have to face to the difficulty of being sure that the malware has been successfully executed. Thus, new approaches [1, 7] focused on the particular problem of helping the execution of malware that wait for particular conditions to occur. Nevertheless, all these dynamic approaches focus on how to get data from an execution (system calls, variable values, network operations, etc.) but not on how to display the captured data for the security analyst. Most of the time, online platforms that propose an analysis report give basic textual information about a sample, like virustotal or Andrubis [21]. Such tools can give aggregate view of a huge amount of malware samples analyzed, like one million analysis of Andrubis [12]. Aggregate views are useless for the security analyst that needs to gain information of a particular sample, especially if this sample is a newly discovered one that has never been analyzed before.
In this article, we propose a new visualization approach, GroDDViewer, for helping a malware analyst to gain information about the execution of a malware sample. GroDDViewer gathers information from a static and a dynamic analy-sis performed by external tools. This way, GroDDViewer offers a dual view of the execution of the malware: one view dedicated to the representation of the attack by all the information flows generated at operating system level between processes, files and sockets, and a second view dedicated to the representation of the executed malicious code. These two views can be manipulated by the analyst and can focus on precise intervals of time. Additionally, GroDDViewer offers a replay feature to animate the two views and see the malware operating and executing itself. GroDDViewer is implemented as a standalone Javascript webpage in order to be easily loaded on any platform in a web browser.
The rest of the article is structured as follows. Section 2 presents the ap-proaches related to the visualization of Android malware. Section 3 briefly ex-plains how are collected the data from a malware execution before moving on Section 4 that presents the visualization interface of GroDDViewer. We illustrate our tool on a real malware use case in Section 5. Finally, Section 6 concludes the paper.
2
Related work
Visual analysis can be used to classify or recognize malware [19]. In [13], the au-thors use visual similarities of malware’s image to discover relationships between malware. In [14], a graphical overview of the similarities of Android malware’s
code help to identity the shell code shared by different malware samples. These approaches have a different goal because they help to understand the evolution of a family of malware or multiple samples.
For investigating the code and execution traces of a malware, most ap-proaches rely on static or dynamic methods. Static analysis can be used to collect data and build visualization tools that help to classify, browse malware families or study one particular malware. On the other side, few papers focus on the visualization of dynamic analysis. This is surprising, as malware analysts need to collect information from executions, for example API and kernel calls [20]. A complementary approach is to monitor the network during an analysis, which can give good insight of malware activities [23].
We found several approaches that focus on the analysis of one single malware and capture dynamic data and propose visualization results that have similari-ties with our approach. Trinius et al. [18] propose to use treemaps to visualize system calls and treegraphs to represents the system commands during the time of execution. This work is similar to our approach as is a sort of dual view of a malware (system and command levels) with a dynamic view that helps the user to get what is happening over time. Nevertheless, it is focused on x86 binaries; thus API calls are realtive to POSIX accesses. With Android malware, more information is available about the Java bytecode that should be exploited. An-other works of Gregio et al. [8, 9] have similar ideas for representing malware’s actions with graphs. The visualization that is proposed is dynamic: it displays over time the use of the API calls for manipulating files, processes, network, reg-isters. The chosen visualization is a spiral of actions that represents the whole timeline of the performed actions. We keep this idea in our proposal, but we prefer to use dynamic animation for representing what is happening over time. Indeed, if the malware performs a lot of time the same actions, the timeline visu-alization should remain compact. Additionally, this approach is again dedicated to x86 binaries and does not handle the specificites of Android. In [15], Quist et al. introduce the visualization of the control flow of the program for executable malware. This approach produces very large graphs but helps to isolate loops, and especially unpacking stages which is of primary interest for x86 malware. Compared to our approach, we intend to use the control flow graph to link ob-servations to the reversed source code of the malware. Thus, we need to have more readability on such kind of representation.
When dealing with a unique malware, well known online platforms give very basic information, mainly in a text based way. The most developed source of information are the blogs web pages that give precise insight for a particular sample. Such analysts use virtualized emulators or real smartphones to execute the malware and can be helped by uncompilers or debuggers like the well known IDA software. Nevertheless, such tools have no advanced display capabilities when a malware operates million of system calls, creates hundreds of files and has thousands of Java classes to understand. The particular nature of Android applications and the way the malware are implemented, as a repackaged benign application where malicious code has been added, pushed us to develop a new
visualization interface. Additionally, all the cited approaches are related to the visualization of x86 malware and do not focus on the particularities of Android malware (except for Paturi et al. [14]).
One recent paper focuses on Android malware: this tool is called “Android Malicious Flow Visualization Toolbox” and is a suite of interactive visualization diagrams that helps to investigate the malicious behavior of an application [16] This contribution is really close to our approach: the investigator works on a specific application in three phases: first, he observes the interactions with the Android system, in particular the sensitive APIs; second, he formulate hypoth-esis of possible leaks of sensitive data; third, it helps to confirm these leaks by investigating visually the control flow, including broken by the Java exception mechanism. Compared to GroddViewer, the Android Malicious Flow Visual-ization Toolbox give a more precise insight of the control flow for the analyst. Nevertheless, it lacks a view of flows at operating system level (files, other pro-cesses) and it lacks dynamic capabilities to synchronize events that occur during time with the visualization framework.
Another recent paper focuses on the dynamic aspect of an execution: Viz-Mal [3], represents the maliciousness of an application over time with green and red boxes. The decision about the maliciousness of an execution slot is performed using machine learning techniques applied to syscall traces. This approach is complementary to our approach but give few information visually. When a red box is identified, the analyst still have to investigate the code and the operation performed by the malware.
As a conclusion, we believe that our paper is the first to propose a visual-ization for Android malware combining the view of the code and the operating system events captured during an execution.
3
Material collection
GroDDViewer leverages existing static and dynamic tools to offer a representa-tion of the attack itself and the malicious code that has been executed during the attack.
First, the malicious behavior is captured by AndroBlare [2], that monitors flows of information at operating system level. AndroBlare intercepts system calls responsible of information flows between files, sockets or processes which enable to observe the malware from the operating system point of view. An-droBlare relies on tainting techniques : the malware APK file is tainted with a mark and each process or object of the system can obtain the mark if a system call generates an information flow from a marked process/object. During the execution, all the interactions that happened between the process created from the APK file and the system are collected in a log. These interactions are process creation, file creation, and socket interactions. We also collect the state of the device file owned by the user before and after an execution in order to be able to show what happened to these files.
The attack is triggered by GroddDroid [1], a framework that detects suspi-cious codes and controls multiple executions of a malware in order to force the execution of code identified as suspicious. A method of the bytecode may be considered suspicious after a static analysis that computes a score based on its API usage. For example, a method performing a lot of cryptography or using reflection can be considered as suspicious. The analyst should later look at the methods considered as suspicious to confirm or deny their suspiciousness. Grodd-Droid instruments the bytecode to be able to trace the execution of all branches of the control flow. Then, it executes and stimulates the malware in a real smart-phone and audits the executed branches. If the suspicious code is not reached, GroddDroid changes branch conditions in order to push the execution towards the malicious code. During such multiple executions, we collect the name and the time of the executed branches in order to be able to give a representation of the executed code at method level, as described later in Section 4.
GroDDViewer collects all data from files produced by GroddDroid and Blare. For achieving the visualization, the processing is performed by Javascript scripts that read these files, which avoids to use an HTTP server.
4
Visualizing malware execution
4.1 Overview
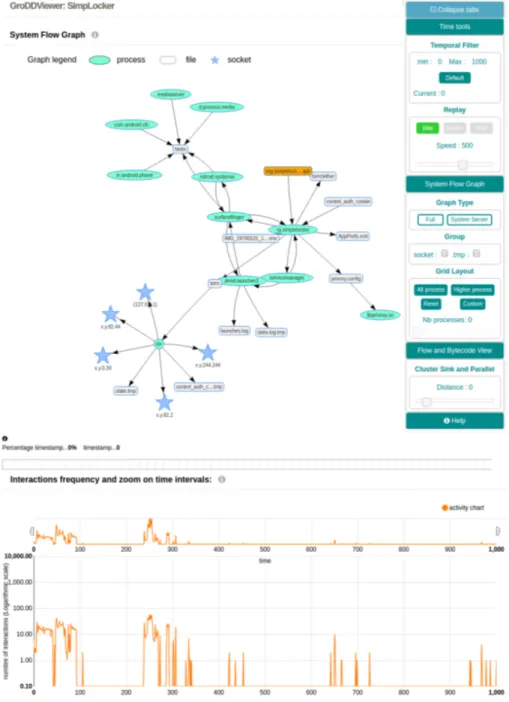
GroDDViewer offers a dual view of a malware execution: a view of all the in-formation flows at operating system level and a view of the executed malicious bytecode. As shown in Figure 1, 2, and 4, four main components explain the malware execution:
1. System Flow Graph (upper part of Figure 1) represents all the information flows induced by the malware execution that occurred at system level; 2. Interactions frequency (bottom part of Figure 1): represents the number
of information flow events over time;
3. Method Control Flow and Bytecode View (Figure 2 and Figure 3): represents the control flow of method calls and the bytecode of a method; 4. User interface navigation (Figure 4) represents what is seen on the
smart-phone from the user perspective, if any, and the events to go from one screen to another one.
Dynamic interactions of the user with these graphical elements provide addi-tional information. For example, the user can click to get addiaddi-tional information such as a file modification or the bytecode source. The selection of time inter-vals provides a zoom capability on a specific period of time. The replay feature animates the graphs in order to replay events at operating system and bytecode levels. All these features are described in the next sections.
Fig. 1. Overview of GroDDViewer (part 1): System Flow Graph (upper part) – Inter-actions frequency (bottom part) – Malware investigated: Simplelocker (cf. Section 5)
4.2 System Flow Graph
Information flows between objects of the operating system represent how the malware contaminates the operating system from the APK file (upper part of Figure 1). Each edge of the graph may appear multiple times as system calls can be triggered often by the process, for example when writing a file. We record the timestamps of each occurrence which enables to replay the interactions.
A node of the graph can be a process, a socket, or a file. When clicking on a file, the difference of content is displayed between the initial state and final state of the experiment, if the file is a text file. It allows to follow the content modified or created by a malware. If the malware just read information, the edges show a transition from the file to a process.
The toolbar provides additional functionalities to manipulate the System Flow Graph. First, additional nodes can be displayed. The Full graph option shows the possible duplicate process nodes. It corresponds to the execution of multiple independent processes that have the same name. The System Server graph option shows the subgraph of the System Server process and all con-nected other processes that have been contaminated by the mark through System Server. As System Server is the central process that delivers Android Services and may asks to other Android process some data, the size of this subgraph can be very large if the malware accesses frequently the Android API. Thus, masking this part of the graph helps to visualize the processes that are accessed by the malware but it may be necessary to reactivate it to learn what the malware tries to access. Second, nodes that have similar extensions can be grouped. It allows to reduce the graph when a malware generates a lot of similar files, for example writes log files or accesses multiple sockets.
Finally, the layout of the processes can be controlled using the Grid Layout option. It forces the placement of all, higher or a custom number of processes on a grid. This tool helps to browse the graph when the number of nodes is large.
4.3 Interactions frequency
At the bottom part of Figure 1, a frequency graph displays the number of events occurring for information flows at kernel level. Because a simple Java operation can generate a large number of system calls, the number of flows in few millisec-onds can be very high. Thus, we discretize the time of experiments in an interval [0, 1000] and we display the number of events on a logarithmic y axis.
The interaction frequency graph also intends to be used for zooming on a precise time interval. Indeed, some malware actions can be concentrated in a particular portion of time: the user selects a new time interval in [0, 1000] on the upperpart of the interaction frequency graph. A new selection of an interval [x, y] has two effects. First, the lower orange graph is updated accordingly. Second, the System Flow graph is updated to display the processes, files and sockets involved during [x, y]. This functionality is particularly useful for understanding what the malware is doing on a particular period of time, or where the user shows a pick of activity on the Interaction frequency graph.
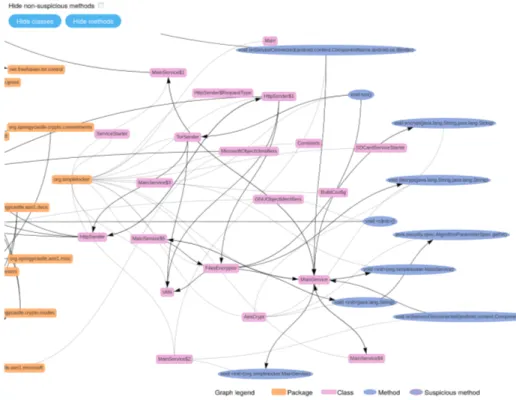
Fig. 2. Overview of GroDDViewer (part 2): Method Control Flow – Malware investi-gated : Simplelocker (cf. Section 5)
4.4 Control flow and bytecode views
The dual view of the System Flow Graph is the Method call graph that represents the control flow between methods. We could have displayed the entire control flow, i.e. by representing the control flow of the inside of a method, but the graph would have become difficult to understand. Thus, we define the nodes as methods and the edges represents explicit calls of methods. This way, we obtain a graphic representation of the code of the malware. A path, in such a graph, is a possible nested suite of method calls until a return statement unstack the last call.
As shown in Figure 2, in order to help the user to browse the graph, we give the possibility to fold/unfold the methods (blue nodes) by packages (orange) and classes (pink). Suspicious classes have a red border and help the user to focus on suspicious methods. Each node of the call graph can be clicked. GroDDViewer displays the bytecode in a popup window, as shown in Figure 3. This way, the user can analyze the suspicious bytecode and follow the malware developer logic.
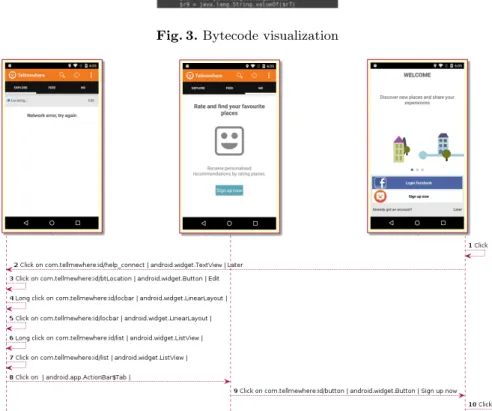
Fig. 3. Bytecode visualization
Fig. 4. Automaton of the navigated screens
4.5 User interface navigation
GroDDViewer also displays the different screens of the application that appeared during an execution, as shown in Figure 4. These screenshots are represented as automata where transitions are labeled with the simulated user interaction.
4.6 Dynamic replay
As the collected data come from an execution of the malware, we also record the timestamps associated to all events: the dates of the observed flows of the System Flow Graph and the dates of the branches of the control flow graph of the bytecode. The collected timestamps are extracted from the kernel (for the
System Flow Graph) or from the Android logcat command when the malware bytecode is executed. Thus, we have to synchronize the two sources of timestamp to be able to replay events with a precision acceptable from the user perspective. The Replay feature, located in the Time tools group of the toolbar, replay all events in a dual manner: the System Flow Graph events are animated syn-chronously with the Method Control Flow graph. This animation helps to see simultaneously the operation at system level, for exemple file creation or socket communication, while the methods of the bytecode are called. It helps to iden-tify the nature of the methods from the nature of the performed action in the system, as illustrated in the use case in Section 5.
5
Use case
We have chosen to study a ransomware called SimpleLocker1 from the Kharon dataset [10] to present an example of use case of GroDDViewer. SimpleLocker is a ransomware that encrypts the user files before asking for a ransom to the user. If the user pays the ransom, the attacker may trigger the unencryption process using the Tor network. The visualization for this malware corresponds to Figures 1 and 2.
5.1 Static analysis
When displaying the GroDDViewer page for the SimpleLocker malware , several things can be noted. First, the System Flow Graph contains several processes (upper part of Figure 1). When excluding the processes like m.android.phone or servicemanager, two processes can be noted: tor and libprivoxy.so. It is uncom-mon to have more than one process for a benign Android application. Multiple processes reveal that the malware have launched another application. In partic-ular, the graph shows a file torrc that is wrote by the process org.SimpleLocker and read by the tor process. tor connects to several IPs: we can easily suspect that this malware tries to communicate with the attacker using the Tor network. Second, the Method Control Flow and Bytecode View gives an overview of the code (Figure 2). Two entry points are identified: onCreate, the standard way of creating an Android Activity and onStartCommand which is used to start an Android Service. Nine methods have been identified as suspicious (red borders). One of the most interesting is doShellCommands which name is highly suspicious. Clicking this method shows the bytecode that tries to run shell commands using java.lang.Runtime. All other suspicious methods can be inspected but we already know that they have been flagged as suspicious (high score) due to API calls such as encryption, telephony, etc. Other displayed intermediate nodes participate to the paths of calls to reach the suspicious nodes.
1 The visualization of SimpleLocker using GroDDViewer is available at:
http://people.rennes.inria.fr/Jean-Francois.Lalande/talks/GraMSec20/ SimpLocker_sample_fd694cf5ca1dd4967ad6e8c67241114c.html
5.2 Dynamic analysis
Using the replay capability of GroDDViewer gives an insight about the malware actions. The Interaction frequency graph (bottom part of Figure 1) shows a lot of interactions on the interval [0, 100]. When replaying, this first part corresponds to Android routines and are not linked with the malware execution that starts later. SimpleLocker starts at time t = 250: after being unpacked from the .apk file, it deploys local files like torrc and privoxy.config. Then, a long interaction is observed at time t = 258 with a file ending by .enc. This means that some long operations are running for this file. At timestamp 960, operations are finished on this file. At the end of the replay, we also see some interactions between the tor process and some IPs.
This first dynamic overview suggests to focus on the interval t > 240. Thus, the user can use the zoom functionality to put the replay window on t ∈ [240, 1000].
Then, the dynamic replay of Method Control Flow graph shows a sequence of calls onCreate → run → encrypt at times t near 250. It corresponds to the generation of the encrypted file .enc after starting the main activity of the application. Indeed, if the user inspects the executed encrypt method, as shown in Figure 3, the first lines of the bytecode shows the code $r1 = new org.SimpleLocker.AesCrypt followed by specialinvoke $r1.(”jndlasf074hr”) which corresponds to the call to the constructor of the used AES encryption algorithm with a constant encryption key. When opening the other animated nodes such as findExistingProc, findProcessIdWithPidOf, the user may think that it corre-sponds to the control of the Tor process for handling communication, which is less interesting to investigate.
Thus, the replay shows the encryption occurring at time t > 250 with the AES algorithm with a constant key. Unfortunately, as the communication is handled by a native independent process, we cannot inspect using the Method Control Flow graph the details of the execution of the communication protocol.
6
Conclusion
In this paper, we have presented GroDDViewer, an online tool for analyzing, understanding and replaying Android malware. GroDDViewer presents a dual view of malware: the graph of interactions that represents the operations that occured at operating system level and the graph of the methods of the bytecode. The presented use case illustrates how the user can easily gain some knowledge on the execution of a malware. Of course, such a tool cannot replace a manual investigation of the details of the bytecode but ease the understanding of the malware behavior. Future works concern the evaluation of the tool on a large panel of Android malware. Security analysts that conduct regular analysis of new samples will be involved in a campaign with two groups: one using GroDDViewer and not the other. Such a study will help to evaluate finely the obtained benefits.
References
1. Abraham, A., Andriatsimandefitra, R., Brunelat, A., Lalande, J.F., Viet Triem Tong, V.: GroddDroid: a Gorilla for Triggering Malicious Behav-iors. In: 10th International Conference on Malicious and Unwanted Soft-ware. pp. 119–127. IEEE Computer Society, Fajardo, Puerto Rico (oct 2015). https://doi.org/10.1109/MALWARE.2015.7413692
2. Andriatsimandefitra, R., Viet Triem Tong, V.: Capturing Android Malware Be-haviour Using System Flow Graph. In: The 8th International Conference on Net-work and System Security. pp. 534–541. Springer Berlin / Heidelberg, Xi’an, China (oct 2014). https://doi.org/10.1007/978-3-319-11698-3 43
3. Bacci, A., Martinelli, F., Medvet, E., Mercaldo, F.: VizMal: A visualiza-tion tool for analyzing the behavior of Android malware. In: 4th Inter-national Conference on Information Systems Security and Privacy. vol. 1: ForSE, pp. 517–525. SciTePress, Funchal, Madeira, Portugal (Jan 2018). https://doi.org/10.5220/0006665005170525
4. Bodden, E.: Harvesting Runtime Values in Android Applications that feature Anti-Analysis Techniques. In: Network and Distributed System Security Symposium. pp. 21–24 (Feb 2016). https://doi.org/10.14722/ndss.2016.23066
5. Burguera, I., Zurutuza, U., Nadjm-Tehrani, S.: Crowdroid: Behavior-Based Mal-ware Detection System for Android. In: 1st ACM workshop on Security and privacy in smartphones and mobile devices. p. 15. ACM Press, Chicago, USA (oct 2011). https://doi.org/10.1145/2046614.2046619
6. Faruki, P., Bharmal, A., Laxmi, V., Ganmoor, V., Gaur, M.S., Conti, M., Rajarajan, M.: Android Security: A Survey of Issues, Malware Penetration and Defenses. IEEE Communications Surveys & Tutorials 17(2), 1–27 (2015). https://doi.org/10.1109/COMST.2014.2386139
7. Fratantonio, Y., Bianchi, A., Robertson, W., Kirda, E., Kruegel, C., Vigna, G.: TriggerScope: Towards Detecting Logic Bombs in Android Applications. IEEE S&P pp. 1–33 (May 2016). https://doi.org/10.1109/SP.2016.30
8. Gr´egio, A.R.A., Santos, R.D.C.: Visualization techniques for malware behav-ior analysis. Communications, and Intelligence (C3I) Technologies for Home-land Security and HomeHome-land Defense X 8019, 801905–801905–9 (Jun 2011). https://doi.org/10.1117/12.883441
9. Gr´egio, A.R.A., Baruque, A.O.C., Afonso, V.M., Filho, D.S.F., de Geus, P.L., Jino, M., dos Santos, R.D.C.: Interactive, Visual-Aided Tools to Analyze Malware Behavior. In: 12th international conference on Computational Science and Its Ap-plications. LNCS, vol. 7336, pp. 302–313. Salvador de Bahia, Brazil (Jun 2012). https://doi.org/10.1007/978-3-642-31128-4 22
10. Kiss, N., Lalande, J.F., Leslous, M., Viet Triem Tong, V.: Kharon dataset: An-droid malware under a microscope. In: The Learning from Authoritative Security Experiment Results Workshop. The USENIX Association, San Jose, United States (may 2016)
11. Li, L., Li, D., Bissyande, T.F., Klein, J., Le Traon, Y., Lo, D., Cavallaro, L.: Understanding Android App Piggybacking: A Systematic Study of Malicious Code Grafting. IEEE Transactions on Information Forensics and Security 12(6), 1269– 1284 (jun 2017). https://doi.org/10.1109/TIFS.2017.2656460
12. Lindorfer, M., Neugschwandtner, M.: ANDRUBIS-1,000,000 Apps Later: A View on Current Android Malware Behaviors. In: 3rd International Work-shop on Building Analysis Datasets and Gathering Experience Returns
for Security. IEEE Computer Society, San Jose, CA, USA (sep 2014). https://doi.org/10.1109/BADGERS.2014.7
13. Long, A., Saxe, J., Gove, R.: Detecting Malware Samples with Similar Image Sets. The Eleventh Workshop on Visualization for Cyber Security pp. 88–95 (Nov 2014). https://doi.org/10.1145/2671491.2671500
14. Paturi, A., Cherukuri, M., Donahue, J., Mukkamala, S.: Mobile malware visual analytics and similarities of Attack Toolkits (Malware gene analysis). In: 2013 International Conference on Collaboration Technologies and Systems (CTS). pp. 149–154. IEEE (may 2013). https://doi.org/10.1109/CTS.2013.6567221
15. Quist, D.A., Liebrock, L.M.: Visualizing compiled executables for mal-ware analysis. In: 6th International Workshop on Visualization for Cy-ber Security. pp. 27–32. IEEE, Atlantic City, NJ, USA (Oct 2009). https://doi.org/10.1109/VIZSEC.2009.5375539
16. Santhanam, G.R., Holland, B., Kothari, S.C., Mathews, J.: Interactive visualiza-tion toolbox to detect sophisticated android malware. In: IEEE Symposium on Visualization for Cyber Security. pp. 1–8. IEEE Computer Society, Phoenix, AZ, USA (Oct 2017). https://doi.org/10.1109/VIZSEC.2017.8062197
17. Tam, K., Khan, S., Fattori, A., Cavallaro, L.: CopperDroid: Automatic Recon-struction of Android Malware Behaviors. In: 22nd Annual Network and Dis-tributed System Security Symposium. San Diego, California, USA (feb 2015). https://doi.org/10.14722/NDSS.2015.23145
18. Trinius, P., Holz, T., Gobel, J., Freiling, F.C.: Visual analysis of malware behavior using treemaps and thread graphs. In: 6th International Workshop on Visualiza-tion for Cyber Security. pp. 33–38. IEEE, Atlantic City, NJ, USA (Oct 2009). https://doi.org/10.1109/VIZSEC.2009.5375540
19. Wagner, M., Fischer, F., Luh, R., Haberson, A., Rind, A., Keim, D.A., Aigner, W.: A Survey of Visualization Systems for Malware Analysis. In: EuroVis. pp. 105–125. Cagliari, Italy (May 2015). https://doi.org/10.2312/eurovisstar.20151114
20. Wagner, M., Aigner, W., Rind, A., Dornhackl, H., Kadletz, K., Luh, R., Tavolato, P.: Problem Characterization and Abstraction for Visual Analytics in Behavior-based Malware Pattern Analysis. In: Eleventh Workshop on Visualization for Cyber Security. pp. 9–16. Paris, France (2014). https://doi.org/10.1145/2671491.2671498 21. Weichselbaum, L.: Andrubis: Android Malware Under The Magnifying Glass. Tech.
rep. (2014)
22. Yan, L.K., Yin, H.: DroidScope: seamlessly reconstructing the OS and Dalvik se-mantic views for dynamic Android malware analysis. In: USENIX Security Sym-posium. p. 29. USENIX Association (aug 2012)
23. Zhuo, W., Nadjin, Y.: MalwareVis: Entity-based Visualization of Malware Network Traces. In: The Ninth International Symposium on Visualization for Cyber Security. pp. 41–47. ACM Press, Seattle, WA, USA (Oct 2012). https://doi.org/10.1145/2379690.2379696