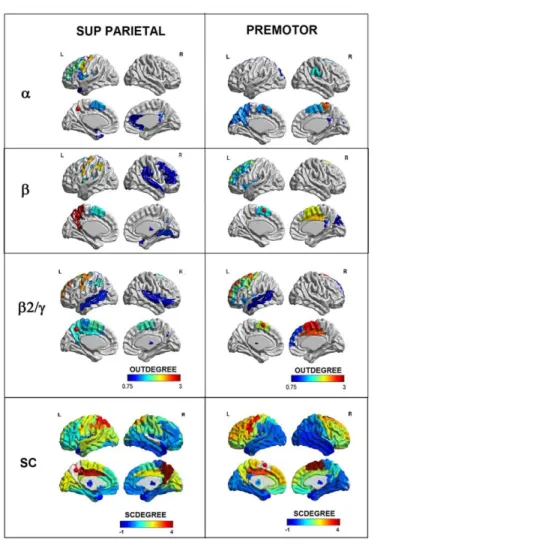
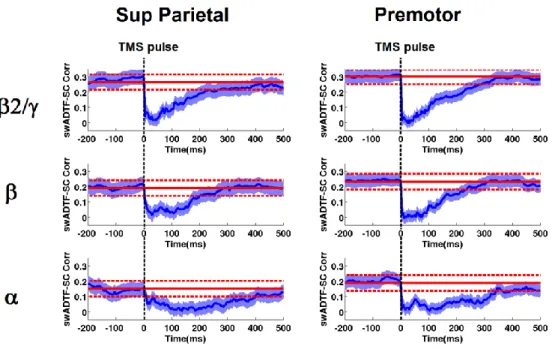
Tracking dynamic interactions between structural and functional connectivity: a TMS/EEG-dMRI study
Texte intégral
Figure


Documents relatifs
Dans les entreprises de 10 salariés ou plus des secteurs concurrentiels, le nombre moyen d’heures supplémentaires par salarié à temps complet, déclarées par les entreprises
De plus, nous allons étudier la relation d’Iven Zohar avec les deux femmes (Radia et Hellé) et le rôle joué par chacune dans sa vie ainsi que la relation entre eux, en apportant
In this work, we introduce a novel approach for dynamical functional network connectivity for functional magnetic resonance imaging (fMRI) resting activity, which
Comme avec Mycosphaerella fijiensis chez le cultivar Orishele, la germination et la pénétration sont suivies du développement des filaments mycéliens et de la
We proved with Proposition 1.2 that a cartesian product of a finite numbers of copies of an Archimedean Dedekind-complete totally ordered ring is a Simple Complete
[r]
This study assessed between-network functional connectivity strength and variability in patients with insomnia disorder as compared with matched controls without sleep
(C) Scatter plots of single subject age vs median dFC speeds (empirical data), for three pooled window size ranges (long to short, from left to right) and for both resting-state

