Gene expression profiling in hearts of transgenic mice overexpressing guanylyl cyclase domain of the GC-A receptor
Par
Jennifer Melanie Lisa Michel
Programme de biologie moléculaire Faculté des études supérieures
Mémoire présenté à la Faculté des études supérieures en vue de l’obtention du grade de Maître ès sciences (M. Sc.)
en biologie moléculaire
Juin 2004
acomp !
© Jennifer Melanie Lisa Michel 2005 MARS 1
9
0
50Ç
z-c’ c
Direction des biblïothèques
AVIS
L’auteur a autorisé l’Université de Montréal à reproduire et diffuser, en totalité ou en partie, pat quelque moyen que ce soit et sur quelque support que ce soit, et exclusivement à des fins non lucratives d’enseignement et de recherche, des copies de ce mémoire ou de cette thèse.
L’auteur et les coauteurs le cas échéant conservent la propriété du droit d’auteur et des droits moraux qui protègent ce document. Ni la thèse ou le mémoire, ni des extraits substantiels de ce document, ne doivent être imprimés ou autrement reproduits sans l’autorisation de l’auteur.
Afin de se conformer à la Loi canadienne sur la protection des renseignements personnels, quelques formulaires secondaires, coordonnées ou signatures intégrées au texte ont pu être enlevés de ce document. Bien que cela ait pu affecter la pagination, il n’y a aucun contenu manquant. NOTICE
The author of this thesis or dissertation has granted a nonexclusive license allowing Université de Montréal to reproduce and publish the document, in part or in whole, and in any format, solely for noncommercial educational and research purposes.
The author and co-authors if applicable retain copyright ownership and moral rights in this document. Neither the whole thesis or dissertation, nor substantial extracts from it, may be printed or otherwise reproduced without the author’s permission.
In compliance with the Canadian Privacy Act some supporting forms, contact information or signatures may have been removed from the document. While this may affect the document page count, it does flot represent any loss of content from the document.
11
Université de Montréal
Faculté des études supérieures
Ce mémoire intitulé:
Gene expression profiling in hearts of transgenic mice overexpressing guanylyl cyclase domain 0f the GC-A receptor
Présenté par:
Jennifer Melanie Lisa Michel
A été évalué par un jury compose es personnes suivantes:
président-rapporteur
directeur de recherche
Membre du jury
o
Résumé
Les maladies cardiaques sont une des principales causes de mortalité en Amérique du Nord. Parmi les facteurs de risque impliqués, l’hypertrophie du ventricule gauche (UVG) est un des facteurs indépendant de prédiction de la mortalité et morbidité liées aux maladies cardiaques. Plusieurs expériences ont mis en évidence les effets anti-hypertrophique du Peptide Natriurétique Atrial (ANP), et de sa voie de signalisation. En se liant à son récepteur, le Guanylyl Cyclase-A (GC-A), I’ANP augmente la concentration cellulaire de GMPc. Afin de mieux comprendre l’effet anti-hypertrophique de l’ANP et de son effecteur, le GMPc, notre laboratoire a créé une souris transgénique qui surexprime de façon constitutive le domaine catalytique du GC-A au niveau des cardiomyocytes. Ces souris sont protégées contre l’hypertrophie induite expérimentalement. Plusieurs cibles cytosoliques du GMPc ont déjà été identifiées. Cependant, très peu est connu sur ses effets au niveau de la transcription des gènes dans les cardiomyocytes. Au cours de ce travail, j’ai utilisé la technologie Afi’metrix pour investiguer l’effet du GMPc sur la transcription génique des souris GC-A en les comparant à celles de type sauvage. Les données indiquent l’augmentation de l’expression, dans les souris transgéniques, d’un groupe de gènes qui sont la cible de la cytokine pro-inflammatoire interféron-gamma (IFNy) ainsi que 1’ IFNy lui-même. Des études subséquentes avec des souris déficientes en IFNy ont suggéré que l’IFNy peut jouer un rôle dans la régulation de l’expression de l’ANP. Ces expériences suggèrent que les cytokines pro-inflammatoires jouent un rôle dynamique dans la réponse cardiaque au stress.
o
iv
Abstract
Cardiac diseases are one of the principal causes of mortality in North America. Among the many risk factors implicated, left ventricular hypertrophy (LVH) has been shown to be an independent predictor of cardiac mortality and morbidity. Several unes of evidence indicate that Atrial Natriuretic Peptide (ANP), and its signalling pathway, has anti-hypertrophic effects on the heart. The binding of ANP to its receptor, Guanylyl Cyclase-A (GC-A), increases the cellular concentration of cGMP. In order to investigate the downstream anti-hypertrophic effects of cGMP on cardiomyocytes in vivo, our laboratory has created a transgenic mouse that overexpresses a constitutively active catalytic fragment of the GC-A receptor exclusively at the level of cardiomyocytes. These mice are protected against the effects of experimentally induced forms of cardiac hypertrophy. Although several cytosolic targets of cGMP have been identified, little is known about its effects on gene transcription in cardiomyocytes. In these experiments, I have investigated the effect of cGMP on transcription by comparing gene expression of the GC-A transgenic mice with wild type mice using affymetrix teclmology. This revealed that a number of Interferon-gamma (IFN’)-activated genes, as welY as IFNy itse1f are upregulated in these mice. further studies using IFNy KO mice suggest a role of IFNy in the regulation of ANP expression. These experiments suggest a dynamic role of pro-inflammatory cytokines in the cardiac response to stress.
Table of contents
RÉSUMÉ ni
ABSTRACT IV
TABLE 0F CONTENTS V
LIST 0F TABLES VII
LIST 0F FIGURES VIII
ABBREVIATIONS IX
REMERCIEMENTS XI
INTRODUCTION 1
CARDIAc DISEASES 1
LEF T VENTRICULAR HYPERTROPHY 3
Ca2 signalling in the heart 3
Hypertrophie stimuli 4
Transcriptionat efftcts of hypertrophie stimuli 6 NO andANP: anti-hypertrophie signalling modules 8
THE NATRIURETIC PEPTIDES 10
A distinct role for each NP 11
Expression ofANP andBNP 12
$ynthesis ofANP 12
NPRECEPTORS 14
Structure ofthe GC receptors 15
Elimination 17
NPR-C 17
D0wN5TREAM TARGETS 0FcGMP 18 2+
PKG and Ca signalling 19
Effects ofPKG on the contractile machinery 20
Effects of PKG on gene expression 21
DIsEA5E5TATE 21
In vitro evidence for a role ofANP in preventing hypertrophy 22
Animal models 23
PR0JEcT BACKGROUND 25
PR0JEcTOVERVIEW 26
CHAPTER 2:MATERIAL AND METHODS 28
ANIMALs 28
TIssuE COLLECTION 28
ExTRAcTIoN 0F TOTALRNAFROM TISSUES 29
AFFYMETRIx CHIP ANALYSIS 29
N0RTHERNS 31
Gel and transfer 31
vi
Labelling ofprobes .33
Hybridization and washes 34
Exposure and analysis 34
RT-PCR 35
Reverse transcription 35
PCR 35
SEMI-QuANTITATIvEPCRs 36
PC’R reaction mix andprograms 36
Gel electrophoresis and transfer to nylon membrane 37
Probes for analysis by southern 37
Hybridization and washes 38
Exposure and analysis 39
ABDoMINAL AORTIC CONSTRICTIONS 39
CHAPTER 3: RESULTS 40
COMPARIs0N 0F OVERALL CHANGES IN GENE EXPRESSION 40
Affymetrix cht results 40
Verification ofaffymetrix results 42
SAli analysis 42
Confirmations by northern analysis 42
Confirmation by RT-PCR 44
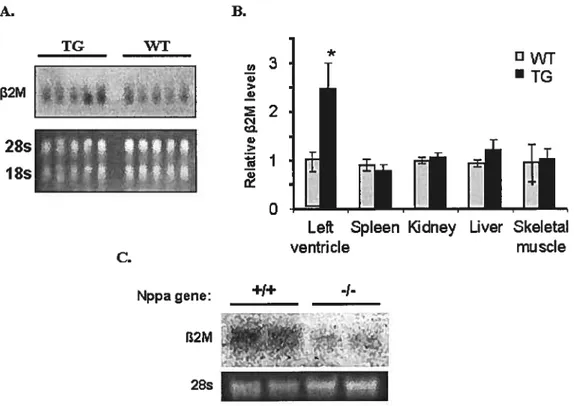
Upregulation in expression is heart specfic 45
Nppa KO mice have lowerfi2m tevels in LV 45
UPREGuLATI0N 0FIfNyIN THE GC-TRANSGENIC MICE 45 R0LE 0F IFNyINRESPONSETO HYPERTROPHIC STIMULI 47
Abdominal aortic constrictions ofIfNyKO mice 47 ANP expression in the left ventricles ofIFN7KO with abdominal aortic
constrictions 48
CHAPTER 4: DISCUSSION 50
AFFYMETRLxRESULTS 50
Changes in gene expression 50
TargetsoflFNy 5]
PRO-rNFLAMMAT0RY CYTOKINES IN THE HEART 52
Maladaptive responses 52
Protective responses 53
JFNy and hypertrophy 55
Origin ofJFN7 56
GENERAL CONCLUSIONS 58
REFERENCES 59
Lïst of Tables
Table 1.1 Animal Models in theANP signalling pathway 23
Table 2.1 Summary of probes used for Northern analysis 32
Table 2.2 Summary of oligonucleotides used for PCR 36
Table 2.3 Summary of PCR programs 37
Table 2.4 Summary of probes used in Semi-quantitative RT-PCR 38 (Southern) analysis
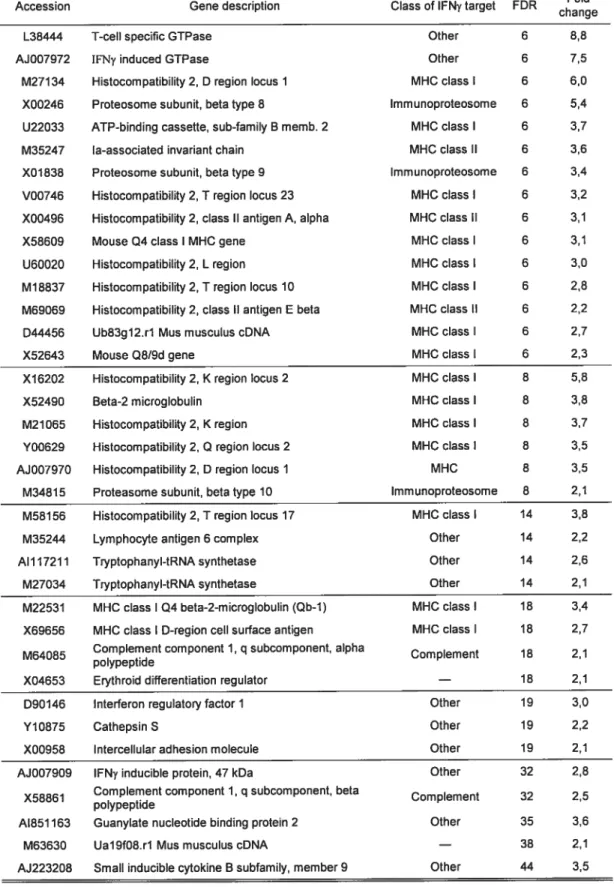
Table 3.1 Two fold upregulated genes from the Affymetrix 41 analysis
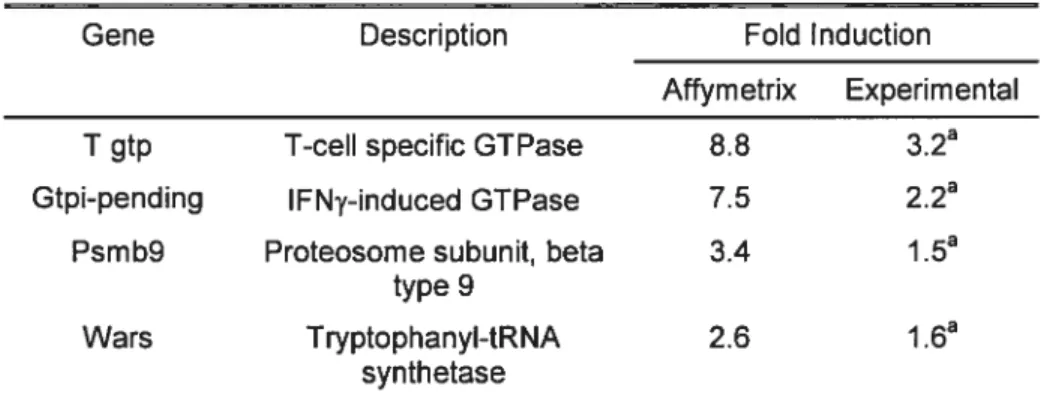
Table 3.2 Summary of semi-quantitative RT-PCR resuits for 44 biological verifications of Affymetrix chip experiment
vil’
List of figures
Figure 1.1 Mechanisms of PKG action on hypertrophic signalling. 04 Figure 1.2 The natriuretic peptide family signalling pathway. 13 Figure 3.1 Changes in gene expression observed in CG- 40
Transgenic mice relative to WT mice via Affymetrix tech no Iogy.
Figure 3.2 Biological verification of Affymetrix gene chip with 43 32-MicrogIobulin
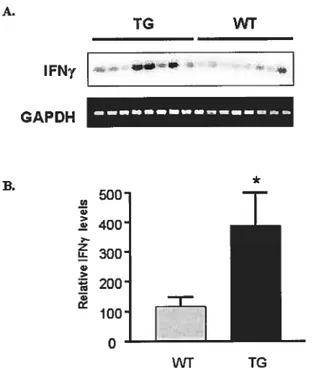
Figure 3.3 Expression of IFNy in GC-Transgenic mice. 46 Figure 3.4 LV size and expression ofANP following Abdominal 49
Abbreviatïons
AAC Abdominal Aortic Constriction ANGII Angiotensin II
ANP Atrial Natriuretic Peptide ATP Adenosine Triphosphate BNP B-type Natriuretic Peptide BW Body Weight
CaM Calmodulin
CaMKII CaM-Dependent Kinase Il
CAMP Cyclic Adenosine Monophosphate CGMP Cyclic Guanisine Monophosphate CNP C-Type Natriuretic Peptide
ENOS Endothelial Nitric Oxide Synthase GC Guanylyl Cyclase
GC-A Guanylyl-Cyclase-A Receptor GCR Guanylyl Cyclase Receptor CF Growth Factors
GPCR G-protein Coupled Receptors GSK3 Glycogen Synthase Kinase HS Heart Specific
HSP Heat Shock Protein HW Heart Weight IFNy Interferon-gamma 1P3 Inositol 3 Phosphate
IP3R Inositol 3 Phosphate Receptor KO Knock Out
L-Type VOC L-type Voltage Operated Channel LV Left Ventricle
LVH Left Ventricular Hypertrophy MAPK Mïtogen Activated Protein Kinase
X
O
MHC I and IIMLC Class I and II Major Histocompatability ComplexMyosin Light Chain MLCK Myosin Light Chain KinaseMP Myosin Phosphatase
NFAT Nuclear Factor of Activated T-CeIIs NF-KB Nuclear Factor Kappa B
NO Nitric Oxide
NOS Nitric Oxide Synthases NP Natriuretic Peptide
Nppa Natriuretic Peptide Precursor A N P R-C Natriu retic Peptide Receptor-C PDE Phosphodiesterase
PE Phenylephrine
PI3K Phosphatidylinositol 3 Kinase
PKA Protein Kinase A, cAMP Dependant Protein Kinase PKB Protein Kinase B
PKG cGMP dependent protein kinase PLC Phospholipase C
RT-PCR Reverse Transcriptase-Polymerase Chain Reaction RyR Ryanodine Receptor
SERCA Sarco(Endo)plasmic Reticulum Ca2+ -ATPase SMC Smooth Muscle Ceils
SR Sarcoplasmic Reticulum TAC Tansverse Aortic Constricion TG Transgenic
TNF-a Tumor Necrosis Factor Alpha VSMC Vascular Smooth Muscle CeNs
Remerciements
First, I wouid like to thank my research director Dr Christian Deschepper, for welcoming me into his Iaboratory and for his support throughout the project.
Catherine Legault, for being such an excellent summer student, and for her help with experiments. Also for being a good friend and ail 0f the great laughs.
Sofia Bélanger for her superior technicai advice on mice and for spending the time necessary to show me the new mouse manipulations needed for the transition from conventional surgery to SPF surgery.
Nadia Fortin for teaching me the Abdominal Aortic Constriction surgery in the conventional unit.
Juile D’Amours, Michel Robillard, Quing Zang Zhu, Stéphane Matte, Richard Cimon for their heip in setting up the surgery in the SPF.
I wouid equally thank Johanne Duhaime and Rob Sladeck for their time and help in understanding the Affymetrix related programs.
Fatme Samhat for her excellent friendship, support and perspective, she is somebody I’ve learnt a lot from in the past year and a half.
Thanks to Ahmad Zahabi for happily giving me access to any solution that I needed, whenever I needed it and most of ail for the comic relief.
A warm thank-you to the rest of my lab Bastien, Emmanuelle, Sylvie, Marie-Line for their encouragement and lunch time chats.
Vivianne Jodoin for her patience with my many questions, caiming personaiity, and advice.
I would also like to thank my famiiy, et ma belle famille, for their continuai support and love.
Above ail, I wish to thank my wonderful husband Marc Germain, for always believing in me and giving me the love and support necessary to pass over aIl of the hurdies that came in my way.
I dedicate this work to my brother Jamie Michel and my baby (due October), for if there were a way that I couid undo, even a portion of, everything that happened to him or prevent it from ever happening to you I most certainly wouid.
1
Introduction
Cardiac diseases
The heart primarily functions to circulate oxygen to the tissues of the body
at a rhythm that meets the metabolic demands of its cellular components.
Continuai biomechanical stress placed on the heart can induce changes
within the myocytes that iead to inadequate pumping and uitimately to
cardiac diseases, one 0f the major causes of morbidity and mortality in
North America (1). Left ventricuiar hypertrophy (LVH) has emerged in
recent years as an independent risk factor for morbidity and mortality
linked to cardiac diseases and has therefore become an important
predictor of disease outcome (2). LVH is characterized by the overgrowth
or excessive deveiopment of the Ieft ventricle (LV). it is multifactorai in
nature; primary risk factors include underiying disease state
(hypertension, diabetes, hyperthyroidism, obesity) and lifestyle choices
(sedentariness, diet, consumption of aicohoi or tobacco) (3-7). in addition,
disease pathogenesis is infiuenced by multiple genetic susceptibility loci
which account for 60-70% of the variabiiity (8).
LVH can be spiit into
two
broad categories. The first is concentric LVH,seen in pressure-overioad induced hypertensive states. The second,
eccentric LVH, is induced by voiume-overload and is typically seen in
valve dysfunction (9). At a cellular ievei, LVH is characterized Iargeiy by
an increase in ceIl volume, as seen under the light microscope, rather
than number of celis due to division (10).
It is generally believed that LVH develops to preserve contractile function
when cardiac workload is chronically increased. Development of LVH is
thus viewed as beneficial, at least in the short term, as it allows the heart
to deal with an increasing demand for contractile power (11, 12).
However, when LVH continues for an extended period of time, it can
become maladaptive, and lead to dilated cardiomyopathy, heart failure
and sudden death (13, 14).
As LVH is one of the most powerful independent risk factors for cardiac
disease (3), understanding the pathways that cause or prevent LVH is
important to improve treatment of these diseases. Recent work from our
laboratory has focused on the identification of genetic loci associated with
reduced LVH. This has led to the identification of the atrial natriuretic
peptide (ANP) pathway as an important modulator 0fLVH. In this chapter,
I will thus describe briefly the pathways that are involved in causing LVH
and give an overview of molecules involved in its prevention. Then I will
describe in detail the ANP signalling pathway, which has been extensively
implicated in the prevention of LVH and 5 0f particular interest to my
project.
3
O
Left ventricular hypertrophy
Ca2 signalling in the heart
Ca2 handiing plays a pivotai roie in catdiac homeostasis. It is the key signalling molecule invoived in initiating myocyte contraction and thus, changes in its signaiiing orchestrate a vast number of cardiac adaptations such as ceilular growth and strength of contraction (15). Activation 0f
myocardiai contraction begins with an action potential that depolarizes the myocyte celi membrane and activates L-type voltage operated channeis (L-type VOC) (16). This aiiows a small puise 0f Ca2 to enter the ceil and activate a ciuster of four to six ryanodine receptors (RyR) which release a spike of sarcopiasmic reticulum (SR) Ca2 (16). The Ca2 generated from this action wiII then activate the contraction of nearby sarcomeres. The signai is terminated when Ca2 is rapidiy removed from the cytoplasm by ionic pumps such as sarco(endo)plasmic reticulum Ca2tATPase 2 (SERCA2) in the sarcoplasmic reticulum and NaICa2 exchangers in the plasma membrane (15). Cytoplasmic Ca2 is aiso taken up by the mitrochondria via the mitochondriai Ca2 uniporter, which stimulates them to produce ATP, thus ensuring that there is enough energy to sustain the contraction (15, 17).
Influx and efflux of Ca2 are tightly controiied in cardiac celis such that there is no net loss or gain 0f Ca2
in
either the SR or the extracellularmilieu. This is of special importance due to the large flux of Ca2 at every
o
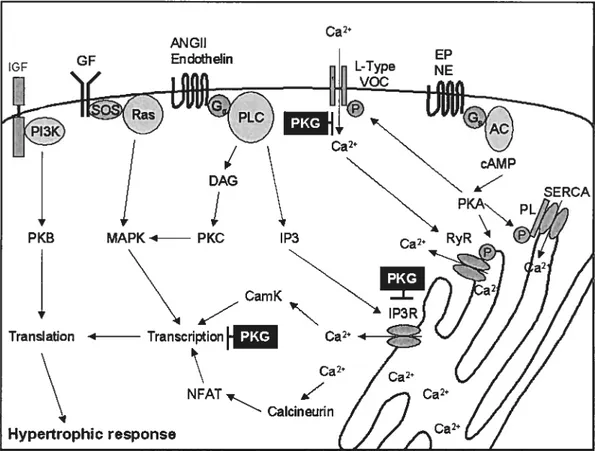
Figure 1.1 Mechanisms 0f cGMP-dependant protein kinase (PKG)action on Hypertrophic signalling. (PL) phospholamban, (AC) adenylate cyclase, (DAG) Diacylglycerol, (EP) epinephrine, (NE) norepinephrine
Ca2 released into the cytoplasm, modifications 0f the amplitude 0f a contraction are made possible by modulating SR Ca2 release (15). This is achieved by signalling pathways such as norepinephrine and their f3-adenergic receptors that are activated to modulate cardiomyocyte reaction to increased cardiac demand (18).
Hypertrophic stimuli
Hypertrophic signalling is intimately related to changes in Ca2 signalling (Figure 1.1). A rise in the amount 0f Ca2 released from the SR wiII not only increase the extent to which a cardiac fibre contracts but also has an
o
MAPK4 PKC
5
O
effect on basal transcriptional and transiational levels of the individualmyocytes (15).LVH is triggered by two major types of input: 1) mechanical stress and 2)
neural or humoral factors. Hypertrophy triggered by mechanical stress
involves the activation of stretch-activated ion channels (19). Details on
how this signal is mediated remain unclear but these channels likely
promote their effects through changes in intracellular Ca2 concentration.
Furthermore, mechanical stress can activate the expression of neural and
humoral factors involved in hypertrophy. A wide variety of neural and
humoral factors have been implicated in activating hypertrophic signais
(13). These factors include vasoactive peptides, catacholamines, growth
factors (GF5), cytokines and hormones (13, 19). Ultimately, these
pathways work toward increasing the basal amount of SR Ca2 released,
transcription of cardiac growth related genes, and an increased capacity
for the translation of these newly transcribed mRNA targets (figure 1 .1).
Several vasoactive peptides and catecholamines induce hypertrophy as a
consequence of their role in increasing the contractility of the cardiac
muscle. Catecholamines such as noradrenaline modulate cardiomyocyte
Ca2 signalling through activation of G-protein coupled receptors (GPCR)
linked to an adenlylate cyclase, resulting the activation of PKA (18, 19).
PKA phosphorylates L-type VOC and RYR2, increasing their ability to release Ca2 into the cytosol (20, 21). Another effect of PKA is the
o
(22). This permits an increase in the concentration of Ca2 in the SR, and thus allows more Ca2 to be released upon each contraction.
A second pathway leading to increased SR Ca2 release is activated by vasoactive peptides such as angiotensin Il (ANGII) and endothelin. These molecules activate a GPCR coupled to phospholipase C (PLC). Activation of PLC resuits in an increase of 1P3 which will stimulate SR Ca2 release by the 1P3 receptor (IP3R) (23).
Transcriptional effects of hypertrophic stimuli
An increase in Ca2 not only boosts the strength of cardiac fibre contraction, but also has an effect on transcription. Free Ca2 can bind to Calmodulin (CaM), evoking the activation of a phosphatase called calcineurin (24). One of calcineurin’s functions is to activate the transcription factor Nuclear Factor of Activated T-CeIIs (NFAT) (25). Calcineurin and NFAT play a prominent role in hypertrophic responses. For instance, transgenic models that overexpress of calcineurin, or a constitutively active nuclear form of NFAT, lead to cardiac enlargement (26). Ca2 is also able to activate Ca2I CaM-dependent kinase Il (CaMKII) which translocates to the nucleus and phosphorylates class Il Histone Deacetylases. This wiII remove them from the nucleus and allow transcriptional activity of myocyte enhancer factor-2 (27). The importance of these proteins in hypertrophy have also been demonstrated using animal models (28-3 1).
7
In addition to these effects on Ca2 homeostasis, some hypertrophic
stimuli such as growth factors can activate cardiac ceil growth through
activation of MAPK cascades (13). A third effect of hypertrophic stimuli is
the regulation of translation through activation of
Phosphatidylinositol-3-Kinase (PI3K) by 3- and Œ- adenergic receptors as well as IGF-1(32-34).
PI3K’s main cellular mediator is protein kinase B (PKB). PKB activates
p7OS6 kinase and mammalian target of rapamycin which increases
cellular translation via the 56 subunit of the translational machinery. PKB
also phosphorylates glycogen synthase kinase (GSK3) thereby
inactivating it (35). This inactivation event has two roles; first, GSK3
inactjvates transcription factors involved in cardiac growth, such as
NFAT3 (36) and GATA4 (37), by promoting their export from the nucleus.
Second, GSK3 phosphorylates eukaryotic initiation factor 2B, inhibiting
protein translation (38). Hence the inactivation of GSK3 will enhance both
transcription and translation.
Changes in gene expression and protein activation induced by
hypertrophic stimuli lead ultimately to cellular growth in the absence of
cellular division (19). At the molecular level, the first changes seen within
celis are a rapid, yet transient, activation 0f what is known as the
“immediate early genes” (c-fos, c-jun, c-myc, egr-1, and HSP7O). These
genes are normally implicated in the regulation of celI cycle and
proliferation. However, as cardiomyocytes are terminally differentiated
Following this initial response, there is a te-induction of the cardiac “foetal
C
‘,..gene program which ncludes 3-myosin heavy chain, a-skeletal actin, as weII as ANP and B-type natriuretic peptide (BNP). Other changes include an upregulation 0f constitutively expressed contractile proteins such as cardiac muscle a-actin and ventricular myosin light-chain-2 (39). AIso accompanying LVH is a decrease in the expression of the sarco endoplasmic reticulum Ca2-ATPase 2a (SERCA2a) (40). These ptoteins have been widely used as biomarkers for deciphering hypertrophic celis from regular cellular growth(10, 19).
How exactly these changes in expression affect celis and bring about hypertrophy is not completely clear. In fact, among the biomarkers of myocardial hypertrophy are factors and signalling pathways, such as ANP, equally implicated in the negative regulation of hypertrophic effects. Other pathways implicated in the negative regulation of hypertrophy are nitric oxide (NO) and bradykinin.
NO and ANP: anti-hypertrophic signalling modules
Nitric oxide (NO) is synthesized from L-arginine by one of three nitric oxide synthases (NOS) isoforms (endothelial (eNOS), inducible (iNOS) and neuronal (nNOS)) ail of which are found in the heart and can inhibit cellular growth in several different types of cells. NO modulates a large variety of physiological functions among which are regulation of vascular
9
tone, neurotransmission, immune ceil mediated cytotoxicity, as well as contractility of cardiac muscle (41).
In addition, accumulating evidence suggests an anti-hypertrophic role for NO. For example, TG mice which overexpress eNOS in vascular endothelial celis are hypotensive and protected from LVH (42). Other evidence that NO plays a role
in
protection from cardiac myocyte hypertrophy was given by experiments on the bradykinin pathway, which activates the cellular production of NO. These experiments showed that the bradykinin-NO pathway has a role in protecting cardiac myocytes from hypertrophic stimuli in rat cardiomyocytes (43). This protective effect of bradykinin appears to be the consequence of stimulation of NOS (and thus, production of NO) in endothelial ceNs (44). Knock-out (KO) of the bradykinin receptor promotes development 0f cardiac hypertrophy in vivo(45). More recent experiments have shown that bradykinin can also prevent acute hypertrophic responses in isolated perfused rat hearts, and this was shown to be accompanied by a significant increase in LV cyclic GMP (cGMP) (46). One 0f the downstream effectors of NO is cGMP,
which results from the stimulation of soluble guanylyl cyclases (GCs).
A second protective factor is ANP, which also mediates its effects through induction of cGMP. ANP activates a second type ofGC, membrane bound guanylyl cyclase receptors (GCRs). Abundant evidence indicates that cGMP can act as a anti-hypertrophic agent. For instance, a synthetic analog of cGMP (8bromo-cGMP) has been shown to prevent hypertrophy
Q
in cultured rat cardiac myocytes (47). In addition, ANP (and/or its secondmessenger cGMP) blocks the hypertrophic response of cultured neonatalcardiomyocytes and aduit rat cardiomyocytes in vitro. (47, 48).
The natriuretic peptides
ANP is
a
member ofa
family of peptide hormones called the natriureticpeptides (NPs) that are involved in the regulation of blood volume and
blood pressure by direct effects on the kidney and systemic vasculature
(49) (see figure 1.2). Other family members include BNP and C-type
natriuretic peptide (CNP). Although ail of these peptides are referred to as
“natriuretic peptides” because of their relationship to ANP and its function
in the regulation of sodium excretion (natriuresis), they possess other
activities. In fact, CNP has no known natriuretic role as it is primarily
produced by vascular endothelial cells and the central nervous system
(but not by cardiomyocytes), and is involved in fleurai regulation as well
as control of vascular tone (50, 51). The other two NPs, ANP and BNP,
reduce blood pressure by promoting sait and water excretion in the kidney
(52), thereby decreasing blood volume. They also antagonize the renin
angiotensin-aldosterone system, a principal mediator of vasoconstriction,
sodium retention and cellular proliferation. These peptides reduce plasma
renin, ANG II (the end product of the renin system), and aldosterone
secretion (53, 54).
11
A distinct role for each NP
C
ANP can affect blood pressure by relaxing the vascular smooth muscle cells (VSMC5) of arterial walls, whereas CNP will relax mostly those of the veins (55). Although BNP has similar vasorelaxing properties as ANP, its plasma concentrations are much lower than that of ANP (49, 56). Furthermore, it has a lower affinity for their shared receptor, guanylyl cyclase-A (GC-A) (56). lndeed, it has been suggested that BNP may have another yet undiscovered receptor, due to the tact that GC-A KO mice retain a high affinity for cGMP responses to BNP in tissues such as the adrenal gland and testis, and these binding properties are flot due to any other known guanylyl cyclase receptor (GCR) (57). In fact, the phenotype cf the BNP KO mice indicates that BNP might have a function distinct from that cf ANP. These mice do not have hypertension nor hypertrophy (as observed in the ANP KO), but display extensive cardiac fibrosis (58). This suggests that the main role of BNP may possibly be that of a paracrine antifibrotic factor. A distinct role for BNP is also suggested by the tact that it has less potent vasorelaxing properties than ANP (56). The autocrine/paracrine role played by ANP in the heart inhibits cardiomyocyte growth and stimulates diastolic relaxation (59).
Natriuretic peptides have the ability to regulate celI growth and proliferation (60-64). 0f particular interest, this has been shown for vascular smooth muscle cells (65), cardiomyocytes (66) and cardiac tibroblasts (67). The antiproliferative effects of NP5 can be mimicked by
8-bromo-cyclic GMP (66). Some data suggest that the growth inhibiting
effects of cGMP, ANP and NO in cardiac myocytes and fibroblasts are
mediated in part by the inhibition of Ca2 influx (47).
Expression ofANP and BNP
In healthy aduits, ANP and BNP are predominantly produced in atria,
stored in atrial granules as precursor prohormones, and secreted by atrial
myocytes (68, 69). ANP is aiso present in the ventricies of the developing
embryo and foetus, but its ventricular expression declines rapidiy during
the perinatal period (70). BNP is also present in the early stages of
cardiac morphogenesis (71), but the decline in ventricular expression of
BNP in aduits is not as pronounced as that 0f ANP (49). Indeed,
ventricular expression of BNP continues throughout aduithood. The main
trigger for the cardiac production and release of ANP is an increase in wall
stretch and pressure (72). BNP secretion is however a reflection of LV
overload (73).
Synthesis ofANP
Ail three NPs are synthesized and stored as precursor prohormones and
contain a core structure which includes a highiy conserved internai
sequence of CFGXXXDRIXXSGLGC (54). This sequence produces a ring
structure through the formation of a disuifide bond between
two
cysteineresidues, which is necessary for receptor recognition and biologicai
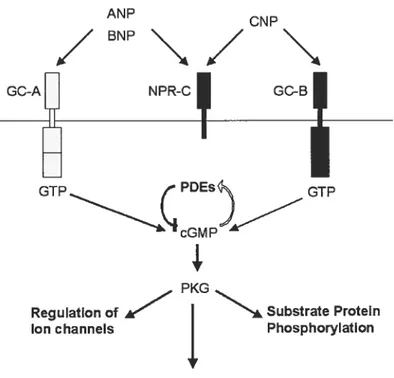
ANP CNP /BNP\/ GC-A NPR-C GC-B GTP PDEs GTP cGM PKG
Regulation of Substrate Protein Ion channels Phosphorylation
Gene expression
Figure 1.2 The Natriuretic Peptide Family Signalling Pathway.
ANP preprohormone is composed of 151 amino acids. From this, the
N-terminus is removed in the endoplasmic reticulum, leaving a 126 amino
acids prohormone ANP for storage in granules in the atrial
cardiomyocytes (54). Once released, pro-ANP is converted to the
biologically active ANP by proteolytic cleavage. This cleavage is a critical
step in the regulation of ANP activity and produces the biologically active
fragment from the Carboxyl-terminal (C-terminal) end of the fragment (75).
The processed peptide of ANP is also known as atrial natriuretic factor.
Processing is similar for BNP and CNP (54). One of the serine proteases
shown to have the ability to convert pro-ANP into ANP is Corin (76) (atrial
Q
specific serine protease ATC, LDC receptor-related protein). Corin, is acardiac specific serine protease. The cleavage in pro-ANP by corin ishighly sequence specific (76).
NP
receptors
ANP can bind to the GC-A receptor, which is thought to be the main
functional receptor for ANP (figure 1.2). The other ANP receptor is the
natriuretic peptide receptor C (NPR-C), whose main function is the
clearance of NPs and wiII be described below. Both receptors are found in
myocardium and fibroblasts (77, 78). GC-A is
part
of a family of receptorswhich also include the receptor for CNP (GC-B;NPR-B), a receptor for
bacterial heat stable enterotoxins involved in the uptake 0fwater and sait
in the intestine as weil as epithelial ceil growth and differentiation (CC-C)
and finally the orphan receptors Guanylyl Cyclase-D, E, F and G (79-8 1).
These latter mentioned receptors are implicated in the senses of smell
and sight (82).
As stated above, CC-A is preferentially activated by ANP and BNP,
whereas CNP activates GC-B. BNP is known to interact with the CC-A
receptor, but evidence indicates that it may activate another unknown
receptor. Indeed, the amino acid sequence of BNP is different among
species (human, rat and mice) and some tissues of the CC-A Knock out
mice retain significantly high affinity cCMP responses to BNP (57, 82). To
15
date, the identity of that putative alternative BNP receptor has not been
L
elucidated yet.
Structure of the GC receptors
AIl of the GCRs are coupled to a cytoplasmic C-terminal guanylyl cyclase
catalytic domain and signal via formation of cGMP. GCRs are single
transmembrane proteins consisting of a single extracellular domain, a
transmembrane domain and two intracellular domains separated by a
hinge (82). Glycosylation of the residues located at the N-terminal end of
the 440 amino acid extracellular domains of GCRs are common in aIl
GCRs except GC-F, although functional consequences of this remain
controversial (83). It is possible that glycosylation plays a role in ligand
binding, folding and/or transport 0f particulate GC5 to the membrane.
However, in the case 0f ANP, enzymatic deglycosylation has had no
significant effect on ANP binding (84). There have also been reports of
tissue specific glycosylation of GC-A but no known function has yet been
determined (85). AIl Membrane GCR5 contain
two
intracellular domains:the kinase homology domain and the guanylyl cyclase domain. The
kinase homology domain of approximately 250 amino acids immediately
follows the transmembrane domain and is believed to modulate the
enzymatic activity 0f the C-terminal guanylyl cyclase domain (82, 86). It
contains six residues that can be phophorylated in the intracellular
juxtamembrane region which are in close proximity to a putative ATP
required for receptor activation (88). This putative ATP binding domain
contains a consensus ATP binding motif found in many protein kinases.
No kinase activity, however, has been detected. Although ATP is required
for maximal NP-dependent activation (89), and the putative ATP binding
site in the kinase homology domain is suspected for its binding, the exact
location of ATP binding has not been solidly determined possibly because
the association of ATP to the receptor is too loose to obtain positive
binding or cross-linking results (90).
The kinase homology domain is separated from the 250 aa Guanylyl
cyclase C-terminal domain by a 41 aa amphipathic coiled-coil hinge
region that is involved in higher order oligomerization (91). Formation of
homodimers or homotetramers is essential for the activation of the
catalytic domain of CC-A and CC-B (92).
The proposed model for activation of the CC-A receptor is that in the
absence of NP, the receptor exists as a homodimer or homotetramer that
is highly phosphorylated and guanylyl cyclase activity is tightly repressed
(90) ANP presumably facilitates ATP binding to the kinase homology
domain, leading to a conformational change in the hinge region of the
receptor (89, 90, 93). This allows the removal of the inhibitory effect of the
kinase homology domain on the guanylyl cyclase domain, leading to their
association and activation (90). This is followed by an increase in the
disassociation of ANP from the receptor and a conformational change in
17
thereby inactivating the receptor and decreasing its sensitivity to further
stimulation by ANP (90).
Elimination
Elimination of the natriuretic peptides from circulation is known to occur by
two mechanisms; First, metabolism by an enzyme called neutral
endopeptidase, which is mostly found in the brush border of the proximal
convoluted tubule of the kidney and also in lungs, intestine, seminal
vesicies and neutrophiles and second by cellular internalization after
binding to a specific clearance receptor NPR-C (94, 95).
NPR-C
NPR-C is a subclass of GCRs which iacks both intracellular domains.
lnstead, it has a 37aa intracellular domain that shares homology with neither GC-A nor GC-B (96). As stated above, this receptor is capable of
internalizing ail of the NPs (ANP,BNP and CNP) and delivers them to
lysosomes for degradation. NPR-C, in the case of renai action, was considered to be biologicaily silent. Thus, its proposed function was the sequestration and metabolic clearance of ANP (95). However, ANP was
shown to inhibit cAMP production in cuitured thyroid cells, which
exclusively express NPR-C. This suggested that NPR-C might also have
some signalling properties (97). It has since been reported that ANP mediates inhibition of adenylyl cyclase activity in the heart and aorta of __
A synthetic peptide containing the 37aa intracellular domain of NPR-C has
been shown to inhibit adenylyl cyclase activity in cardiac muscle membranes (100). This inhibition of adenylyl cyclase activity may possibly explain some of the hypertrophic actions 0fANP. However, it is not known
whether NPR-C plays any role in cardiac hypertrophy.
Downstream targets of cGMP
Effects cf the membrane GCRs are presumably ail mediated by the synthesis of cGMP as an intracellular signalling molecule, which then modulates the activity of specific target proteins. One 0f these targets is
Phosphodiesterases (PDE), which are involved in the degradation 0f
cGMP and cAMP (41). It is thought that changes in PDE activity due to activation by cGMP, alter cAMP and cGMP levels by increasing or decreasing them, depending on the type 0f PDE expressed in the ceil
(101). Another PKG target is the cGMP gated nucleotide channels which are essential for signal generation in sensory organs (102).
However, the major mediator of cGMP action in the celI is thought to be Protein Kinase G (PKG) (103, 104). There are
two
different PKG genes known to modulate different physiological functions of cGMP, PKGI and Il. PKG I hastwo
isoforms, la and l; la being the only PKG found in the heart (105). PKGIa exists in the cytosol as homodimers bound together and kept inactive by the N-terminal domains of the individual PKG proteins (102). Once activated, PKG phosphorylates target proteins in the19
cytosol. In general, the action of PKG has been best elucidated in smooth
muscle ceils (SMCs) where it is involved in muscle relaxation. In these
cells, activated PKG phosphorylates ion channeis, pumps, receptors and
enzymes, resuiting in a decrease in intracellular Ca2 as weII as sensitivity
to Ca2 signais (106) (see figure 1.1).
PKG and Ca2 signalling
Among the ion channeis affected by PKG in the plasma membrane are
maxiK potassium channels, L-type VOC and the Ca2+ ATPase pump.
MaxiK channels are activated by Ca2 and allow the efflux of potassium
from a celi. This hyperpolarizes the plasma membrane and causes the
ciosure of L-type VOC, thus inhibitïng Ca2 entry into the cell (107).
Blocking maxiK channels using the specific inhibitor iberiotoxin partially
inhibits cGMP-induced SMC relaxation (108). There exists some evidence
that PKG can directly phosphorylate L-type VOC, leading to decreased
Ca2 entry and SMC relaxation (109). However, PKG’s direct involvement
in the modification of L-type VOC activity is not yet compietely clear. In
addition, it has been suggested that PKG may influence increased Ca2
export from the cell via the indirect activation of the Ca2 ATPase pump,
through either an intermediate protein or the generation of phosphatidyl
inositol-4 phosphate (106).
PKG’s effect on the uptake of cytosolic Ca2 by the SR is believed to be
carried out by changes in SERCA2 and IP3R activity. At the level of the
SR, phosphorylation of phospholamban by PKG results in an increase in
SERCA2 activity (110). In addition, PKG phosphorylation reduces IP3R
activity both directly (111), and through the activation of the negative
regulator of IP3R, IP3R-associated cGKI protein (41, 112). A more indirect
effect of PKG on cytosolic Ca2 is also carried out thought inhibition of 1P3
synthesis. It is however unclear whether the mechanism for this effect is
through inhibition of GCPR or PLC (41).
Effects of PKG on the contractile machinery
Another effect of PKG leading to SMC relaxation is the decrease in
sensitivity cf the contractile machinery to Ca2 (106). Muscle contraction is
dependent on the phosphorylation of myosin light chain (MLC) by MLC
kinase (MLCK), this being triggered by a rise in cytosolic Ca2.
Desensitization by PKG is achieved through the inhibition cf MLCK and
the activation of myosin phosphatase (MP), which dephosphorylates MLC.
This is thought to occur indirectly through the inactivation of Rho, a small
G-protein which activates MLCK and represses MP to facilitate
contraction (41). Direct phosphorylation of MP by PKG may also Iead to
its activation (113). Modification cf the cytoskeletal architecture of SMC by
PKG has also been proposed in Ca2 desensitization through the Heat
shock protein 20 (HSP2O) (114, 115) which is a proposed regulatory
component cf the actin-based cytoskeleton. Induction of PKG in
cardiomyocytes also leads a reduction in Ca2 signalling and ceil
21
contractility. PKG targets in cardiomyocytes include L-type VOC as weIl
as troponin T which regulates actin/myosin interactions (116).
Effects of PKG on gene expression
In addition to its effects on muscle contractility, PKG has been shown to
modulate gene expression. For example, PKG can reduce the expression
of several hypertrophic biomarkers in cardiomyocytes following
hypertrophic stimuli (117). This could be achieved through at least three
mechanisms (figure 1.1). First, the phosphorylation of several ion
channels and pumps by PKG will decrease CaM-dependent activation of
calcineurin, thereby maintaining NFAT inactive in the cytosol (118). PKG
can also affect the Rho dependent activation of serum response factor by
inhibiting the activation of Rho downstream of growth factor receptors and
GPCR (104). Finally, PKG is capable of increasing NF-kB DNA-binding
activity both directly by phosphorylation of the NE-kB subunits p50 and
p65 as well as indirectly through the phosphorylation and subsequent
degradation of the NE-kB inhibitor 1kB-a (119). This has been linked to
expression of TNF-Πin cardiomyocytes (119). In addition, several other
pro- and anti-proliferative pathways have been shown to be modulated by
the various PKG isoforms in various tissues (117).
Disease state
Under normal conditions, ANP is expressed and released from the atria of
pathological conditions, ventricular myocytes may undergo phenotypic modifications allowing them to produce ANP and secrete them into circulation as weIl (120, 121). Concentrations of both BNP and ANP were shown to increase in proportion to the severity of Ieft ventricular dysfunction. This release cf ANP was originally thought to exert its effect on blood pressure and blood volume. However, information derived from several transgenic (TG) and knockout (KO) animal models have made it clear that ANP (but not BNP) can regulate cardiac mass via a direct action on cardiac celis (as outlined in Table 1.1).
In vitro evidence for a role ofANP in preventing hypertrophy
Originally, studies using animal KO models had shown that deficiency in ANP or GC-A lead to an increase in blood pressure as well as cardiac mass. At first, this increase in mass was thought to be a consequence of the increased blood pressure of these animaIs (122-124). In vitro evidence has since emerged supporting a role for ANP in the regulation of the hypertrophic response. ANP (as well as its second messenger cGMP) can block the effects of hypertrophic stimuli in rat neonatal cardiomyocytes (47, 48). In these conditions, a GC-NGC-B inhibitor (HS 142-1) was able to block the anti-hypertrophic effect of ANP, suggesting that the anti-hypertrophic effect of ANP is mediated through activation of its receptor (48). Further investigation conducted on aduit rat cardiomyocytes (which presumably resemble more cardiomyocytes found in the heart of aduit animais) Ied to similar conclusions (66).
23
Gene Type of
. Characteristics Ref.
targeted targeting
- Increased HW/BW
- Increased blood pressure with increasing dietary sait (122,
ANP KO intake 125, 126)
- Exagerated response to TAC, including increase in
HW/BW ratios
- Increased Biood pressure that is resistant te changes in
sait concentration
- Increased HW/BW throughout post-natal life, and
KO independent of blood pressure (when controlled by drugs) 12.7
- Exaggerated response to TAC; including increase in
128) HW/BW ratios and increase in chamber dilation, decrease
in cardiovascular function
- Decreased survival
GC A -Slightly hypotensive animais
KO HS - Increase in HW/BW (59)
- Decrease in cardiovascular function after TAC - Exaggerated HW/BWin response te TAC
TG HS - Decreased HW/BW (129)
- No difference in blood pressure
KO - No difference in HW/BW compared to GC-A KO
X - No difference in blood pressure compared to CC-A KO (129)
TG HS - Decreased cardiomyocyte area compared to CC-A KO
Tabiel.1 Animal Models in the ANP signailing pathway. (HS) heart specific, (TAC) transverse aortic constriction, (HW) heart weight, (8W) body weight, (TC) transgenic.
Animal models
In addition to these in vitro studies, experiments using mice with deletion
of the gene coding for ANP (Nppa KO) have revealed that when these
mice are fed an extremely Iow sait diet (0.05% NaCi and 0.7% Ca2j, they
have a significant increase in heart weight compared to that of wiid type
counterparts (125). This change in cardiac mass appears to be
independent 0f biood pressure. Another group of investigators have
shown that CC-A deficient mice resuit in animais with eniarged hearts
from the time of birth. This indicated that heart size is iikely to be independent cf blood pressure, since biood pressure
in utero
is iargeiy controlled by the mother (128). in addition, experimentai induction of pressure overioad through transverse aortic constrictions (TAC) in these GC-A KO mice leU to increased hypertrophy as compared to wild-type animais. Such differences were stili observed even when a wide variety cf anti-hypertensive drugs were used in order to control blood pressure. This indicates that the sensitivity of these mice to cardiac hypertrophy is independent of their blood pressure (128). In another study of interest, CC-A was inactivated specificaiiy in the heart using the LoxP/Cre recombination system. These mice have a siightiy iower biood pressure than their fioxed CC-A lillermates, along with a significant increase in the heart weight / body weight (HW/BW) ratio (59). One iast animal model worth mentioning is an animal created by the Kishimoto group. This mouse was created by crossing a GC-A deficient mouse with a TG mouse overexpressing CC-A specificaiiy in the cardiac myocytes. This resulted in a mouse une which expressed GC-A solely and specificaiiy in the heart (129). This group showed that the CC-A transgene expressed within the cardiac myocyte was insufficient to significanfly Iower blood pressures of either wiid type or CC-A KO mice (129). The transgene did however, have a significant effect on iowering cardiomyocyte size. Thus, mounting evidence points to ANP playing a roie in the reguiation of cardiac mass.25
Project background
Previous studies in our Iaboratory have revealed that the cardiac mass in Wistar Kyoto hyperactive rats (WKHA) is 10% higher than that in Wistar Kyoto rats (WKY) and that the concentration of left ventricular ANP is inversely correlated to heart size (130). This difference in size is independent of blood pressure as both strains have similar blood pressures (130). Generation 0f a F2 progeny resulting from the cross of WKY and WKHA rats was thus used in order to map qualitative trait loci (QTL) linked to both ANP ventricular concentration and cardiac mass. Resuits from these studies revealed that QTLs overlapping the Nppa
locus on rat norvegius chromosome 5 (RNO5) were Iinked to both traits. Moreover, sequence analysis 0f the 650 nucleotides upstream of the
Nppa gene that make up the minimal promoter revealed two single nucleotide polymorphisms (SNP5). One of these 2 substitutions was shown to reduce significantly the transcriptional activity of the minimal promoter (131). Lastly, these changes in sequence bring about changes in ANP concentrations that make functional sense. Evidence that ANP could possibly protect the heart from hypertrophic stimui was, at the time, just starting to surface. Taken together, these result suggested that naturally-occurring polymorphisms that Iead to decreased ventricular expression of ANP can be associated with increases in Ieft ventricular mass.
As a follow-up to these studies, our Iab created a transgenic mouse model
C
...that overexpressed specifically in the heart a constitutively active guanylyl
cyclase domain from the GC-A receptor (GC-Transgenic). These mice
showed an increase in cytosolic guanylyl cyclase activity 0f about 4 fold
compared to their non-transgenic counterparts and a 2.2 fold increase in
cGMP concentrations. Under normal conditions, no differences were
found between the GC-Transgenic mice and their WT littermates for the
HW/BW ratios, nor any other physiological/morphological parameters considered. However, when challenged with an stress such as
Isoproterenol fa well known model of induced cardiac hypertrophy without
systolic hypertension f132)) or abdominal aortic constriction (AAC), the
transgenic hearts were significantly smaller than the non-transgenic
controls (133, 134).
Project overview
Activated PKG, which is thought to be the main effector of cGMP, appears
to have cardiac anti-hypertrophic eftects, presumably through changes in
Ca2 handling and/or cytoskeletal arrangement. There is evidence that
PKG may play a role as weII in changing transcriptional patterns.
However, information about the effects 0f PKG and cGMP on gene
transcription is stiil minimal, In our laboratory, we have generated a
mouse that overexpresses in the heart the guanylyl cyclase domain of the
GC-A receptor, and have shown that these mice are protected from
27
changes in expression at the transcriptional level in our GC-Transgenic mouse would be one of the mechanisms that contributes to the this protective effect. In order to investigate this question, we compared the expression profile of cardiac genes in GC-Transgenic mice to that of their wild-type (WT) littermates, using Affymetrix DNA arrays.
o
Chapter 2:Materïal and Methods
Animais
Both animal modeis with gene inactivation (Nppa’ and lFNy) were
purchased from Jackson Laboratories (122, 135). The GC-Transgenic
animais were created in our lab as described (133). Ail mice are on a
C57BL/6 background. Animai procedures were approved by the IRCM
Animai Care Committee and conducted according to the
recommendations of the Canadian Council on Animal Care. In addition, ail
mice used in these experiments were kept in the SPF mouse facility.
Tissue coiiection
Animais were first killed by cervical dislocation and body weight was
measured when required, for example with the AAC. Atria were removed and discarded whiie the heart was stiil beating. The ventricies were then
excised by cutting at the base of the heart, and dissected into their ieft
and right components (right ventricie was removed from the left ventricle).
The ieft ventricie inciudes the inter-ventricular septum. Left ventricles were
weighed separately from the right ventricles and quickly ftozen in Jiquid
nitrogen. Thymus, lung, liver, spleen, kidney and skeIetai muscle were
aiso removed, weighed and frozen in iiquid nitrogen. Tibia were removed
and kept on ice. Ail tissues were stored at —8OC with the exception of tibia
29
Extraction of total RNA from tissues
Q
RNA was prepared from tissues of male mice using a modified version of the method described by Chomczynski
et
aI. (136, 137). Briefly, tissues were first powdered in liquid nitrogen using a mortar and pestle, thenhomogenized in
4
M guanidium-isothiocyanate, 25 mM sodium citrate,0.5% N-Lauroylsarcosine, 0.7%
13
-mercaptoethanol using a Polytron(Brinkmann instruments co.). RNA was extracted using 0.1 volume of 2 M
NaOAc, I volume of water (or citrate) saturated phenol, and 0.2 volume of
chlorophorm-isoamyl alcohol (49:1) followed by centrifugation at 10,000 x
g for 15 minutes. RNA in the supernatant was then precipitated with an
equal volume of isopropanol, followed by a second precipitation in 4 M
LiCl to improve the purity. Finally, RNA was extracted using an equal
volume of chloroform and precipitated in 100% ethanol and 0.1 volume of
3 M NaOAc overnight at —80CC. Total RNA was then redissolved in sterile
water and the concentration measured by spectrometry at 260/280À.
Small working aliquots of 20 pg were diiuted in sterile water ta 1 pg/pl for
future use. AIl RNA, stocks and working aliquots were kept at —80CC.
Affymetrix
chip analysisA total of 5 hybridizations were completed with total RNA samples from the left ventricles of twa transgenic and three non-transgenic mice housed in the SPF facility. Ail hybridizations were per[ormed on MGU74A affymetrix chips which represented more than 12,000 mouse genes and
ESTs from the IMAGE clone bank were faulty and were thus removed from the analysis. Affymetrix chips are created using photolithographic technology methods similar to the production of computer chips (138). Affymetrix chips contain oligonucleotides (probes) of 25 base pairs in length that are synthesized directly onto the surface of the chip. There are two different types of probes, those that match the gene target sequence exactly, known as the perfect match (PM), and partner probes whïch have a single base pair mismatch in the middle of the probe, cailed the mismatch probe (MM). Each gene is represented by a series of 11-20 probe pairs (PM and MM) known as a probe set. Intensity values for each probe set were obtained from the Affymetrix MicroArray Suite (MAS) 5.0 software package. In order to define a measure cf expression that represents the amount of mRNA for a corresponding gene, it is necessary to summarize the intensities of the probes in each of the probe sets. There are several different programs on the market designed to accompiish this, including MAS, dChip and Robust Muiti-Array Analysis (RMA). However, RMA has been shown to have better precision, with a smaller standard deviation at ail levels 0f expression. In addition, RMA has been shown to be more consistent in estimates of foid change (139). Thus, resuits of the MAS analysis were then normalized using the RMA p rog ram.
One problem with microarrays arises when performing statisticai analysis. Due to the large quantity of data generated, it is difficuit for conventional
31
statistical methods to be relevant given that even a p-value of 0.01, when
measuring J 0,000 genes, would identify 100 genes by chance. This
dilemma led to the development of Significance Analysis of Microarrays
program (SAM) (140). The SAM program computes a statistic for each
gene by measuring the strength of the relationship between the gene
expression and the standard deviation of repeated measurements for that
gene. At the same time, SAM uses repeated permutations of the data to
determine if the expression of any gene is significantly related to the
response. This allows to estimate of the number of genes that could be
found by chance which is given by the false discovery rate (FDR). Thus,
statistical analysis of the data was performed using SAM 1.10. SAM also
allows for the user to determine the cut-off of significance by adjusting the
parameter Delta, which allows the user to cut off the list at an FDR which
they are comfortable with. The analysed data were viewed and organized
using the Genespring 5.0 software package.
Northerns
Northerns were carried out according to (141).
Gel and transfer
5 pg aliquots (or 3 pg in the case of blots using samples from Nppa’
mice) were dehydrated using a Speed-vac (Savant) and redissolved in
0.065 pg/pL ethidium bromide, 0.01 M MOPS (Sigma), 10 mM NaOAc
and 1 mM EDTA. Samples were thon incubated at 65°C for 5 mm, and 5%
Q
added before loading samples ontodeionized formaldehyde. Samples were migrated at either 65 V for 31% agarose gel containing 6.16%hours or 20 V overnight. Gels were then washed twice with sterile water and 3 times in 1OX SSC (1.5 M NaCI and 1.65 M Na citrate). RNA in the gel was subsequently transferred to a Gene Screen Plus membrane (Perkin Elmer) overnight using JOX SSC. Membranes were washed with 2X SSC (0.3 M NaCI and 0.3 M NaCitrate) and baked 2 hours in a vacuum oven at 80°C.
Probes
Two different types cf probes were used to probe RNA hybridized membranes: some corresponded to inserts cut out from a plasmid containing the cDNA, and others were prepared by RT-PCR amplification of total RNA. For details on each probe please see table 2.1.
Gene Length of Source of Restriction Enzyme to Probe probe remove insert ANP (Rat) 750 bp Plasmid EcoRl/Hindlll B2-Microglobulin(mouse) 405 bp PCR N/A
GC-Cat (Rat) 948 bp Plasmid BamHl/Hindlll Table 2.1 Summary of probes used for Northern analysis
Amplification 0f a PCR fragment for the 2-microglobulin probe was carried out under the following conditions: 1 pL of cDNA in H20 containing 0.5 pM forward (Fwd) and reverse (Rev) primers (Qiagen), 1.5 mM MgCI (lnvitrogen), 0.2 mM denucleotides (Gibco), 0.5 units of Taq DNA
33
Polymerase (Invitrogen) in PCR buffer minus Mg2 (Invitrogen) in a final
volume cf 20 pI. This PCR mixture was subjected to the following PCR
program carried eut on the MJ research PIC-225 Peltier thermocycler:
Initial denaturing for 2 minutes at 94°C, followed by 30 cycles of 30
seconds denaturing at 94°C, 30 seconds of annealing cf primers at 55°C,
and 30 seconds of elongation at 72°C and finally at the end of the cycles
10 minutes cf elongation at 72°C.
In the case cf probes originating from a plasmid, inserts were removed
from the plasmid using the appropriate restriction enzyme(s) (see table
2.1). Probes were then gel purified using the Concert gel purification kit
(Gibco) according te manufacturers instructions and the quality cf purified
product was verified on a second gel (142).
Labelling of probes
Labelling of the insert was achieved through incubation cf the denatured
insert with the following reaction mix at 37°C: 0.1 mM dAGTmix (dATP,
dGTP, dTTP each), 10 ng/pL random primer (Invitrogen), 50 pCi 32P
labelled dCTP (Amersham Biosciences), 9 units Large fragment DNA
polymerase (Invitrogen) in React2 buffer (Gibco). After incubation for 45
minutes at 37°C, 20 pCi 32P labelled dCTP were added and Ieft at 37°C for
an additional 15 min. Upon completion cf the second incubation, the
enzyme was denatured in 0.03 M EDTA at 65°C. Labelled probe was then
O
significantiy diminished as verified by Geiger (surveyor 2000 Bicron).purified via sequential ethanol precipitations until background wasHybridization and washes
RNA bound membranes were prehybridized in 50% deionized formamide,
5X SSPE (0.75 M NaCI, 1.3 M NaH2PO4, and 12.6 M EDTA), 5X
Denhart’s solution, 1% SDS, and 0.2 mg/mL salmon sperm DNA for a
minimum of 8 hours. The amount of probe to be added to the hybridization
buffer (50% deionized formamide, 5X SSPE, 5X Denhart’s, 1% SDS, and
0.13 mg/mL salmon sperm DNA) corresponded to that necessary to yield
1x10⁶ cpm/ml of final solution. The prehybridized membrane was then
incubated in the hybridization solution overnight at 42°C. Following
hybridization, membranes were washed twice with 2X SSC at room
temperature and several times in iX SSC (0.15 M NaCI, 0.17 M
NaCitrate) containing 1% SDS at increasing temperature, until the
background on the membrane, judged by Geiger, had diminished
significantly.
Exposure and analysis
Hybridized blots were exposed to a phosphor screen cassette and the
signais were visualized and quantified using ImageQuant 5.0 software
and normaiized to the intensity of the ethidium bromide-stained 28S
ribosomai band in each sampie.
35
O
RT-PCR
Reverse transcription
RTs were carried out according to manufacturers instructions (Invitrogen).
Conditions used in the reverse transcription reactions for ail RT-PCRs in this work are as foliows. 2 pg of RNA were denatured by incubation for 10 minutes at 65CC in the presence of 0.025 pglpL oligo dT (Invitrogen). Denatured RNA was then transcribed in the presence 0f mM UNTP, 39 units RNAase Guard (Amersham Biosciences), and 200 units of Superscript II enzyme (Invitrogen) in first-strand buffer (Invitrogen) at 42C for one hour. The Superscript enzyme was then denatured at 7OC and cDNA sampies kept at 4°C until further use.
PCR
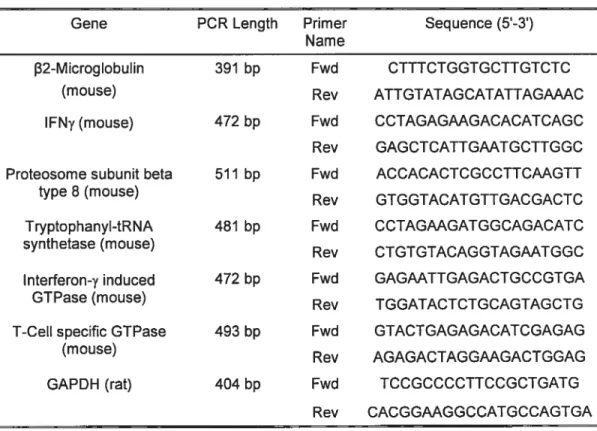
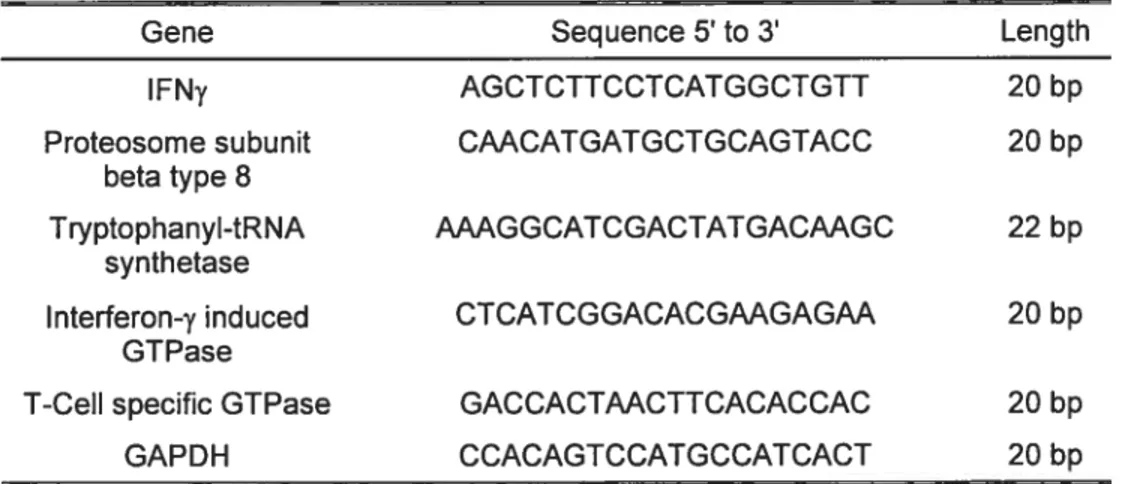
Since ail PCRs were performed on cDNA, primers were designed to cross over introns, thus avoiding any problems which may be caused by possible DNA contamination of the RNA. This technique makes any contaminating product difficuit to form and easy to visualize. PCR primers were designed for the following genes: IFNy, proteosome subunit beta type 8, T-ceII specific GTPase, tryptophanyl.tRNA synthetase, IFNy induced GTPase and GAPDH (see table 2.2).
o
o
Table 2.2 Summary of oligonucleotides used for PCR
Semi-quantitative PCRs
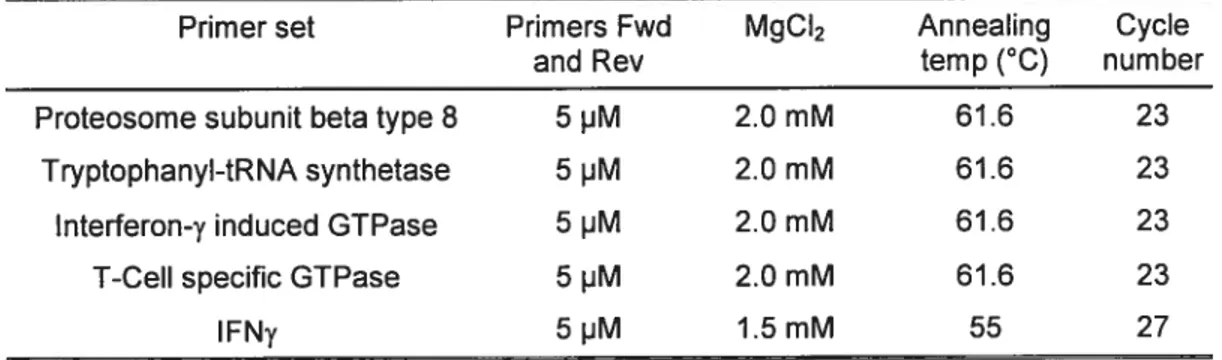
PCR reaction mix and programs
Optimal conditions for each primer set are reported in table 2.3. Each PCR was performed on 1 pI of cDNA and amplification mixture was carried out using 0.5 units 0f Taq DNA polymerase (lnvitrogen), in the presence of PCR buffer minus Mg2 (Invitrogen), and 0.2 mM deoxynucleotides in a final volume of 20 pI.
Optimal conditions for GAPDH were also determined and found to be in a range that encompassed ail of the above conditions. Thus GAPDH PCRs were performed under the conditions of the primer set in question.
Gene PCR Length Primer Sequence (5-3) Name
f32-Microglobulin 391 bp Fwd CTTTCTGGTGCTTGTCTC
(mouse) Rev ATTGTATAGCATATTAGWC
IFNy (mouse) 472 bp Fwd CCTAGAGAAGACACATCAGC Rev GAGCTCATTGAATGCTTGGC Proteosome subunit beta 511 bp Fwd ACCACACTCGCCTTCAAGTT
type 8 (mouse)
Rev GTGGTACATGTTGACGACTC Tryptophanyl-tRNA 481 bp Fwd CCTAGAAGATGGCAGACATC synthetase (mouse)
Rev CTGTGTACAGGTAGAATGGC Interferon-y induced 472 bp Fwd GAGAATTGAGACTGCCGTGA GTPase (mouse) Rev TGGATACTCTGCAGTAGCTG T-Cell specific GTPase 493 bp Fwd GTACTGAGAGACATCGAGAG
(mouse)
Rev AGAGACTAGGAAGACTGGAG GAPDH (rat) 404 bp Fwd TCCGCCCCTTCCGCTGATG
37
O
In order for the PCR to be semi-quantitative, it was pertinent that eachPCR for the use of quantitation be stopped during the linear growth phaseof the PCR reaction. Furthermore, it is preferable to then transfer the PCR product to a membrane using southern techniques so that the PCR products can be probed with a radioactively labelled probe which allows a greater sensitivity than visualization with ethidium bromide. Thus, PCRs were first performed at a range of cycle numbers and the optimal cycle number for quantification determined (also shown in table 2.3) and then probed in the same fashion as a southern (143).
Primer set Primers Fwd MgCI2 Annealing Cycle and Rev temp (°C) num ber Proteosome subunit beta type 8 5 pM 2.0 mM 61.6 23
Tryptophanyl-tRNA synthetase 5 pM 2.0 mM 61.6 23 Interferon-y induced GTPase 5 pM 2.0 mM 61.6 23 T-Cell specific GTPase 5 pM 2.0 mM 61.6 23
IFNy 5 pM 1.5 mM 55 27
Table 2.3.Summary cf PCR programs
Gel electrophoresis and transfer to nylon membrane
PCR products were resolved on a 1.5% agarose gel. The gel was then washed twice in 0.5 M NaOH and transferred to a Gene Screen Plus membrane (Perkin Elmer) overnight using 1OX SSC.
Probes for analysis by southern
Details on oligomers used for probing membranes can be found in table 2.4. Probes for Southern analyses consisted of a 2Omer oligonucleotide
O
specific for each PCR product. Probes were labelled with 50 jiCi of 32P-ydATP using 6.6 pM oligomer in Forward buffer (Invitrogen) in thepresence cf T4 Kinase (Invitrogen) enzyme. Labelled oligomers were
purified using the ProbeQuant Kit (Amersham).
Hybridization and washes
Membranes were prehybridized in 6X SSC (0.9 M NaCI, 1 M NaCitrate),
20 mM NaH2PO4, 0.4% SDS, 5X Denhardt’s and 900 jig/mL of salmon
sperm DNA for a minimum of 8 hours. Labelled probe was hybridized to
the membrane overnight at 42°C at a concentration 0f I million counts/mI
0f sperm DNA. The following morning, hybridized membranes were
washed multiple times in iX SSC and 1% SDS at gradually increasing
temperatures until there was Iittle detection of background.
Gene Sequence 5’ to 3’ Length
IFNy AGCTCTTCCTCATGGCTGTT 20 bp
Proteosome subunit CAACATGATGCTGCAGTACC 20 bp beta type 8
Tryptophanyl-tRNA AAAGGCATCGACTATGACAAGC 22 bp synthetase
Interferon-y induced CTCATCGGACACGAAGAGAA 20 bp GTPase
T-CeII specific GTPase GACCACTAACTTCACACCAC 20 bp
GAPDH CCACAGTCCATGCCATCACT 20 bp
Figure 2.4 Summary of probes used in Semi-quantitative RT-PCR (Southern) analysis
39
Exposure and analysis
n
Hybridized membranes were first exposed to a phosphor screen cassette
(molecular dynamics, sunnydale, CA.) and then to X-OMAT AR film
(Kodak) if the signal was weak. Visualization cf the phosphor screen and
quantification were achieved though the ImageQuant software and each
gene was normalized to the intensity cf the GAPDH PCR products of the
same cDNA performed at the same time and under the same conditions.
Abdominal aortic constrictions
LVH was induced in male mice by surgical introduction of an abdominal
aortic constriction (AAC) (133). Mice were first weighed and anesthetized
via intramuscular injection of 1 pI per gram of an anaesthetic cocktail
(0.04% AC promazine and 4% Ketamine in 0.9% sterile saline). A blunted
26-gauge needle was positioned on top of the abdominal aorta (rostrally
to the renal arteries), a suture was placed around both the needle and the
aorta with a 6-0 nylon string, and the needle was subsequently withdrawn.
Before closing the incision the abdominal cavity was flooded with 1 mL of
sterile saline. Mice were also injected 1 ml of sterile 10% sucrose
subcutaneously following the surgery. Sham surgeries were conducted in
a similar manner, with the exception that no suture was tied around the
aorta.
o
Chapter 3: Results
Comparison of overali changes in gene expression
Affymetrix chip resuits
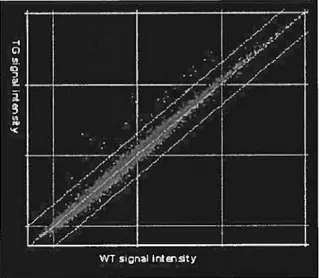
Initial comparison of RNA expression levels in transgenic compared with wild-type myccardium revealed 41 genes with an increase in expression in the GC-Transgenic mice of two fold or more (figure 3.1). There were, however, no genes that were found to be down regulated to this magnitude. Surprisingly, ail but three of these genes were found to be well-known targets of the pro-inflammatory cytokine Interferon-y (IFNy) (Table 3.1). IFNy is normally secreted by thymus derived T-lymphocytes (144) and is involved in the regulation cf several aspects cf the immune function. Many of the classes of IFNy-regulated genes were found in the GC-Transgenic mice (Table 3.1).
Figure 3.1. Changes in gene expression observed in CG Transgenic mice relative te WT mice via Affymetrix technology. RNA from Left ventricles (LV) cf GC-Transgenic (TG) and wild type (WT) mice were hybridized to mgU74A affymetrix chips. The normalized signal intensities from the hybridizations of GC-transgenic mice were plotted against those of the WT mice. Red dots represent individual genes. The two outer Green unes represent 2 fold thresholds whereas the centre green une represents equal amounts of a specific transcripts in both TG and WT.