Assessment of household risk management
strategies for coastal aquaculture: the case of clam farming
in Thaibinh Province, Vietnam
Thi Thu Hang Ngo1,2&Hossein Azadi1,3& Huu Cuong Tran2&Philippe Lebailly1
Received: 29 March 2017 / Accepted: 4 December 2017
# Springer International Publishing AG, part of Springer Nature 2017
Abstract Clam farmers have experienced different types of risks that have been further exacerbated by the rapid expansion of clam farming areas, increased growing densities, and increased market difficulties in recent years in the Thaibinh Province of Vietnam. Most farmers have been seriously affected by production risk, market risk, and financial risk, while a number of others have met with success in almost all of their clam-raising cycles. This study applied a differentiating comparative analysis method and multiple discriminant analysis method to discuss the differences in risk management strategies between and among clam farming households and the impacts of those differences on their success/failure rates. In general, the tactics are related to increase in farm size, the application of technical innovations, diversifying livelihood activities, and accessing secure financial sources all provided better conditions for clam growth, diminished losses, and led to speedier recovery from shocks. To support farmers in managing risks, several government interventions are needed: (1) better re-zoning of clam farming areas in parallel with an increase in the farm size of each household, (2) promoting sustainable linkages between the farmers and the formal financial market and output market, and (3) investing more funding into research and extension related to sustainable clam farming practices and to the improvement of farmers’ skills in cooperative works and management.
Keywords Aquaculture . Clam farmers . Risk management . Vietnam https://doi.org/10.1007/s10499-017-0226-y
* Thi Thu Hang Ngo ngohangvn@gmail.com
1 Economics and Rural Development, Gembloux Agro-Bio Tech, University of Liege, 5030 Liege,
Belgium
2
Faculty of Accounting and Business Management, Vietnam National University of Agriculture, Hanoi, Vietnam
3
Introduction
BRisk^ is a term that has been widely used in various sectors, including agriculture, in recent decades. In the most general terms, the USDA Risk Management Agency (RMA) defines risk asBthe chance of something bad happening^ (McIntosh2008). This defini-tion mendefini-tions two important components of risk, that is, Bsomething bad,^ which refers to an event or outcome that is adverse or failure,^ and Bthe chance,^ which implies a degree of possibility that an adverse event will occur. Although the definition of risk may vary depending on the sector, those two important concepts are incorporated in all explanations of risk (Bondad-Reantaso et al. 2008; Harwood et al. 1999; Keil et al. 2008). Agricultural risks are basically categorized into five types: production risk, marketing risk, financial risk, legal risk, and human risk (Musser and Patrick 2002). Due to increasingly extreme weather events and social-economic conflicts, agricultural risks have been intensifying all over the world each year (Cardona 2004; Fischer and Buchenrieder2010; Yang2010). Risks are more often embedded in agricultural produc-tion than in other sectors given its vulnerability to and dependence on nature, and when risks happen, they always cause large losses for both farmers and agribusiness traders.
Clam farming requires a longer production cycle and greater initial investments, and farmers are often faced with a larger scope of risks, both in type and in magnitude, compared to farmers who produce annual crops (Engle2010); this is especially true in the context of climate change and its unpredictable changes to the hydrological cycle. Handisyde et al. (2006) and De Silva and Soto (2009) noted that climate change has caused various impacts on aquaculture in both direct ways (i.e., the increase in mortality rates caused by extreme weather shocks) and indirect ways (the fluctuation in output volume and the availability of aquatic species will lead to a sudden change in the price of both inputs and outputs), which exacerbate the stress and the vulnerability of this sector, resulting in a higher probability of loss. In addition, aquaculture production and its share of the aquatic products market are predicted to continue to expand given increasing global demand for aquatic products. These trends will certainly increase the risks in the aquatic sector, which requires more active and effective actions and strategies by different parties involved in the sector to help farmers become more capable of coping with aquaculture risks.
Vietnam, given its long coastline (over 3260 km) and numerous estuaries (i.e., 112 estuaries), was ranked 18th in the 2015 world risk index, with a vulnerability index of 51% (Garschagen et al.2016). Climate change and natural resource degradation are considered the two major factors contributing to Vietnam’s recent reduction in agricultural productivity. There has been a declining trend in the contributions from the agricultural sector to Vietnam’s trade balance for the period of 2013–2015. The agricultural growth rate was even reaching a negative rate in the first quarter of 2016 (Kien2016). In addition, further integration into the global market economy, with its unpredictable market demands, will lead to additional risks for this farming industry and its marketing practices.
Risks could be a lethal constraint for certain groups of farmers while also creating more opportunities for others. To some extent, on a landscape scale, risk and opportunity are often linked. In fact, in facing certain risks, such as production risk, market risk or financial risks, while a substantial proportion of farmers are badly impacted, there are also farmers who survive the risks and/or choose successful alternatives for their livelihood. In other words, risk taking is intrinsic to the process of development, as it is at least better than the scenario of Binaction^ (WorldBank2014).
Risks are considered the main reason for social differentiation, that is, the widening gap between the rich and the poor (Bui et al.2014; Yang2010). In Vietnam, the wealth gap that has widened quickly in recent years has been powered by increased natural and socioeconomic risks (Ha et al.2015; Hay2016). In the agricultural sector, farmers might be aware of risks, but driven by commercialization and, to some extent, by the pressure to repay debts, they continue to invest more into their farming operation. Many farmers have suffered from losses in agricultural production (Minot and Hill2007), while a number of other farmers have seen increasing profits. While the review of Stevenson et al. (2009) raised questions about the main barriers to the adoption of aquaculture by the poor, the research of Duc (2009) about the economic contribution of aquaculture in Vietnam stated that in rural areas, this sector contrib-uted in important ways to farm incomes, with a high rate of adoption of aquaculture among poor farmers. The fact that farmers face the same risks but see different results raises a question about the underlying causes of farmers’ successes or failures.
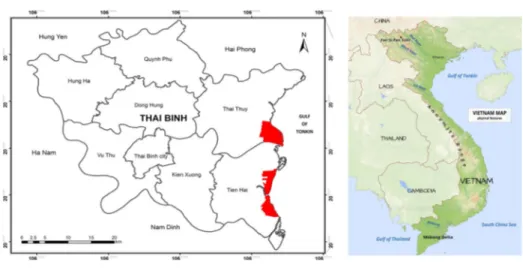
Our study relies on a case study of clam farming households located in Thaibinh Province, Vietnam. Among coastal provinces in North Vietnam, the 2013 statistics reported that Thaibinh had the largest area devoted to clam farming, with 3430 ha, followed by Namdinh, with 1710 ha; Thanhhoa, with 1200 ha; and Quangninh, with 1000 ha (MARD 2014). According to the Thaibinh Agriculture and Fishery Extension Center, the salinity in the provincial intertidal area is approximately 15–25‰, which favors aquaculture development. This intertidal area is used for clam farming among the coastal provinces in North Vietnam (ThaibinhDARD2014). The total potential area for aquaculture is approximately 17,000 ha (MARD 2014), 15,119 ha of which has been used for aquaculture production for different types of aquatic animals, such as shrimp, fish, and clams.
In the early 1990s, the increase in the market demand for clam meat and the reduction in natural clams initiated a demand for clam farming in the province; initially, clam farming occupied a small area of approximately 150 ha. Clam production was gradually expanded in the following years and reached approximately 1500 ha in 2010. In 2011, the provincial government officially institutionalized clam farming and aimed to boost the sector by zoning and bidding intertidal areas to farmers. In addition, loans were made available from official banks such as Agribank and Policy Bank for farmers to invest in clam farming. Clam farming rapidly expanded to approximately 3500 ha in 2013. Farmers also increased the clam-raising densities to reach their projected harvest, i.e., from 300 to 400 heads of clam/m2(from 2009 backward) to 1000–1200 heads of clam/m2in 2012–2013 (data from the household survey). Clam yields were quickly reduced in 2011 due to the high mortality rate caused by storms and hot weather in 2011, and then, serious market difficulties emerged in 2012, leaving a surplus production of clams. In 2014, clam farming areas were slightly decreased to the level of 3430 ha, and total clam production generated a value of nearly USD 20 million (exchange rate: USD 1 = VND 22,000 VND) in the province (Figs.1and2). Based on the information about the costs and revenues of clam farming and about its variability during the period of 2006– 2014, Monte Carlo simulation calculated the probability of capital losses in clam production investment in each raising cycle, which was estimated to be 52% for the surveyed households during this period (Ngo et al.2015). However, there were some farmers who were able to overcome the shocks or who were very resilient after losses, such as the farmers who were included in the figure of 15.9% in research about the status of hard clam farming in some coastal provinces of North and North Central Vietnam (Thuyết and Dũng2013), though they had to survive in the same risky context. To understand the hidden factors contributing to this situation, three major research questions were raised in the investigation of farmers’ risk
management strategies: (1) What are the household risk management strategies and the households’ tactics for clam farming in the province? (2) What are the differences between households in adopting risk management strategies? (3) How does a household’s adoption of risk management strategies explain its success and/or failure in clam farming and its marketing practices? Finally, based on the research results, some suggestions will be drawn in order to assist farmers in coping with agricultural risks and in promoting sustainable clam farming in the future.
Methodology
Study site
Thaibinh is an agriculture-based province. This province is located in theBrice bowl^ of the Red River Delta of Vietnam (Fig. 3 (BGeographical Database,^ 2016; FreeWorldMaps.net 2017)). Sixty-six percent of the provincial workforce is devoted to the agricultural sector. Even
0 5 10 15 20 25 0 500 1000 1500 2000 2500 3000 3500 4000 ton ha Year (Source: Thaibinh Statistical Office, 2015)
Area (ha) Average yield (ton/ha) Fig. 1 Annual clam farming area
and yield (2006–2014) (source: Thaibinh Statistical Office2015)
0 5 10 15 20 25 30 35 0.00 0.20 0.40 0.60 0.80
1.00USD USD mil.
Year
(Source: Thaibinh Statistical Office, 2015)
Clam market price (USD/kg) Total gross output (USD mil.) Fig. 2 Annual gross revenue of
clam farming (2006–2014) (source: Thaibinh Statistical Office 2015)
though the provincial gross regional domestic product (GRDP) structure has changed, with greater shares being taken by the industrial and service sectors over the last 30 years, agriculture, forestry, and aquaculture maintain an important share of the GRDP, with approx-imately 25–35% of the total provincial production value in Thaibinh in recent years. In 2016, the total value of GRDP for Thaibinh was estimated at USD 2.77 billion, and the GRDP per capita was approximately USD 1562; in which, aquaculture production alone generated USD 390 million (ThaibinhSO 2017). Approximately 26% of farmers living along coastal areas seek their livelihood through coastal aquaculture activities, mostly in combination with other traditional livelihood activities. Other farmers have traditionally made a living by producing food crops and raising animals.
There are 12 communes conducting clam farming along coastline of Thaibinh. These communes are located along 50 km of coastline in the province. Three com-munes were selected for the study. The three chosen comcom-munes were those that have the largest clam farming areas and the longest history of clam production in the province. These characteristics allow researchers to capture risks and farmers’ resilience/capacity in clam farming over a relatively long period of time, i.e., from 2006 to 2014. There are 1310 households having clam farming in the three communes in period 2006–2014.
Data collection
Fieldwork activities were carried out in the study site from August 2014 to May 2016. In addition to the secondary data obtained from local government offices and published papers/ reports, three major research tools were used to gather information on clam production, marketing, farming, and marketing risks, as well as information on farmers’ capacities and strategies to address different clam farming risks in the period of 2006–2014. The main data collection tools are as follows:
1. Farmer focus group discussions (FGDs). One FGD was conducted in each selected commune, and 8–10 farmers with clam farming experience participated in the discussion. Fig. 3 Map of the research site
FGDs aimed to explore the historical trends in clam farming, marketing practices, and household risk management strategies.
2. Household survey. The sample size of households for the survey was calculated by the equation:
n ¼ N*t2*S2 N*Δ2
xþ t2*S2 ð1Þ
whereBn^ (the sample size), BN^ (total number of households in the research site) = 1310, and Bt^ (the confidence interval) = 2.17 (with a 97% confidence level). Sample variance and sample errors were estimated based on the trial survey (of the total loss area for each household) of 31 households from the three communes. The statistical results of the survey showed the amount of sample variance (S2) = 194.88 and sample errors (Δ2
x ) = 2.52. The actual sample size then needed to be increased from 137 to 157 since the sample from Thaido commune was increased from 11 to 31 in order to have a sufficient number of households to be representative of the commune. The number of surveyed households in Dongminh and Namthinh was 58 and 68, respectively.
3. Case study. Several cases of failures and successes in clam farming had been studied with in-depth interviews to explain the quantitative analysis results (i.e., cost and revenue analysis, Spearman’s rho test, and Kendall’s tau-c test about the impact of factors on the application of risk management strategies in each household).
Data analysis
In this research, differentiating comparative analysis (Pickvance2001) was used to find the differences in household risk management strategies applied by the three groups (which had different outcomes of strategies in responding to the clam farming risks) in order to discover which strategies and tactics critically contributed to the success of household risk management. Simultaneously, multiple discriminant analysis (Brown1998; Hoang and Chu2008) was used to measure the impacts of household risk management strategies on the performance of different clam farming groups, which were categorized by the outcome of their risk manage-ment strategies. This analysis was followed by factorial analysis (with several tests, such as ANOVA, Welch’s test, Spearman’s rho, and Kendall’s tau-c test) to measure possible links and correlations between household characteristics and household risk management strategies.
Results
Adoption of household risk management strategies in clam farming
A majority of clam farmers experienced farming risks, i.e., 80% of the surveyed households had experienced at least one massive loss in a clam farming cycle at the time of the survey. The most serious risk was related to high clam mortality rates during the farming process. Several
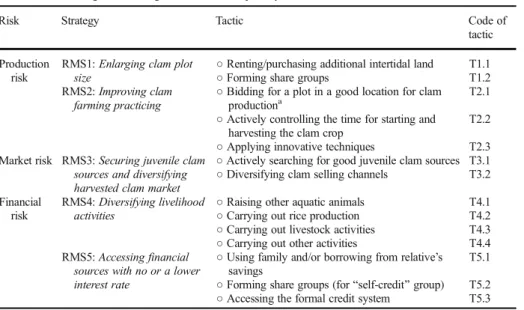
causes of mortality, such as poor quality of juvenile clams, uncontrolled wastewater dis-charges, and natural disasters such as storms and droughts (for shallow growing areas), were reported by farmers. In addition, reduced market demand and price have increasingly plagued farmers in recent years. To cope with the risks of clam farming, farmers have developed several strategies to reduce farming vulnerabilities (Table1). Each risk management strategy (hereafter RMS) consists of several tactics.
Reducing the clam mortality rate is a crucial target of farmers in order to cope with production risks. There are two major strategies being adopted by farmers: (1) enlarging clam plot size (RMS1) and (2) improving clam farming practicing (RMS2).
Decision 11/2012/QD-UBND (issued by the Thaibinh People’s Committee) set a limit of not more than 2 ha for clam farming areas allocated to individual households. However, as farmers revealed, although small areas cost farmers less in labor and use efficiency (such as farming practices and protection) and in facility investments (such as a living shed, boat, and protection fences), they also come with disadvantages related to raising clams at different ages. Normally, clams of different ages (i.e., juvenile, young, close to harvest) are raised separately. However, as revealed by farmers, large plots will allow the farmers to raise clams of different ages together by simply separating them with a net system. This approach allows farmers to better cope with market risks and production risks because different clams have different sensitivities to extreme weather or pollutants discharged from inland. Moreover, the invest-ment on (super) juvenile clams is not too expensive. Once juvenile clams grow and become ready for commercial production, mortality rates are reduced because clams have acclimatized to local production conditions. To enlarge farming areas, farmers have applied two tactics. The first tactic is to rent/purchase intertidal land from other farmers nearby. Since 2013, a number of farmers have discontinued clam farming because of serious farming losses in previous years. Approximately 45% of the surveyed farmers rented and/or purchased additional adja-cent intertidal land to enlarge their clam farming plots. The second tactic is to formBjoint Table 1 Risk management strategies and tactics adopted by households
Risk Strategy Tactic Code of
tactic Production
risk
RMS1: Enlarging clam plot size
○ Renting/purchasing additional intertidal land T1.1
○ Forming share groups T1.2
RMS2: Improving clam farming practicing
○ Bidding for a plot in a good location for clam
productiona T2.1
○ Actively controlling the time for starting and harvesting the clam crop
T2.2 ○ Applying innovative techniques T2.3 Market risk RMS3: Securing juvenile clam
sources and diversifying harvested clam market
○ Actively searching for good juvenile clam sources T3.1 ○ Diversifying clam selling channels T3.2 Financial
risk
RMS4: Diversifying livelihood activities
○ Raising other aquatic animals T4.1 ○ Carrying out rice production T4.2 ○ Carrying out livestock activities T4.3 ○ Carrying out other activities T4.4 RMS5: Accessing financial
sources with no or a lower interest rate
○ Using family and/or borrowing from relative’s savings
T5.1 ○ Forming share groups (for Bself-credit^ group) T5.2 ○ Accessing the formal credit system T5.3
a
groups^ among farmers who own intertidal plots adjacent to each other. Of the surveyed households in each commune, 21% of clam farmers in Dongminh, 46% in Namthinh, and 68% in Thaido commune decided to form groups to enlarge their clam-raising plots.
RMS2 contains three tactics. The first tactic was bidding on intertidal plots that are good for clam raising based on farmers’ experiences, i.e., not subjected to excessive intertidal current, daily drought, or close to wastewater discharges from inland agriculture and industry. This tactic was only applied in the Namthinh and Dongminh communes because in Thaido, the plots were allocated randomly to the farmers. The second tactic was actively planning for the clam production cycle, i.e., the point of time for starting the clam-raising cycle to reduce the effects of possible extreme weather on young clams, and completing the clam harvest before the storm season. This tactic, although not too complicated, is not easy for all farmers since it requires farmers to purchase juvenile clams and access the market for selling harvested clams at the time they prefer. In addition, this tactic requires farmers’ careful observation and experience because the best time for clam production depends on the characteristics of the clam-raising areas in relation to sea currents and nutrient availability. Among the surveyed households, approximately 55% were confident in their clam farming experience and adopted this farming technique. Third, pressure from risks also helped initiate some farmers’ innova-tions to improve clam practicing (i.e., faster growth or reduced clam loss), such as filling clam plots with new sand (to reduce pollution and enrich nutrients for clams), better fencing with doubling the net system, improving the clam catching and cleaning techniques. Seventy-one percent of surveyed clam farmers in Thaibinh have applied these techniques to different extents. Some farmers frequently and actively applied innovative techniques, while others simply imitated other farmers in applying these techniques.
While coping with the risks embedded in the clam production process, farmers have also developed strategies for dealing with market risks. Notably, farmers have been searching for more clam market channels for both input and output markets (RMS3). For inputs, 56% of the surveyed households purchased juvenile clams directly from producers in Namdinh—a neighboring province, and 18% purchased them from traders in the communes, while the remaining 26% started juvenile nursery practices to reduce the cost of purchasing juvenile clams and the biological risks for the new clam-raising cycle and to be more independent in their clam-raising practices. For selling harvested clams, in the period of 2006–2012, there were two types of collectors: local and external. In this period, 52% of farmers tried to diversify their clam selling channels by selling to external collectors because these collectors offered higher prices than local collectors or than taking the clams to the local market to sell by themselves. However, from the middle of 2012 onwards, when the clam market prices decreased significantly, external clam collectors were no longer coming to farmers for clam purchases. In recent years, a number of local farmers have tried to find and sell clams to traders in Haiphong and Quangninh provinces.
Having additional income sources beyond clam farming is a central concern of farmers’ financial RMSs related to clam farming investments. There are two strategies contributing to securing households from clam farming risks: (1) diversifying livelihood activities (RMS4) and (2) accessing financial sources with no or a lower interest rate (RMS5). RMS4 is considered a strategy to meet household daily spending needs and to contribute to debt payments when clam farmers are faced with losses. All clam farming households in Thaibinh adopted other livelihood activities, such as shrimp production, rice cultivation, livestock production, or owning a restaurant, in parallel with clam production, which allow households to benefit from the effective use of their labor and the use of fewer purchased inputs. The
income from those diversification activities were used to cover daily expenditures if clam farming did not generate a monthly cash flow in that cycle. During the period 2006–2014, 52% of the surveyed households produced other aquatic animals such as shrimp or fish, 64% produced paddy rice, and 20% had livestock. Thirty-eight percent of households conducted their own non-farm businesses, such as restaurants and grocery shops; 36 % had income from a paid job; and eight received remittances from relatives. Diversification of livelihood activities contributes to the success of household clam farming risk management by empowering the financial resources available to farmers for their daily needs and for their clam farming investments.
Clam farming requires a large amount of capital investment that is often beyond an individual household’s financial capacity. Most farmers have had to borrow credit for their clam investment. For instance, in the whole period of 2006–2014, approximately 70% of the surveyed farmers borrowed loans from formal and informal credit systems. Formal credit systems are often bureaucratic and impersonal but have lower interest rates, i.e., 10.8%/year on average, while informal credit systems are easier to access but have higher interest rates, i.e., 18%/year in 2010–2011. Faced with increased risks in clam production in early 2010, farmers developed financial strategies (RMS5) to secure their investment demands while reducing their dependence on the informal credit system with high interest rates, for instance, by using family savings or borrowing a relative’s savings (without interest being charged), trying to access formal credit, or forming Bself-credit groups^ among themselves, which can provide members a certain volume of money when necessary.
Results of risk management strategies
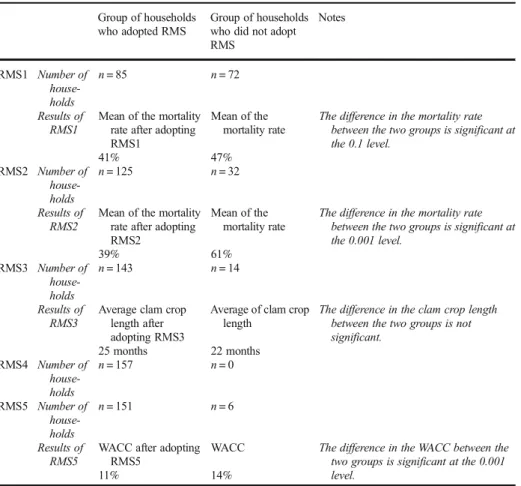
The data from the household surveys show the actual results of each RMS; only some of the RMSs achieved their purpose in risk management. Coping with production risks, the adoption of RMS1 and RMS2 definitely reduced the mortality rate in clam farming. The groups who applied those RMS2 had lower mortality rates compared to the groups who did not apply those methods. While the mean mortality rate in the clam plots where RMS2 was applied was only 39%, the mortality rate in the clam plot of the households who did not apply RMS2 was 61%. However, the differences in the mortality rates for the two groups, those who adopted RMS1 and those who did not adopt RMS1, were only 41 and 47%, respectively (Table2). In general, the strategy based on technical innovation obtained higher results than the strategy based on enlarging clam plot areas.
In contrast to the results for RMS1 and RMS2, RMS3 did not really result in management risk benefits (i.e., it did not connect with the market to sell the output at the expected time and consequently extended the clam crop length in the field). As mentioned before, all clam-raising households had applied RMS4 because of the special characteristics of clam farming. There-fore, the result of RMS4 could not be determined by comparing the two groups who applied it with those who did not apply it. Nevertheless, the level of application of RMS4 in each household led to different results, which will be discussed later in this paper. To cope with financial risks by applying diverse tactics, most of the households adopted RMS5. However, the extent to which farmers relied on different financial sources also very much depends on the farmers’ capabilities and expectations for clam production and marketing. Among households who started clam production in 2012, 34% used their own capital and/or credit from self-credit groups, 49% borrowed formal credit, and 17% borrowed informal credit, and in 2013, those
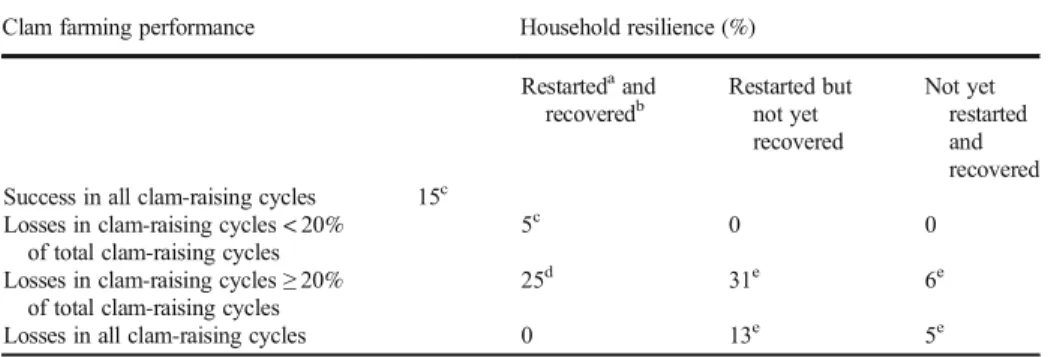
figures were 39, 49, and 12%, respectively. In general, this RMS5 positively supported the clam farmers to reduce the weight average cost of capital (WACC) used in farming (Table2). Different RMSs adopted by households have resulted in differences in each household’s resilience in coping with clam farming risks. Of the surveyed households, approximately 20% had not been or were only slightly affected by the risks they had experienced within their clam farming practices (group A in Table3), and 25% were seriously affected by clam farming risks but had been able to recover and restart their clam production (group B). Farmers in the FGDs revealed that considering the average clam market price of 2006–2014, approximately 20% of the expected income from clam harvesting would cover for their financial investments in juvenile clams and facilities, but there would be no return for labor. In this case, farmers can still secure their capital for reinvestment in the new clam-raising season. In contrast, 44% of farmers had not yet recovered from previous clam farming losses, even though they had restarted clam farming, and 11% of farmers had not yet been able to restart clam farming at all (group C) (Table3). Among the surveyed households, it is estimated that 38% of farmers had to sell their fixed assets to pay debts related to their previous clam investment. At the time of the survey, the three communes reported that 38 households had quit clam farming and that 10 others had left the villages because of bankruptcy (3 in Dongminh, 5 in Namthinh, and 2 in Thaido).
Table 2 Comparison test for the result of each RMS among 157 surveyed households (period: 2006–2014) Group of households
who adopted RMS
Group of households who did not adopt RMS Notes RMS1 Number of house-holds n = 85 n = 72 Results of RMS1
Mean of the mortality rate after adopting RMS1
Mean of the mortality rate
The difference in the mortality rate between the two groups is significant at the 0.1 level. 41% 47% RMS2 Number of house-holds n = 125 n = 32 Results of RMS2
Mean of the mortality rate after adopting RMS2
Mean of the mortality rate
The difference in the mortality rate between the two groups is significant at the 0.001 level. 39% 61% RMS3 Number of house-holds n = 143 n = 14 Results of RMS3
Average clam crop length after adopting RMS3
Average of clam crop length
The difference in the clam crop length between the two groups is not significant. 25 months 22 months RMS4 Number of house-holds n = 157 n = 0 RMS5 Number of house-holds n = 151 n = 6 Results of RMS5
WACC after adopting RMS5
WACC The difference in the WACC between the two groups is significant at the 0.001 level.
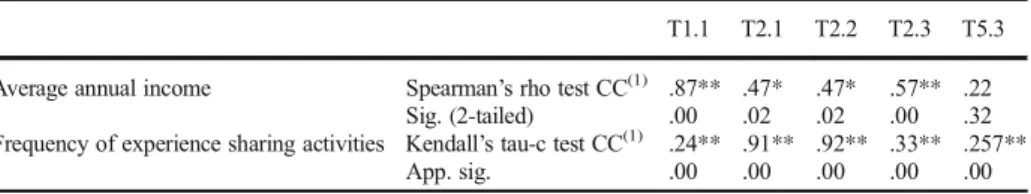
These three household groups are significantly different in their average income, average size of their clam-raising plots, and their active learning and sharing of farming experience with their neighbors (Table4). Surprisingly, households from groups A and B had much larger incomes than those of group C, i.e., four times to six times larger. The annual average income of households was significantly correlated to the adoption of tactics T1.1, T2.1, T2.2, and T2.3 (Table5).
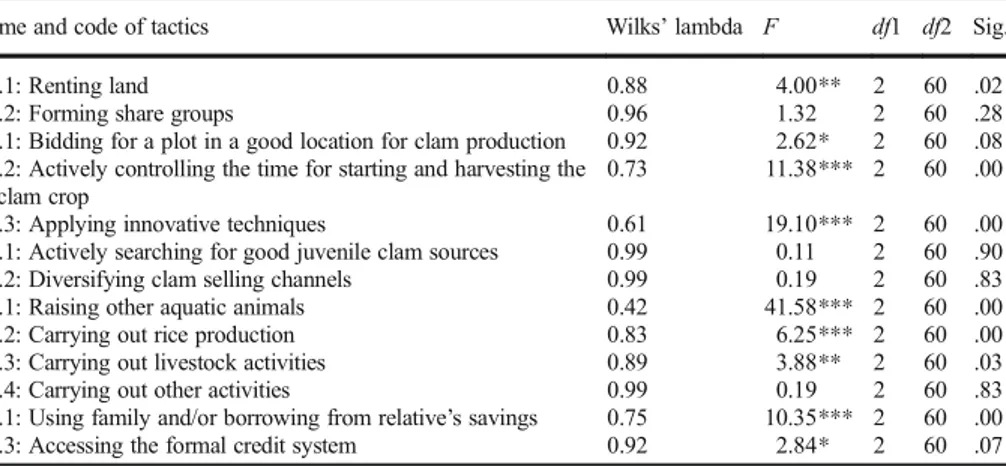
There was a varying difference in a household’s adoption of RMSs between and among household groups (group A, with slight impacts on clam farming risks; group B, with serious impacts but high resilience; and group C with serious impacts but no resilience). Large differences in a household’s adoption of tactics related to renting/purchasing additional intertidal land (T1.1), forming share groups (T1.2), bidding for good places for clam plots (T2.1), actively controlling the time for starting and harvesting the clam crop (T2.2), applying innovative techniques (T2.3), and trying to access the formal credit system (T5.3) were found, while fewer differences were found for the rest of the tactics (Fig.4). The result of the multiple discriminant analysis tests (Table6) confirmed the impacts of the first tactic of RMS1, all the Table 3 Clam farming performance in 157 surveyed households (period: 2006–2014)
Clam farming performance Household resilience (%) Restartedaand recoveredb Restarted but not yet recovered Not yet restarted and recovered Success in all clam-raising cycles 15c
Losses in clam-raising cycles < 20% of total clam-raising cycles
5c 0 0
Losses in clam-raising cycles≥ 20% of total clam-raising cycles
25d 31e 6e
Losses in all clam-raising cycles 0 13e 5e
aRestarted: Household restarted a new clam crop after previous clam losses bRecovered: Households had financially recovered from previous clam losses c
Group A: Households had not been affected and/or were slightly affected by previous clam farming and marketing risks
d
Group B: Households had been seriously affected by previous clam farming and marketing risks but had restarted clam production and had recovered from farming losses
eGroup C: Households had been seriously affected by previous clam farming and marketing risks, had restarted
clam production again, but had not yet recovered from previous farming losses
Table 4 Major characteristics of household groups
Characteristic Group A (N = 31) Group B (N = 39) Group C (N = 87) Household average annual income (USD) 24,047** 17,774** 4471**
Average size of clam-raising plots (ha) 2.70* 2.10* 2.11*
Percentage of clam plot≥ 2 ha 74% 56% 47%
Frequency of farming experience sharing (0, never; 1, sometimes; 2, often)
1.77 1.54 1.14**
The results of ANOVA and Welch’s test
*The mean difference is significant at the 0.10 level; **the mean difference between this group and the others is significant at the 0.05 level
tactics of RMS2, the first three tactics of RMS4, and T5.1 and T5.3 of RMS5 on the results of the household risk management.
Discussion
The contribution of strategies and tactics to the results of risk management in clam households
The tactics addressing the technical, land, and capital issues had positively contributed to the results of the household risk management. Similar to the discussion of McIntosh (2008) about the effectiveness of innovative techniques in coping with production risk in aquaculture, the results of all above statistical analysis have proved the contribution of all the tactics of RMS2 in the success of the clam households in their risk management activities. In parallel, the tactic Brenting/purchasing additional intertidal land^ (T1.1) helped to enlarge the clam plot size, which allowed farmers to benefit from the economic advantages of its larger scale (Ngo et al. 2016). Besides, the tacticBaccessing the formal credit system^ (T5.3) contributed to household resilience by overcoming financial risks, which is matching with the discussions about the role of the formal credit market in the household risk-coping strategies in rural Vietnam (Wainwright and Newman2011) and in the specific case of coffee smallholders in Vietnam (Hurri and Nguyen2015).
Table 5 Impact of household characteristics on the adoption of RMSs and tactics
T1.1 T2.1 T2.2 T2.3 T5.3 Average annual income Spearman’s rho test CC(1) .87** .47* .47* .57** .22
Sig. (2-tailed) .00 .02 .02 .00 .32 Frequency of experience sharing activities Kendall’s tau-c test CC(1) .24** .91** .92** .33** .257**
App. sig. .00 .00 .00 .00 .00
(1) CC correlation coefficient
*Significant at the 0.05 level (two-tailed); **significant at the 0.01 level (two-tailed)
0% 25% 50% 75% 100%T1.1 T1.2 T2.1 T2.2 T2.3 T3.1 T3.2 T4.1 T4.2 T4.3 T4.4 T5.1 T5.3 Group A Group B Group C
Although there was a difference in the adoption of the tacticBforming share groups^ (T1.2) among the three groups, this tactic did not contribute to the success of households in risk management to the same extent as tactic T1.1 because tactic T1.2 existed for only 1–2 years after land re-allocation. Meanwhile, as revealed by FGDs, after some raising cycles, without effective coordination, different interests and contradictory opinions between and among group members about clam farming activities, marketing practices, and technical innovation adoptions plagued the farmers’ groups. By 2015, 81% of the established groups disbanded in the Thai Do commune. The figures for Dong Minh and Nam Thinh were much lower, at 17 and 19%. As a result, in 2015, when the fieldwork was conducted, an average clam-raising plot was 2.46 and 2.90 ha in Dongminh and Namthinh communes, respectively, while in the Thaido commune, it was only 1.68 ha (Ngo et al.2016).
The results of both comparison tests and discriminant analysis tests revealed that the tactics of RMS3, which was designed for market risk, were unlikely to explain the differences in resilience to clam farming risks between and among household groups, and as such, none of those tactics significantly contributed to household risk management. One of the reasons is that those tactics had been implemented prior to 2013 and were not well planned before starting clam crops. In addition, risks related to the market are more easily explained at the meso/macro levels (Ngo et al.2015) and are thus largely beyond an individual farmer’s capacity to control. The same failures of the market risk management of Vietnamese catfish farmers were explained in the research of Le and Cheong (2010), in which they indicated that those tools were not feasible in practice.
The difference in applying the method of RMSs and the tactics among three groups
To be effective, some tactics required that they be adopted actively and appropriately rather than simply by imitation. The result of the discriminant analysis test showed that some tactics, such as T4.1 (raising other aquatic animals), T4.2 (carrying out rice production), and T5.1 (using family and/or borrowing from relative’s savings), significantly contributed to household risk management, while the comparison tests found no variance in the percentage of Table 6 Multiple discriminant analysis test on the impacts of the tactics on the results of household risk management
Name and code of tactics Wilks’ lambda F df1 df2 Sig.
T1.1: Renting land 0.88 4.00** 2 60 .02
T1.2: Forming share groups 0.96 1.32 2 60 .28
T2.1: Bidding for a plot in a good location for clam production 0.92 2.62* 2 60 .08 T2.2: Actively controlling the time for starting and harvesting the
clam crop
0.73 11.38*** 2 60 .00
T2.3: Applying innovative techniques 0.61 19.10*** 2 60 .00
T3.1: Actively searching for good juvenile clam sources 0.99 0.11 2 60 .90
T3.2: Diversifying clam selling channels 0.99 0.19 2 60 .83
T4.1: Raising other aquatic animals 0.42 41.58*** 2 60 .00
T4.2: Carrying out rice production 0.83 6.25*** 2 60 .00
T4.3: Carrying out livestock activities 0.89 3.88** 2 60 .03
T4.4: Carrying out other activities 0.99 0.19 2 60 .83
T5.1: Using family and/or borrowing from relative’s savings 0.75 10.35*** 2 60 .00 T5.3: Accessing the formal credit system 0.92 2.84* 2 60 .07 Significant at the 0.10 level (two-tailed); **significant at the 0.05 level (two-tailed); ***significant at the 0.01 level (two-tailed)
application among the three household groups. The hidden reason for this was the different method of adopting those tactics among the groups. To secure their family and their clam farm against aquaculture risks, diversification is one of the most common risk management strategies of clam farmers, similar to other farmers in Southeast Asia (Fischer and Buchenrieder 2010), in Africa (Barrett et al. 2001), in many other developing countries (Rahman et al.2011) or even in Europe (EC2001). However, the role of those incomes in supporting the farmers in their recovery from aquaculture shocks and to restart a new clam cycle was dependent on the type of activities and their contribution to the family total income. The results from our survey showed that the households who had incomes from other aquaculture activities (shrimp or fish raising) would more quickly recover than the ones who had only rice farming to complement their clam-raising activities. While 94% of group A and 42% of group B basically relied on income from aquaculture or their own business or on a remittance from their relatives to cover losses in clam farming, none of the farmers in group C relied on these sources. To cover their losses in clam farming, 77% of the farmers in group C relied on income from rice production. Likewise, although most of the farmers in all three groups applied tactic 5.1 to overcome the collateral constraints in the formal credit market, the farmers in group C were able to mobilize their own savings to finance only 6% (on average) of the total capital needed from their own savings (or the savings of their relatives) for restarting clam production, while those figures for group A and group B were 27 and 24%, respectively. The lesson here is that the strategies for risk management should be selective instead of imitating others. The RMSs become useful only when applied at a precise time, in the proper context and with accurate technical methodology.
Impact of household characteristics on the application of the RMSs and tactics
Household characteristics, including the average annual income, average size of clam plots, and the frequency of experience sharing, significantly impacted the adoption of the RMSs and tactics. In the limited intertidal land area where more farmers wanted to join clam farming, Decision 11/2012/QD-UBND set a ceiling on the clam-raising plot size of not larger than 2 ha for an individual household and 10 ha for an organization (ThaibinhGOV2012). The Mann-Whitney U test revealed the large impact of the clam-raising plot size on the farming cost/ profit ratio, namely, that larger plots have greater economic advantage than small plots (Ngo et al.2016). However, there is a tendency for group A to have plots larger than 2 ha and for group C to have plots smaller than 2 ha. Larger average household incomes allowed the households of groups A and B to purchase and/or rent additional intertidal land to enlarge their clam-raising plots compared to the households of group C. Lack of capital forced the households in group C to rely more heavily on T1.2 (forming share groups) compared to the other two groups. In our survey data, none of households in group C rented and/or purchased additional intertidal land, but 45% of them joined farmers’ groups (to enlarge clam-raising areas and to mobilize the capital needed for farming investment). Meanwhile, 32% of group A purchased additional intertidal land that was adjacent to their existing field, and 23% joined farmers’ groups, while these figures for group B were 36 and 28%, respec-tively. The research of Fischer and Buchenrieder (2010) also showed that while economically advantaged households often have access to so-called ex ante adaptive risk management strategies, poorer households have to rely primarily on ex post risk coping strategies, which enhance their long-term level of vulnerability. Small clam-raising areas and a lack of capital have been major factors constraining farmers from coping with farming risks, similar to the
results found in the research on farming systems conducted by Chi and Yamada (2002) or in research specific to the aquaculture sector conducted by Stevenson et al. (2009).
In addition, the farmers in group A and group B had more clam farming experience and were more actively sharing their experience compared to the farmers in group C. This finding explains group C’s lower adoption rate of the tactics related to farming techniques than that of the other two groups. For instance, while 100% of the farmers in group A adopted T2.2 (actively controlling the time for starting and harvesting the clam crop), only 62% in group B and 37% in group C did so. Farmers’ awareness of some tactics differed between and among household groups. For example, farmers in groups A and B considered T2.3 (applying innovative techniques) to be an important tactic for increasing clam farming productivity and reducing risks, while farmers in group C considered this tactic to be less valuable. Therefore, while 97% of the farmers in group A and 85% in group B often applied this tactic, only 57% in group C adopted it. Furthermore, the FGDs revealed that many farmers in group C simply imitated the tactics from their neighbors instead of fully understanding the tactical adoption techniques and their value. This approach constrains the efficiency of their tactical adoption. Along the same lines, Wisconsin farmers in the USA agreed that their group sharing greatly supported each of them in selecting and correctly applying appropriate risk manage-ment strategies through learning from others’ experiences (Hanson et al.2004); similarly, the research of Baez and Mason (2008) in Latin America concluded that the rate of recovery and the aftershock steady state of farming households appear to be further enhanced by higher levels of skill and education.
Conclusions
Clam farmers have experienced different types of risks that have been further exacerbated by the rapid expansion of clam farming areas and the increased market difficulties in recent years. These risks have caused lethal consequences for most of the clam farmers: in total, about four fifths of the surveyed farmers were seriously impacted. However, in such risky clam farming environments and with increased market difficulties, it is surprising that one fifth of the surveyed farmers succeeded in all of their clam-raising cycles so far. The application of diverse household risk management strategies in their clam farming practices was evaluated in this study. In general, the tactics related to increasing the farm size, applying technical innovations, diversifying livelihood activities, and accessing financial sources with no or a lower interest rate provided better conditions for growing clams, reducing clam loss and helping farmers reduce aquaculture risks, as well as achieving a speedier recovery from shocks. To achieve the goals of the risk management strategies, clam farmers need to learn how to actively adopt those strategies and tactics appropriately, rather than simply imitating others. Furthermore, the adoption of the risk management strategies and the tactics by the clam farmers is also impacted by several characteristics of the households, such as their average annual income, the average size of their clam plots, and the frequency with which they share experience.
Recommendations
From these research findings, several policy implications should be taken into consideration in order to support farmers in managing clam farming risks. First, to provide farmers with better
clam-raising conditions, better environmental protection of oceans in the long run, and more secure market access for their harvested clams, better re-zoning for clam farming areas and increases in the farming size of each household are required. Governments should not simply establish clam-raising areas based on physical criteria such as estuary areas and low salinity because successful clam farming depends on additional factors. Experienced farmers who are acutely familiar with the locations that are suitable and not suitable for clam farming within the estuaries should first be consulted in the matter of re-zoning.
Second, it is likely that many farmers will continue to be impacted by the increased clam farming risks, and more farmers will be bankrupted in the future. Given the failures of the risk management strategies for market risks and the constraints on accessing the formal credit market, support from state to local governments should focus more on promoting the sustain-able linkages between clam farmers and both the official financial markets and the output markets. By maintaining those linkages, not only will the market risk and financial risk be reduced but also the potential loss to farmers will be lessened and the resilience of those farmers will be enhanced.
Last but not least, the government’s intervention is needed to provide farmers with the necessary information about clam farming and marketing and with possible scientific research from which clam farmers might develop a better understanding in order to make better decisions for their farming practices. In addition, governments should do more research and extension related to sustainable clam farming practices. As more research is conducted and more information and case studies are collected, they can be used to support the development of aquaculture, reduce the level of uncertainty, and train farmers. Better farming practices will help farmers secure their clam farming investment. In addition, improving farmers’ skills in management and working cooperatively is also suggested. Even though most farmers were aware of the economic advantages of larger clam-raising plots, a lack of cooperatively working skills and cooperative coordination skills caused many farmers’ groups to be disbanded, which further impacted the clam farming and marketing practices of these farmers.
References
Baez JE, & Mason A (2008) Dealing with climate change: household risk management and adaptation in Latin America
Barrett CB, Reardon T, Webb P (2001) Nonfarm income diversification and household livelihood strategies in rural Africa: concepts, dynamics, and policy implications. Food Policy 26(4):315–331. https://doi. org/10.1016/S0306-9192(01)00014-8
Bondad-Reantaso MG, Arthur JR, & Subasinghe RP (2008) Understanding and applying risk analysis in aquaculture: Food and Agriculture Organization of the United Nations
Brown CE (1998) Multiple Discriminant Analysis. In Applied Multivariate Statistics in Geohydrology and Related Sciences (pp. 115–128): Springer
Bui AT, Dungey M, Nguyen CV, Pham TP (2014) The impact of natural disasters on household income, expenditure, poverty and inequality: evidence from Vietnam. Appl Econ 46(15):1751–1766.https://doi. org/10.1080/00036846.2014.884706
Cardona OD (2004) The need for rethinking the concepts of vulnerability and risk from a holistic perspective: a necessary review and criticism for effective risk management. Mapping vulnerability: Disasters, develop-ment and. people 17
Chi TTN, Yamada R (2002) Factors affecting farmers’ adoption of technologies in farming system: a case study in Omon district, Can Tho province, Mekong Delta. Omonrice 10:94–100
De Silva SS, Soto D (2009) Climate change and aquaculture: potential impacts, adaptation and mitigation. Climate change implications for fisheries and aquaculture: overview of current scientific knowledge. FAO Fisheries and Aquaculture Technical Paper 530:151–212
Duc NM (2009) Economic contribution of fish culture to farm income in Southeast Vietnam. Aquac Int 17(1): 15–29.https://doi.org/10.1007/s10499-008-9176-8
EC (2001) Risk management tools for EU agriculture with a special focus on insurance. Retrieved from AGRICULTURE DIRECTORATE-GENERAL; EUROPEAN COMMISSION: http://ec.europa. eu/agriculture/publi/insurance/sum_en.pdf
Engle CR (2010) Risk analysis in production aquaculute research. In: Aquaculture economics and financing: management and analysis. Wiley-Blackwell, Ames, pp 197–206.https://doi.org/10.1002/9780813814346.ch16 Fischer I, Buchenrieder G (2010) Risk management of vulnerable rural households in southeast Asia. In: Paper
presented at the 9th European IFSA Symposium. Austria, Vienna
FreeWorldMaps.net (2017) Vietnam Physical Map. Retrieved from http://www.freeworldmaps. net/asia/vietnam/map.html
Garschagen M, Hagenlocher M, Kloos J, Pardoe J, Lanzendörfer M, Mucke P,. .. Birkmann J (2016) World Risk Report 2015. Retrieved from Bündnis Entwicklung Hilft (Alliance Development Works) and United Nations University – Institute for Environment and Human Security (UNU-EHS): http://collections.unu. edu/eserv/UNU:3303/WRR_2015_engl_online.pdf
Geographical Database (2016) From Center of Survey and Mapping Vietnam http://bandovn.vn/vi/co-so-du-lieu-nen-dia-ly/tinh-thai-binh-81267
Ha NTT, Nga NV, Phuong NT, & Thuc NV (2015) Bao cao tong quan ve cac nghien cuu giam ngheo o Vietnam (Review study about research for poverty eliminating in Vietnam). Retrieved from MOLISA (Vietnam) & UNDP: http://www.vn.undp.org/content/vietnam/vi/home/library/poverty/bao-cao-tong-quan-cac-nghien-cuu-ve-giam-ngheo-o-viet-nam.html
Handisyde NT, Ross LG, Badjeck M-C, & Allison EH (2006) The Effects Of climate change on world aquaculture: a global perspective. Retrieved from department for international development (DFID): http://www.ecasa.org.uk/Documents/Handisydeetal_000.pdf
Hanson J, Dismukes R, Chambers W, Greene C, Kremen A (2004) Risk and risk management in organic agriculture: views of organic farmers. Renew Agric Food Syst 19(4):218–227.https://doi.org/10.1079 /RAFS200482
Harwood JL, Heifner R, Coble K, Perry J, & Somwaru A (1999) Managing risk in farming: concepts, research, and analysis: US Department of Agriculture, Economic Research Service
Hay A (2016) The wealth report 2015. Retrieved from Knight Frank Research: www.knightfrank. com/wealthreport
Hoang T, Chu NMN (2008) Analysis data for research with SPSS, vol 2. Hong Ngoc Publisher, University of Economic Hochiminh City
Hurri S, Nguyen NQ (2015) Rural finance of coffee smallholders in Vietnam- case study in DakNong Province. In: Retrieved from International Fund for Agricultural Development (IFAD). Vietnam, Hanoihttps://asia. ifad.org/documents/10751/084b3711-14d8-42f8-8d40-d604fa93e385
Keil A, Zeller M, Wida A, Sanim B, Birner R (2008) What determines farmers’ resilience towards ENSO-related drought? An empirical assessment in Central Sulawesi, Indonesia. Clim Chang 86(3–4):291–307.https://doi. org/10.1007/s10584-007-9326-4
Kien NT (2016) Agricultural commodity markets in 2015 and outlook for 2016. In: Paper presented at the Vietnam Agricultural Outlook Conference 2016. Hanoi, Vietnam
Le TC, Cheong F (2010) Perceptions of risk and risk management in Vietnamese catfish farming: an empirical study. Aquac Econ Manag 14(4):282–314.https://doi.org/10.1080/13657305.2010.526019
MARD (2014) Bao cao tinh hinh nuoi ngao tai cac tinh ven bien mien Bac Vietnam (Report about clam production in the provinces of North coastal Vienam). Department of Processing and Trading Agricultural Forestry Aquatic Products and Salt, Ministry of Agriculture and Rural Development, Hanoi, Vietnam
McIntosh D (2008) Aquaculture Risk Management. NRAC Publication No:107–2008
Minot N, & Hill RV (2007) Developing and connecting markets for poor farmers. Paper presented at the 2020 FOCUS BRIEF on the World’s Poor and Hungry People
Musser WN, & Patrick GF (2002) How much does risk really matter to farmers? In R. E.Just & R. D.Pope (Eds.), A comprehensive assessment of the role of risk in US agriculture (pp. 537-556): Springer US
Ngo TTH, Tran HC, Azadi H, & Lebailly P (2015) Clam farming risks in Thaibinh province, Vietnam: impacts and causes. Paper presented at the WorkshopBVulnerable Coastal Areas^, Royal Academy for Overseas Sciences (RAOS)– Belgium
Ngo TTH, Tran HC, Azadi H, & Lebailly P (2016) Aquaculture land-use policy: the case of clam farming in Thaibinh Province, Vietnam. Sustainability, 8, 1251(special issue), 12. Doi: https://doi.org/10.3390 /su8121251
Pickvance CG (2001) Four varieties of comparative analysis. J Housing Built Environ 16(1):7–28.https://doi. org/10.1023/A:1011533211521
Rahman S, Barmon BK, Ahmed N (2011) Diversification economies and efficiencies in a‘blue-green revolution’ combination: a case study of prawn-carp-rice farming in the‘gher’ system in Bangladesh. Aquac Int 19(4): 665–682.https://doi.org/10.1007/s10499-010-9382-z
Stevenson JR, Irz X, Lazard J, Lésel R (2009) Is aquaculture development an effective tool for poverty alleviation? A review of theory and evidence. Cahiers Agricultures 18(2/3):292–299
Thaibinh Statistical Office (2015) Provincial Social Economic Database
ThaibinhDARD (2014) Preliminary Summary Report after two years carrying out B2011–2015 planning proposal^ (Bao cao so ket 2 nam thuc hien de an nuoi ngao). Thaibinh Department of Agriculture and Rural Development, Thaibinh province, Vietnam
ThaibinhGOV (2012) Decision 11/2012/QD-UBND Thaibinh-13/7/2012: Quy che quan ly vung nuoi ngao tren dien tich bai trieuBRegulation for management clam farming unit in intertidal area^
ThaibinhSO TSO (2017) Thabinh Statistical Yearbook 2016: statistical publishing house
Thuyết BĐ, & Dũng TV (2013) Status of hard clam farming in some coastal provinces of North and Northern central Vietnam. J Sci Dev, 11
Wainwright F, & Newman C (2011) Income shocks and household risk-coping strategies: evidence from rural Vietnam. Institute for International Integration Studies Discussion paper(358)
WorldBank (2014) Risk and opportunity: managing risk for development. Retrieved from Publishing and Knowledge Division, The World Bank: http://siteresources.worldbank.org/EXTNWDR2013 /Resources/8258024-1352909193861/8936935-1356011448215/8986901-1380046989056/WDR-2014_ Complete_Report.pdf
Yang W (2010) Income uncertainty, risk coping mechanism and farmer production & management decision: an empirical study from Sichuan Province. Agric Agric Sci Procedia 1:230–240. https://doi.org/10.1016/j. aaspro.2010.09.029