• Aucun résultat trouvé

Surface Mapping of the he & SI Distribution of Four B Stars

N/A
N/A
Protected

Academic year: 2021

Partager "Surface Mapping of the he & SI Distribution of Four B Stars"

Copied!
15
0
0

Texte intégral

(1)

A&A 413, 273–283 (2004) DOI: 10.1051/0004-6361:20031450 c ESO 2003

Astronomy

&

Astrophysics

He and Si surface inhomogeneities of four Bp variable stars

?,??

M. Briquet

1,4

, C. Aerts

1

, T. L ¨uftinger

2

, P. De Cat

1,???

, N. E. Piskunov

3

, and R. Scuflaire

4

1 Instituut voor Sterrenkunde, Katholieke Universiteit Leuven, Celestijnenlaan 200 B, 3001 Leuven, Belgium 2 Institut f¨ur Astronomie, Universit¨at Wien, T¨urkenschanzstr. 17, 1180 Wien, Austria

3 Uppsala Astronomical Observatory, Box 515, 751 20, Uppsala, Sweden

4 Institut d’Astrophysique et de G´eophysique de Li`ege, Universit´e de Li`ege, all´ee du Six Aoˆut 17, 4000 Li`ege, Belgium Received 26 May 2003/ Accepted 4 September 2003

Abstract.We present ground-based multi-colour Geneva photometry and high-resolution spectra of four variable B-type stars: HD 105382, HD 131120, HD 138769 and HD 55522. All sets of data reveal monoperiodic stars. A comparison of moment variations of two spectral lines, one silicon line and one helium line, allows us to exclude the pulsation model as being the cause of the observed variability of the four stars. We therefore delete the four stars from the list of candidate slowly pulsating B stars. We attribute the line-profile variations to non-homogeneous distributions of elements on the stellar surface and we derive abundance maps for both elements on the stellar surface by means of the Doppler Imaging technique. We confirm HD 131120 to be a He-weak star and we classify HD 105382, HD 138769 as new He-weak stars. HD 55522 has the solar helium abundance but the mean abundance value of He varies by 0.8 dex during the stellar rotation. For HD 131120 and HD 105382, helium is enhanced in regions of the stellar surface where silicon is depleted and depleted in regions where silicon is enhanced. Key words.line: profiles – stars: individual: HD 131120, HD 105382, HD 138769, HD 55522

1. Introduction

Aerts et al. (1999) and Mathias et al. (2001) started a long-term spectroscopic project to monitor some 20 candidate slowly pul-sating B stars (SPBs) selected among many candidates discov-ered from the HIPPARCOS mission (Waelkens et al. 1998). In this selected sample, four stars are distinguishable from con-firmed SPBs (De Cat 2001) although they showed line-profile variations similar to those of SPBs at first sight: HD 105382 (B 2 III), HD 131120 (B 2.5 III), HD 138769 (B 3 IVp) and HD 55522 (B 2 IV/V).

In Briquet et al. (2001a) we have already made an exten-sive study of the star HD 105382 but we could not choose between rival hypotheses, namely non-radial pulsation or rota-tional modulation, to explain the observed monoperiodic vari-ability of the star. In Briquet et al. (2001b) a comparison of the moment variations of silicon lines to the ones of a helium line allowed us to exclude the pulsation model for the star HD 131120. In this paper, we show that this way to discrim-inate between stellar pulsation and stellar spots can be used for HD 105382 and the two other B-type stars HD 138769 and HD 55522 so that we attribute the variations of the four stars to

Send offprint requests to: M. Briquet,

e-mail: maryline@ster.kuleuven.ac.be

? Based on observations obtained with the Swiss photometric

tele-scope and ESO’s CAT/CES telescope, both situated at La Silla, Chile.

??

Appendix A, Tables 1 and 2 and Figs. 9, 11, 13 are only available in electronic form at http://www.edpsciences.org

??? Postdoctoral Fellow of the Fund for Scientific Research, Flanders.

rotational modulation instead of stellar pulsation. Moreover we derive abundance maps for both elements Si and He on the stel-lar surface of these four studied stars by means of the Doppler Imaging technique.

The paper is organized as follows. In Sect. 2 we describe the observations that we have at our disposal and we derive some physical parameters of the stars. In Sect. 3 we show the outcome of the frequency analysis on photometric and spectro-scopic data together with the variations of the moments of the Si and He lines. Abundance distributions on the stellar surface of both elements are derived in Sect. 4. Conclusions are given in Sect. 5.

2. Data and physical parameters

We have three datasets at our disposal: HIPPARCOS photome-try, multicolour Geneva photometry and high-resolution spec-troscopic data. The Geneva photometric observations were ob-tained with the Swiss telescope situated at La Silla in Chile. The spectroscopic data were obtained with the CAT/CES tele-scope of ESO in Chile. The spectral domain was [4115,4135] Å in order to get the Si II-doublet with lines at λλ 4128, 4130 Å so that we also have the He I 4121 Å line. A log of the obser-vations is given in Table 1. The number of obserobser-vations and the ranges of their Julian Dates are given in Table 2 for the spectroscopy. For a complete description of the observations and data reductions we refer to Aerts et al. (1999) and De Cat (2001).

(2)

Table 3. Physical parameters of the four studied stars. HD 131120 HD 105382 HD 138769 HD 55522 Teff(K) 18 250± 420 17 400± 400 17 500± 400 17 400± 400 log g 4.10± 0.15 4.18± 0.15 4.22± 0.15 4.15± 0.15 log L/L 3.13± 0.15 2.89± 0.15 2.98± 0.15 2.95± 0.15 M (M ) 6.1± 0.6 5.7± 0.4 5.4± 0.4 5.5± 0.3 R (R ) 3.6± 0.8 3.0± 0.6 3.4± 0.6 3.3± 0.6

A first estimate of the effective temperature and of the grav-ity of our targets is obtained by means of the photometric cal-ibration by K¨unzli et al. (1997) to the mean magnitudes in the Geneva filters. The parallax measured by HIPPARCOS pro-vides the distance. This, together with the average visual mag-nitude, gives the absolute visual magnitude. One obtains the bolometric magnitude and consequently the luminosity taking into account the bolometric correction (BC), which is calcu-lated by means of Flower’s relation (1996) between Teff and

BC. With the values for the effective temperature and the lumi-nosity one estimates the mass by using the evolutionary tracks published by Schaller et al. (1992). We also calculated the ra-dius. The results are given in Table 3. We stress that the stan-dard errors given in Table 3 are formal errors, i.e. errors derived from uncertainties due to interpolation in K¨unzli et al.’s grid of standard stars. As we are dealing with spotted stars, these for-mal errors are underestimates of the true uncertainties.

3. Frequency analysis and moment variations

For the star HD 131120, our frequency analysis on HIPPARCOS and Geneva photometry and our analysis of the moment variations < v >, < v2 > and < v3 > (for a

definition, see Aerts et al. 1992) of both lines of Si and He are fully described in Briquet et al. (2001b). In this section, we describe similar analyses for our three other considered stars.

The frequency analysis on the datasets was performed us-ing the PDM method (Stellus-ingwerf 1978), the Scargle and CLEAN methods (Scargle 1981; Roberts et al. 1987). We tested frequencies from 0 to 3 cycles per day (c d−1) with a frequency step of 0.0001 c d−1 and we searched for multiple periods by prewhitening.

3.1. HD 105382

In Briquet et al. (2001a), we performed a frequency analysis for HD 105382 on photometry as well as on high-resolution Si II 4128−4130 Å lines. All these data point out that there is only one period of 1.295 days present in the star.

In this paper, we complete our analysis by also computing the first three moments of the He I 4121 Å line in order to com-pare their temporal variations to those of the Si lines. In < v > we found subsequently 2 f and f , which reduce together the standard deviation by 65%. In < v2 > we found subsequently

2 f , f and 3 f . In < v3> we found 2 f . Phase diagrams for < v >,

< v2 > and < v3 > computed from the Si and He lines are

shown in Fig. 1. A comparison of the behaviour of both lines allows us to conclude that the cause of the observed variability of the star cannot be stellar pulsation. Indeed, for a pulsating

star, the temporal behaviour and phasing of the moments are the same whatever is the line. Moreover the amplitude of the first moment, which is the radial velocity in the case of pulsa-tion, does not depend too much on the lines for SPBs. Clearly, for HD 105382, the frequency 2 f dominates the moments of the He line while it is the frequency f for the Si line. The min-imum value for < v > and < v3 > of the Si line corresponds to

a maximum value for the He line. The peak-to-peak amplitude in < v > obtained from the He line is about 20 km s−1while the one obtained from the Si line is about 10 km s−1.

We also show the equivalent width variations of the Si II 4128 Å line and of the He I 4121 Å line respectively in the left and right upper panels of Fig. 5. The equivalent widths vary with the same frequency as the higher order moments. The relative EW variations of the Si line and of the He line are about 9% and 7% respectively, which is large compared to the ones of confirmed SPBs (De Cat 2001). Moreover De Ridder et al. (2002) have shown that relative EW variations of Si lines never exceed a few percent for slowly-rotating non-radially pulsating B stars.

All these peculiarities of the variations of the line profiles lead us to exclude the pulsational model as an explanation for the variability of HD 105382. As the moment variations of the Si and He lines resemble those of HD 131120, we also at-tribute the variability of HD 105382 to rotational modulation. Indeed, for HD 131120, we modelled the line-profile variations by means of a simple model with circular spots for which the flux in the spots differs from that coming from the rest of the star (Briquet et al. 2001b). Such a basic model was able to re-produce the first three moment variations of the lines, the large equivalent width variations as well as a different behaviour of moments of silicon and helium lines. We then concluded that a good explanation for the variability of the star is its rotation in the presence of non-homogeneous distributions of elements on the stellar surface.

3.2. HD 138769

3.2.1. The HIPPARCOS and Geneva photometric data

In the HIPPARCOS measurements all three methods of pe-riod determination lead to a clear frequency, which is f = 0.4786 c d−1. This frequency reduces the data standard devia-tion by 30%. A phase diagram for this frequency is represented in the upper left panel of Fig. 2. Note that the peak-to-peak amplitude of Hp-data is only 0.015 mag and the standard

de-viation of the residuals is some 0.00464 mag, which is only slightly larger than the average error on the data of 0.0043 mag. We searched for another frequency in the data but we were not

(3)

-10 -5 0 5 10 0 0.2 0.4 0.6 0.8 1 <v> Phase (f=0.7721 c d-1) 600 800 1000 1200 1400 1600 1800 0 0.2 0.4 0.6 0.8 1 <v 2> Phase (f=0.7721 c d-1) -40000 -30000 -20000 -10000 0 10000 20000 30000 40000 0 0.2 0.4 0.6 0.8 1 <v 3> Phase (f=0.7721 c d-1) -20 -15 -10 -5 0 5 10 15 20 0 0.2 0.4 0.6 0.8 1 <v> Phase (f=0.7721 c d-1) 1800 2000 2200 2400 2600 2800 3000 3200 3400 3600 0 0.2 0.4 0.6 0.8 1 <v 2> Phase (f=0.7721 c d-1) -100000 -50000 0 50000 100000 0 0.2 0.4 0.6 0.8 1 <v 3> Phase (f=0.7721 c d-1)

Fig. 1. For HD 105382, first three observed moments of the Si II 4128 Å line (dots, left) and of the He I 4121 Å line (dots, right). < v >,

< v2> and < v3> are expressed respectively in km s−1, (km s−1)2and (km s−1)3. The full lines represent the best harmonic fits for the indicated frequency.

able to determine one. The PDM and Scargle methods led to different candidates.

We found the same main frequency f in the seven filters of Geneva photometry, which reduces the standard deviation by 25%. A phase diagram for the U-magnitude is shown in the upper right panel of Fig. 2. As for HIPPARCOS photometry we were not able to derive a second frequency.

3.2.2. The spectroscopic data

Through the PDM method we found the frequency f in the first moment computed from the Si II 4128 Å line. After prewhiten-ing with f we found a frequency very close to 2 f . In < v > computed from the He I 4121 Å line, the PDM method leads subsequently to the frequencies f and 2 f . Using the Scargle method we obtained 1 − f as first frequency and 2 f after prewhitening with f . Phase diagrams for < v > are shown in the upper part of Fig. 3. The frequency f and its first harmonic reduce the standard deviation of < v > computed from the He line by 74%.

In the second and third moment of the Si II 4128 Å line we were not able to determine a frequency. Concerning the He I 4121 Å line, its second moment does not show a clear fre-quency while the third moment clearly presents the frefre-quency f and its first harmonic 2 f . Phase diagrams of these moments of both lines are represented in Fig. 3. The behaviour of < v >, < v2 > and < v3 > resemble the one of HD 131120 (Briquet

et al. 2001b). Consequently we conclude that the variability of the star is due to rotational modulation. The equivalent width of both lines varies with f as shown in Fig. 5. The relative equiv-alent width variation is about 9% and 17% for respectively the Si line and the He line.

3.3. HD 55522

3.3.1. The HIPPARCOS and Geneva photometric data

De Cat (2001) already made a period search in photometric datasets of the star HD 55522. In this paper we show again the variations of photometry to underline the different behaviour of

(4)

4.46 4.47 4.48 4.49 4.5 4.51 4.52 0 0.2 0.4 0.6 0.8 1 Hipparcos Hp Phase (f=0.4786 c d-1) 3.86 3.88 3.9 3.92 3.94 3.96 0 0.2 0.4 0.6 0.8 1 U magnitude Phase (f=0.4786 c d-1) 5.8 5.82 5.84 5.86 5.88 5.9 5.92 0 0.2 0.4 0.6 0.8 1 Hipparcos Hp Phase (f=0.3664 c d-1) 5.24 5.26 5.28 5.3 5.32 5.34 5.36 0 0.2 0.4 0.6 0.8 1 U magnitude Phase (f=0.3664 c d-1)

Fig. 2. For HD 138769 (upper) and HD 55522 (lower), phase diagrams of the HIPPARCOS data and of the U-magnitude data (dots) are compared with their best sinusoidal fits for the indicated frequency (full lines).

the star compared to confirmed SPBs. For both HIPPARCOS and Geneva photometric data we found subsequently the fre-quency f = 0.3664 c d−1 and 2 f . f with 2 f reduce the stan-dard deviation by 53% and 69% for HIPPARCOS and Geneva data respectively. Phase diagrams for both types of photomet-ric data are shown in Fig. 2. Clearly the variability of the star is dominated by only one frequency and its first harmonic. No other frequencies can be found in the photometric datasets.

3.3.2. The spectroscopic data

The frequency analysis on the Si II 4128−4130 Å doublet does not lead to a clear frequency although the frequency f seems to be present in the first moment of the Si II 4128 Å line. However in the first moment of the He I 4121 Å line, the frequency f is clearly found and even its harmonics up to 4 f . The frequen-cies f and its first three harmonics reduce the standard devia-tion of < v > by 76% for the helium line.

In < v2 > and < v3 > of the Si II 4128−4130 Å lines it

was not possible to find a frequency. Phase diagrams for f are shown in the left part of Fig. 4. The moments are very noisy and no clear periodicity is observed. For the He I 4121 Å line, however, we found in < v2 > the frequency f followed by 3 f

and in < v3 > we found f followed by 2 f . Phase diagrams of the first three moments of the helium line are shown in the right part of Fig. 4. No other frequency could be found in < v > nor < v2> or < v3>. The star is clearly monoperiodic.

As for HD 131120, HD 105382 and HD 138769 we con-clude that such typical variations of the moments are not

due to pulsation but can be caused by rotational modulation. We recall again their characteristics. Harmonics of the fre-quency are present in the datasets. The moment variations of the He line are completely different from those of the Si lines. The peak-to-peak amplitude of the first moment computed from the He line is four times larger than the one computed from the Si line.

In Fig. 5 the equivalent width variations of both consid-ered lines are represented for HD 105382, HD 138769 and HD 55522 (those of HD 131120 are given in Briquet et al. 2001b). The ones of the Si line do not show any periodicity and are very noisy while the EW variations of the He line present a clear periodicity with f and harmonics as for the higher order moments. We note that the relative EW variation of the He line is about 35%, which is very large.

4. Abundance surface mapping

We interpret the observed monoperiodic variability of the four studied stars to their rotation and inhomogeneities of elements on their stellar surface. The best method available to map sur-face abundances of CP stars is the Doppler Imaging tech-nique. Thanks to the code INVERS11 developed by Piskunov, we mapped the surface silicon and helium abundance by using the Si II 4128−4130 doublet, the He I 4121 Å line and the He I 4143 Å line. For a detailed description of the code INVERS11, we refer to Appendix A and to L¨uftinger et al. (2003). For the spectral synthesis of local line profiles, model atmospheres were calculated with Kurucz’s ATLAS9

(5)

-10 -5 0 5 10 0 0.2 0.4 0.6 0.8 1 <v> Phase (f=0.4786 c d-1) 800 1000 1200 1400 1600 1800 2000 2200 0 0.2 0.4 0.6 0.8 1 <v 2> Phase (f=0.4786 c d-1) -60000 -40000 -20000 0 20000 40000 60000 0 0.2 0.4 0.6 0.8 1 <v 3> Phase (f=0.4786 c d-1) -10 -5 0 5 10 0 0.2 0.4 0.6 0.8 1 <v> Phase (f=0.4786 c d-1) 1600 1800 2000 2200 2400 2600 0 0.2 0.4 0.6 0.8 1 <v 2> Phase (f=0.4786 c d-1) -40000 -20000 0 20000 40000 0 0.2 0.4 0.6 0.8 1 <v 3> Phase (f=0.4786 c d-1)

Fig. 3. For HD 138769, first three observed moments of the Si II 4128 Å line (dots, left) and of the He I 4121 Å line (dots, right). < v >,

< v2> and < v3> are expressed respectively in km s−1, (km s−1)2and (km s−1)3. The full lines represent the best harmonic fits for the indicated frequency.

programs (Kurucz 1992, 1993). The Vienna Atomic Line Database (VALD, Piskunov et al. 1995; Ryabchikova et al. 1999; Kupka et al. 1999) provided the atomic line data. Spectra were synthesized with the program SYNTH (Piskunov 1992). We started with solar abundances and adjusted them by com-paring observed and calculated spectra.

4.1. HD 131120

Our mapping of the star HD 131120 was performed in the fol-lowing way. We varied the parameters Teff and log g around

their values derived from Geneva photometry. All derived maps showed very similar distributions of elements. We then decided to choose the maps for the Teff and log g values found from

Geneva data. To illustrate it, the left and right upper part of Fig. 6 correspond respectively to Teff = 18 600 K, log g = 4.2

(values found by de Geus 1989) and Teff = 18 250 K, log g =

4.1 (Table 3). The figures are divided as follows:

a– is the mercator projection of the abundance distribution and comprises contour lines around regions of equal abun-dance;

b– shows the mapped stellar surface in four rotational phases (0.0, 0.25, 0.5, 0.75). Below each phase, values for the mean abundance averaged over the visible part can be found. Dark colour means high, bright colour means low abundance.

The projected rotational velocity v was derived so that the-oretical profiles reproduce the observed width of the line. A first estimate for the angle of inclination i was determined from

Pobs= 2πR sin i/vΩ by taking into account the uncertainty on

the stellar radius R listed in Table 3. Consequently we var-ied v from 55 km s−1 to 65 km s−1 with a step of 5 km s−1 and i from 20◦ to 60◦ with a step of 10◦. We then chose the combination of parameters which minimizes the residuals be-tween observations and the computed line profiles. Note that a difference of 10◦for the inclination does not change very much the outcome, as illustrated in Fig. 6.

The final maps were computed for Teff= 18 250 K, log g =

4.1, v= 60 km s−1and i= 30◦. The right upper part of Fig. 6 was derived from the He I 4121 Å line, the left middle part of Fig. 6 from the same line but for i= 40◦, the right middle part of Fig. 6 from the He I 4143 Å line, the left lower part of Fig. 6

(6)

-6 -4 -2 0 2 4 6 0 0.2 0.4 0.6 0.8 1 <v> Phase (f=0.3664 c d-1) 900 1000 1100 1200 1300 1400 1500 1600 1700 0 0.2 0.4 0.6 0.8 1 <v 2> Phase (f=0.3664 c d-1) -25000 -20000 -15000 -10000 -5000 0 5000 10000 15000 20000 25000 0 0.2 0.4 0.6 0.8 1 <v 3> Phase (f=0.3664 c d-1) -15 -10 -5 0 5 10 15 0 0.2 0.4 0.6 0.8 1 <v> Phase (f=0.3664 c d-1) 1600 1800 2000 2200 2400 2600 0 0.2 0.4 0.6 0.8 1 <v 2> Phase (f=0.3664 c d-1) -60000 -40000 -20000 0 20000 40000 60000 0 0.2 0.4 0.6 0.8 1 <v 3> Phase (f=0.3664 c d-1)

Fig. 4. For HD 55522, first three observed moments of the Si II 4128 Å line (dots, left) and of the He I 4121 Å line (dots, right). < v >, < v2> and < v3> are expressed respectively in km s−1, (km s−1)2and (km s−1)3. The full lines represent the best harmonic fits for the indicated frequency. from the He I 4121 Å line taking into account the blends of Fe

and O and the right lower part of Fig. 6 from the Si II-doublet with lines at λλ 4128, 4130 Å. Taking into account blends of other elements evidently gives a better fit to line-profile varia-tions but does not change the structure of the maps. Figure 7 compares the observed and the calculated He and Si profiles at different phases of observation from phase zero (top) to the end of the rotation period (bottom).

The right middle and left lower part of Fig. 6 show that helium is globally significantly depleted at the stellar surface relative to solar abundance (−1.05 dex). We find good agree-ment in both maps in the reproduction of the overabundance spots. A difference between the maps derived for He 4121 and He 4143 can be noted. A more pronounced underabundance centered at the pole (and the less pronounced underabundance around longitude 280) occurs in the He 4143 map. This might be due to the fact that a DI code tends to over- or underinterpret abundances in less visible regions like the pole or sub-observer points, if it does not reach a perfect fit otherwise. Generally abundances in intermediate latitudes are more trustworthy than in extreme regions, especially if there is a mismatch between different lines of the same element. A comparison between, on the one hand the right middle and left lower part of Fig. 6, and

on the other hand the right lower part of Fig. 6, shows that he-lium is enhanced in regions of the stellar surface where silicon is depleted and inversely.

4.2. HD 105382

In this section we derive abundance surface maps for HD 105382. For HD 131120 we have shown that an uncer-tainty of a few hundred Kelvin on Teff and of 0.1 on log g

does not influence significantly the outcome of the Doppler mapping. We therefore fixed the values of these parameters to those found from Geneva photometry. We varied v from 60 km s−1to 75 km s−1with a step of 5 km s−1and i from 20◦ to 60◦with a step of 10◦in order to choose the parameters that minimize the deviation between observations and computed line profiles. As for the previous star, an angle of inclination of the star i that is 10◦lower or higher led to very similar maps. It was then not useful to refine the grid of parameters. The de-rived maps are shown in Fig. 8 for silicon and helium. Figure 9 compares the observed and the calculated He and Si profiles at different phases of observation from phase zero (top) to the end of the rotation period (bottom).

(7)

0.075 0.085 0.095 0.105 0 0.2 0.4 0.6 0.8 1 EW Phase (f=0.7721 c d-1) 0.09 0.11 0.13 0.15 0.17 0.19 0 0.2 0.4 0.6 0.8 1 EW Phase (f=0.7721 c d-1) 0.04 0.045 0.05 0.055 0.06 0.065 0.07 0.075 0.08 0 0.2 0.4 0.6 0.8 1 EW Phase (f=0.4786 c d-1) 0.14 0.16 0.18 0.2 0.22 0.24 0.26 0 0.2 0.4 0.6 0.8 1 EW Phase (f=0.4786 c d-1) 0.065 0.07 0.075 0.08 0.085 0.09 0.095 0.1 0 0.2 0.4 0.6 0.8 1 EW Phase (f=0.3664 c d-1) 0.14 0.16 0.18 0.2 0.22 0.24 0.26 0.28 0.3 0.32 0.34 0 0.2 0.4 0.6 0.8 1 EW Phase (f=0.3664 c d-1)

Fig. 5. For HD 105382 (upper), HD 138769 (middle) and HD 55522 (lower), observed equivalent width variations of the Si II 4128 Å line (dots, left) and of the He I 4121 Å line (dots, right), expressed in Å. The full line is the best fit for the equivalent width.

We conclude the following. Silicon is depleted on aver-age over the stellar surface compared to the Sun (−4.49 dex). Helium is significantly depleted on the majority of the stel-lar surface. On average the stelstel-lar surface is very depleted in helium compared to the solar abundance. Two strong spots have a longitude difference of 180◦. This corresponds to the two bumps observed in the first moment of the line (see right part of Fig. 1). A less strong third spot is also visible. As for HD 131120 the comparison of maps of both elements shows that roughly where helium is depleted, silicon is enhanced and vice versa. This corresponds to the dephasing observed in the first moment of the lines (see Fig. 1).

4.3. HD 138769

We derived abundance maps for silicon and helium for HD 138769 by taking Teff = 17 500 K and log g = 4.2 and by

varying vfrom 60 km s−1to 70 km s−1with a step of 5 km s−1 and i from 30◦to 70◦with a step of 10◦. The best silicon map was obtained for v = 70 km s−1 and i = 40◦ and is shown in Fig. 10. Silicon is clearly underabundant compared to the

Sun. Its observed mean abundance is constant during the rota-tion of the star. A depleted region is found at the pole while an enhanced spot is situated at the equator. As for HD 131120 (Sect. 4.1), the same remark holds for depleted Si at the pole of HD 138769. We have less confidence in the polar spot, while the appearence of a real overabundant region at the equator is strengthened by an increase in the equivalent width of the spec-tral lines. For helium the deviation between observed and cal-culated profiles is very large so that we have less confidence concerning the reliability of the derived map. However it is clear that the star is also a He-weak star since the helium mean abundance is lower than the solar abundance. Figure 11 com-pares the observed and the calculated Si profiles at different phases of observation from phase zero (top) to the end of the rotation period (bottom).

4.4. HD 55522

We derived abundance maps for silicon and helium for HD 55522 in the same way as for the previous stars. We took

(8)

Fig. 6. The abundance distributions on the surface of HD 131120 obtained with INVERS11. Upper left: from the He I 4121 Å line for Teff =

18 600 K, log g= 4.2, v= 60 km s−1and i= 30◦. Upper right: from the He I 4121 Å line for Teff = 18 250 K, log g = 4.1, v= 60 km s−1 and i= 30◦. Middle left: from the He I 4121 Å line for Teff = 18 250 K, log g = 4.1, v= 60 km s−1and i= 40◦. Middle right: from the He I 4143 Å line for Teff = 18 250 K, log g = 4.1, v= 60 km s−1and i= 30◦. Lower left: from the He I 4121 Å line for Teff= 18 250 K, log g = 4.1, vΩ= 60 km s−1and i= 30◦, taking into account the blends of Fe and O. Lower right: from the Si II 4128-4130 Å doublet for Teff = 18 250 K,

(9)

Fig. 7. For HD 131120, observed line profiles (crosses) of the Si II 4128−4130 Å lines (left) and of the He I 4121 Å line (right) at different phases of observation and computed line profiles (full lines) obtained with INVERS11.

We varied vfrom 70 km s−1to 80 km s−1 with a step of 5 km s−1and i from 60◦to 90◦with a step of 10◦. The optimum maps were obtained for v= 75 km s−1and i= 80◦. They are shown in Fig. 12 for Si and He. Figure 13 compares the ob-served and the calculated He and Si profiles at different phases of observation from phase zero (top) to the end of the rotation period (bottom). For silicon, depleted regions compared to the rest of the stellar surface are situated along the equator while enhanced regions are close to the poles. The average abundance of silicon over the stellar surface is almost constant and lower than solar abundance. The mean abundance of helium varies by 0.8 dex on half a period of rotation, which reflects the very large variations of the equivalent width of this line. A strong helium spot is present on the equator surrounded by a very de-pleted region. For this star, the maps of both elements are very different as already suggested by the very different variations of the moments of the different lines.

4.5. Summary

In Table 4 we summarize the physical parameters that we found for the four chemically peculiar B stars from the Doppler map-ping. The rotation periods are well determined, which is the case for very few single B stars. The radii are compatible with the values derived from the photometric calibrations listed in Table 3 and are hence an independent spectroscopic confirma-tion. Equatorial velocities are around 100 km s−1. Silicon is found slightly underabundant for the four stars. However their average Si equivalent widths are not too different from the ones of confirmed SPBs (De Cat 2001). Three stars have on average an abundance of helium smaller than the solar one which is −1.05 dex. For HD 131120, helium is underabundant by a fac-tor of 12 and for HD 105382, helium is underabundant by a factor of 4.5. HD 138769 is also He-weak while HD 55522 has on average the solar helium abundance. Future magnetic field measurements on the one hand would be very helpful to under-stand the surface abundance patterns of our four studied stars. On the other hand, it would be interesting to try and explain our findings for the surface helium and silicon structures from diffusion processes as they are currently understood.

5. Conclusions

When the observed variability is monoperiodic, it can be un-clear from the analysis of the variations of one single line pro-file to which cause they must be attributed. However, the com-parison of the moment variations of different spectral lines of silicon and helium appeared to be very useful to exclude pul-sation as being the cause of the observed monoperiodic vari-ability of the four distinct stars of our sample of candidate SPBs. The peculiarities of these stars compared to confirmed SPBs are the following. The stars appear to be monoperiodic while SPBs of our sample are generally multiperiodic (De Cat 2001; Mathias et al. 2001). The photometry and spectroscopy led to the same period, which is 1.569 days for HD 131120, 1.295 days for HD 105382, 2.089 days for HD 138769 and 2.769 days for HD 55522. The moments of the studied spec-tral lines are not sinusoidal but harmonics of the frequency are also present in them. For HD 55522, such a non-sinusoidal sig-nal is also observed in HIPPARCOS and Geneva photometry. The moments computed from the Si II 4128−4130 Å doublet and from the He I 4121 Å line do not behave in the same way and are not in phase. The equivalent width variations are large compared to those of SPBs. In particular, the relative EW vari-ation of the He I 4121 Å line for HD 55522 is about 35% which is remarkably large. All these characteristics cannot be repro-duced by pulsation.

In Briquet et al. (2001b) we showed that a good explanation for the variability of the star HD 131120 is its rotation in the presence of non-homogeneous distributions of elements on the stellar surface. As the moments of the line profiles of the three other stars vary in a very similar way as those of HD 131120, we also interpreted their variability in terms of rotational mod-ulation. For the four stars, we derived stellar surface abundance maps for silicon and helium by means of the Doppler Imaging technique. A future goal is to derive the surface abundance

(10)

Table 4. Physical parameters of our four targets, derived from Doppler mapping. HD 131120 HD 105382 HD 138769 HD 55522 Prot(days) 1.569± 0.001 1.295± 0.001 2.089± 0.001 2.729± 0.001 i 30◦± 10◦ 50◦± 10◦ 40◦± 10◦ 80◦± 10◦ veq(km s−1) [86; 190] [75; 116] [85; 150] [70; 85] R (R ) [2.7; 5.9] [1.9; 3.0] [3.5; 6.2] [3.8; 4.6] Average Si abundance (dex) −4.59 −4.76 −5.35 −4.92 Si abundance range (dex) [−4.53; −4.02] [−5.36; −4.16] [−5.70; −5.05] [−5.29; −4.49] Average He

abundance (dex) −2.12 −1.70 He-weak −1.06

He abundance

range (dex) [−2.53; −1.48] [−2.34; −0.82] ? [−2.26; 0.46]

Fig. 8. The silicon distribution (left) and the helium distribution (right) on the surface of HD 105382 obtained with INVERS11 from the Si II 4128−4130 Å doublet and from the He I 4121 Å line for Teff= 17 400 K, log g = 4.2, vΩ= 70 km s−1and i= 50◦.

Fig. 10. The silicon distribution on the surface of HD 138769 ob-tained with INVERS11 from the Si II 4128−4130 Å doublet for Teff=

17 500 K, log g= 4.2, v= 70 km s−1and i= 40◦.

mapping for more elements in these four stars. For HD 131120, we found that helium is significantly depleted over all its stel-lar surface, which confirms that the star is a He-weak star as

already reported in the literature. For this star, regions in which helium is enhanced correspond to regions in which silicon is depleted. This result is also found for HD 105382 that we clas-sify as a new He-weak star since we also found that helium is depleted on average over the whole stellar surface. HD 138769, which is reported as a shell star in the literature, is clearly a Bp He-weak star for which helium is underabundant compared to the Sun but also silicon. For HD 55522, we found the mean abundance value of helium to vary by 0.8 dex during the stellar rotation.

We point out that it is the first time that such detailed spec-troscopic analyses and abundance mapping are performed for chemically peculiar B stars with such a high Teff of about

17 500 K. Theoretical diffusion models for such temperatures are needed for a comparison. Moreover, inhomogeneities on the stellar surface are probably correlated to a magnetic field. A search for a magnetic field was only performed for the star HD 131120 but was not conclusive. Such investigations would then be very useful for a better understanding of the surface patterns of these four stars.

Acknowledgements. We thank the referee, Dr. A. P. Hatzes, for his

useful suggestions, which helped us to improve this paper. This work was supported by the P.A.I. (Pˆole d’Attraction Interuniversitaire) and

(11)

Fig. 12. The silicon distribution (left) and the helium distribution (right) on the surface of HD 55522 obtained with INVERS11 from the Si II 4128−4130 Å doublet and from the He I 4121 Å line for Teff= 17 400 K, log g = 4.1, vΩ= 75 km s−1and i= 80◦.

was carried out within the Belgian Asteroseismology Group. The au-thor from Vienna received funding from the “Fonds zur F¨orderung der wissenschaftlichen Forschung”, Project P14984.

References

Aerts, C., De Pauw, M., & Waelkens, C. 1992, A&A, 266, 294 Aerts, C., De Cat, P., Peeters, E., et al. 1999, A&A, 343, 872 Briquet, M., Aerts, C., & De Cat, P. 2001a, A&A, 366, 121

Briquet, M., De Cat, P., Aerts, C., & Scuflaire, R. 2001b, A&A, 380, 177

De Cat, P. 2001, Ph.D. Thesis, Katholieke Universiteit Leuven, Belgium

de Geus, E. J., de Zeeuw, P. T., & Lub, J. 1989, A&A, 216, 44 De Ridder, J., Dupret, M. A., Neuforge, C., & Aerts, C. 2002, A&A,

385, 572

Flower, P. J. 1996, ApJ, 469, 355

Kochukhov, O., & Piskunov, N. 2002a, A&A, 388, 868

Kochukhov, O., Piskunov, N., Ilyin, I., et al. 2002b, A&A, 389, 420 K¨unzli, M., North, P., Kurucz, R. L., & Nicolet, B. 1997, A&AS, 122,

51

Kupka, F., Piskunov, N. E, Ryabchikova, T. A., et al. 1999, A&AS, 138, 119

Kurucz, R. L. 1992, Stellar Population of Galaxies, ed. B. Barbuy, & A. Renzini, IAU Symp., 149, 225

Kurucz, R. L. 1993, ATLAS9, Stellar Atmosphere Programs, CD-ROM No. 13, Smithonian Astrophysical Observatory

Kuschnig, R., Ryabchikova, T. A., Piskunov, N., et al. 1999, A&A, 348, 924

L¨uftinger, T., Kuschnig, R., Piskunov, N., & Weiss, W. W. 2003, A&A, accepted

Mathias, P., Aerts, C., Briquet, M., et al. 2001, A&A, 379, 905 Piskunov, N. E. 1992, in Stellar magnetism, ed. V Yu., I. I.

Glagolevskij, Romanyuk (St Petersburg, Nauka), 92

Piskunov, N. E., Kupka, F., Ryabchikova, T. A., et al. 1995, A&AS, 112, 525

Piskunov, N., & Kochukhov, O. 2002, A&A, 381, 736 Roberts, D. H., Lehar, J., & Dreher, J. W. 1987, AJ, 93, 968

Ryabchikova, T. A., Piskunov, N. E., Stempels, H. C., et al. 1999, Physica Scripta, vol. T83, 162

Scargle, J. D. 1981, ApJS, 45, 1

Schaller, G., Schaerer, D., Meynet, G., & Maeder, A. 1992, A&A, 96, 269

Stellingwerf, R. F. 1978, ApJ, 224, 953

(12)

M. Briquet et al.: He and Si surface inhomogeneities of four Bp variable stars, Online Material p 1

(13)

M. Briquet et al.: He and Si surface inhomogeneities of four Bp variable stars, Online Material p 2

Appendix A: DI code INVERS11

The DI code used in this paper was created as a spin-off of a much more complex work on the magnetic DI code INVERS10. INVERS10 was successfully tested and applied to several magnetic CP stars. The description of the code, nu-merical experiments and applications can be found in Piskunov & Kochukhov (2002), Kochukhov & Piskunov (2002a) and Kochukhov et al. (2002b). INVERS11 incorporates the main features of the magnetic code including non-equispaced spa-tial grid, adaptive wavelength grid, radiative transfer integra-tion combined with the inverse problem solving, implementa-tion of parallel calculaimplementa-tions etc. The main differences are:

– magnetic fields are not included in calculations and thus a

conventional Feautrier method was selected to compute the emerging spectra;

– since the spectra are re-computed on each iteration there

is no fundamental limit on a number of chemical elements mapped simultaneously.

The second property proved to be very useful when dealing with fast rotating stars with rather limited selection of spec-tral features. Many of these features represent blends of lines of different chemical elements all of which are inhomoge-neously distributed over stellar surface (see e.g. Kuschnig et al. 1999). INVERS11 is sufficiently fast to be used on a single or multi-processor workstation and a typical map is produced in a matter of minutes. The input data besides the spectroscopic observations include the projected rotational velocity v sin i, the inclination of rotational axis i, spectral resolution of the data, the regularization parameter and the initial guess for the abundances.

The solution of the inverse problem is an iterative process during which the code re-computes synthetic spectra and ad-justs the abundance maps in order to obtain the optimal fit to the data. The gradients in the maps are restricted by the regu-larization function in such a way that the code starts with the lowest spatial frequencies of the solution and gradualy recovers smaller features. The code stops when the data is reproduced within the error bars or when the reproduction of the data can-not be improved.

Fig. 9. For HD 105382, observed line profiles (crosses) of the Si II 4128−4130 Å lines (left) and of the He I 4121 Å line (right) at different phases of observation and computed line profiles (full lines) obtained with INVERS11.

(14)

M. Briquet et al.: He and Si surface inhomogeneities of four Bp variable stars, Online Material p 3 Table 1. Logbook of the observations of our targets.

Number of observations Total time-span (days) HIPPARCOS Geneva Spectra HIPPARCOS Geneva Spectra

HD 105382 172 132 105 1173 123 719

HD 131120 53 108 77 861 117 476

HD 138769 83 92 35 1123 116 691

HD 55522 187 112 56 1149 417 666

Table 2. Observing log for spectroscopy.

HD 105382 HD 131120 HD 138769 HD 55522

Number of JD Number of JD Number of JD Number of JD

observations 2 450 000+ observations 2 450 000+ observations 2 450 000+ observations 2 450 000+

Start End Start End Start End Start End

44 163 170 27 163 170 9 188 194 6 166 170 12 188 194 15 188 194 12 272 277 9 188 194 11 272 277 13 272 277 1 513 513 14 490 498 10 490 498 4 490 498 1 526 526 8 736 742 4 513 528 4 513 528 3 571 576 7 779 786 3 571 576 6 571 576 2 608 608 12 825 831 1 608 608 8 633 638 6 633 638 7 633 638 1 878 878 3 779 786 8 825 831 2 882 882

(15)

M. Briquet et al.: He and Si surface inhomogeneities of four Bp variable stars, Online Material p 4

Fig. 11. For HD 138769, observed line profiles (crosses) of the Si II 4128−4130 Å lines at different phases of observation and com-puted line profiles (full lines) obtained with INVERS11.

Fig. 13. For HD 55522, observed line profiles (crosses) of the Si II 4128−4130 Å lines (left) and of the He I 4121 Å line (right) at different phases of observation and computed line profiles (full lines) obtained with INVERS11.

Figure

Table 3. Physical parameters of the four studied stars. HD 131120 HD 105382 HD 138769 HD 55522 T e ff (K) 18 250 ± 420 17 400 ± 400 17 500 ± 400 17 400 ± 400 log g 4.10 ± 0.15 4.18 ± 0.15 4.22 ± 0.15 4.15 ± 0.15 log L/L  3.13 ± 0.15 2.89 ± 0.15 2.98 ± 0.15
Fig. 1. For HD 105382, first three observed moments of the Si II 4128 Å line (dots, left) and of the He I 4121 Å line (dots, right)
Fig. 2. For HD 138769 (upper) and HD 55522 (lower), phase diagrams of the HIPPARCOS data and of the U-magnitude data (dots) are compared with their best sinusoidal fits for the indicated frequency (full lines).
Fig. 3. For HD 138769, first three observed moments of the Si II 4128 Å line (dots, left) and of the He I 4121 Å line (dots, right)
+7

Références

Documents relatifs

DACOROGNA, Existence of Solutions for a Variational Problem Associated to Models in Optimal Foraging Theory, J. DACOROGNA, Existence and Non-Existence Results for

For example, 19 LINCS cell lines (e.g., HeLa cell) were derived from patients with cervical adenocarcinoma, 4 with cervical clear cell adenocarcinoma (a specific type

An algebraic variety can be described as the set of points in C m satisfying certain equations with algebraic coefficients; and this is a subset of the algebraic variety given by

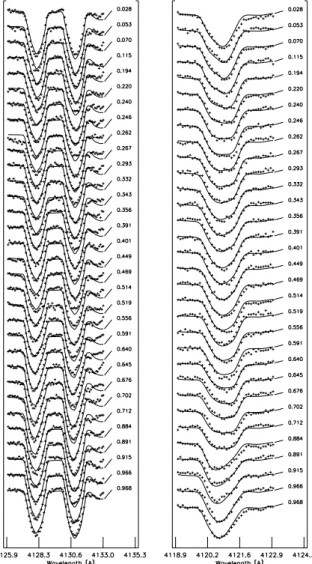
The first one arises from the bulk part of the grain and causes a relatively sharp line, while the second is arising from the surface layers where the magnetic

We have analysed the time evolution of the Axial Dipole Moments (ADMs) from three numerical geodynamo models by relating it to the Fokker-Planck equation gov- erning the systematic

Highlights • Close-coupling values of pressure broadening and shift coefficients for HD in He • Close-coupling values of the complex Dicke parameters • Line shape parameters of

Key words and phrases: Rank one flows, spectral type, simple Lebesgue spectrum, singular spectrum, Salem-Zygmund Central Limit Theorem, Banach problem, Banach-Rhoklin

Key words and phrases: Rank one flows, spectral type, simple Lebesgue spectrum, singular spectrum, Salem-Zygmund Central Limit Theorem, Riesz