Biogeochemistry and carbon mass balance of a
coccolithophore bloom in the northern Bay of Biscay
(June 2006)
INTRODUCTIONPrimary production (PP), calcification (CAL), bacterial production (BP) and dark community respiration (DCR) were measured along with a set of various biogeochemical variables, in early June 2006, at several stations at the shelf break of the northern Bay of Biscay. The cruise was carried out after the main spring diatom bloom that, based on the analysis of a time-series of remotely sensed chlorophyll-a (Chl-a), peaked in mid-April (Fig. 1).
ENVIRONMENTAL SETTINGS
Vertical profiles of temperature acquired during the cruise (Fig. 1b), as confirmed by remotely sensed sea surface temperature (SST, Fig. 2a) indicated the occurrence of enhanced vertical mixing (due to internal tides) at the continental slope, while adjacent waters on the continental shelf were stratified. The surface layer of the stratified water masses (on the continental shelf) exhibited high Chl-a concentrChl-ation (Fig. 2b) Chl-and wChl-as depleted of inorgChl-anic nutrients. Dissolved silicate (DSi) levels probably did not allow significant diatom development. WORKING HYPOTHESIS
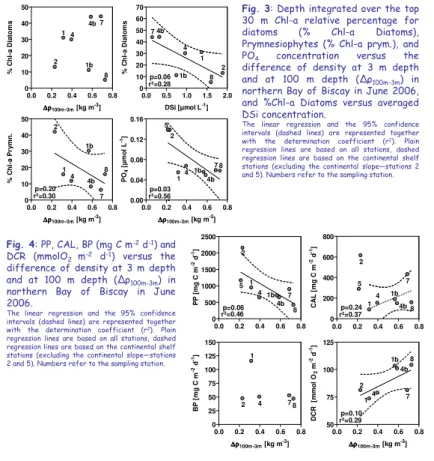
We hypothesize that mixing at the continental slope allowed the injection of inorganic nutrients that triggered the blooming of mixed phytoplanktonic communities dominated by coccolithophores (Emiliania huxleyi), as shown by high reflectance patches (HR, Fig. 2c), that were favoured with regards to diatoms due to the low DSi levels (Fig. 3). Based on this conceptual frame, we used an indicator of vertical stratification (Δρ100m-3m)to classify the different sampled stations, and to reconstruct the possible evolution of the bloom from the onset at the continental slope (triggered by vertical mixing) through its development as the water mass was advected on-shelf and stratified.
RESULTS
The increase of CAL for stations over the shelf (excluding stations 2 and 5) is characteristic of coccolithophore bloom development from high-PP and low-CAL during the early bloom phase to low-PP and high-CAL during stationary and declining bloom phases (Fig. 4). Such a change was accompanied by an increase of heterotrophic processes, as featured by the increase of DCR with stratification, although there was no pattern of BP with stratification.
We established a carbon mass balance of net community production (NCP) at each station by integrating in the photic layer PP, CAL and DCR C fluxes. This allowed computation at each station of the contribution of PP, CAL and DCR to CO2fluxes in the photic layer, and how they changed from one station to another along the sequence of bloom development (as traced by the stratification indicator). Table 1: Metabolic CO2fluxes [mmol C m-2 d-1] based on a mass balance where the14C
incubations are assumed to correspond to gross primary production (GPPp), where DCR is the
sum of autotrophic and heterotrophic respiration based on O2incubations converted to C units
using a respiratory quotient of 1, and where CAL is the rate of calcification based on14C
incubations. Metabolic CO2 fluxes related to CAL were computed as +0.6×CAL, following
Frankignoulle et al. (1994).
The early bloom phase (stations 2 and 1) was characterized by high PP and CAL values (Table 1). The net metabolic CO2fluxes (-67.9 mmol C m-2d-1at station 2) had the same direction as the air–sea CO2flux (-11.4 mmol C m-2d-1). At station 2, the NCP was positive, indicating a net autotrophic status leading to a positive potential C export (+98.7 mmol C m-2d-1) that was of the same order of magnitude as the aphotic pelagic C demand (89.0 mmol C m-2d-1).
At the stations representative of more developed and declining bloom conditions (stations 4, 4bis, 7 and 8), PP and CAL were lower than the early bloom phase (stations 2 and 5), and NCP was neutral or negative, indicating a balanced or a net heterotrophic status(ranging from +5.5 to -68.8 mmol C m-2d-1).
CONCLUSIONS
The pCO2measurements indicated that surface waters acted as a net sink for
atmospheric CO2 during all phases of the bloom. Hence, CAL related to
coccolithophore blooms had the potential to decrease the sink of atmospheric CO2 but did not reverse the direction of the flux. Net community autotrophy was only found for the early phase of the bloom. During the maturing and declining phases of the bloom, potential export from the photic layer could not meet the aphotic C demand. This suggested the importance of extracellular production of carbon to sustain the bacterial demand in the photic and aphotic layers.
Harlay J.
1, Chou L.
2, Van Oostende N.
3,4,Sabbe K.
3, and Borges A.V.
1Fig. 2: a- AVHRR sea surface temperature (SST) in the northern Bay of Biscay, showing the location of the stations, the 200 m and 2000 m isobaths, b- MODIS chlorophyll-a (Chl-a) and c- Reflectance satellite images.
0.2 0.4 0.8 2 5 0.08 1 2 3 4 5 6 7 8 2006/06/05 1 2 3 4 6 7 8 2006/06/05 5 6 W 8 W 12 W 10 W 14 W 14 W 12 W 10 W 8 W 6 W a 52 51 50 49 48 47 b 6 W 8 W 12 W 10 W 14 W 52 51 50 49 48 47 1 3 4 5 6 7 8 2006/06/05 c 2 2 0 0 m 2 0 0 0 m 0.2 0.4 0.8 2 5 0.08 1 2 3 4 5 6 7 8 2006/06/05 0.2 0.4 0.8 2 5 0.08 1 2 3 4 5 6 7 8 2006/06/05 1 2 3 4 6 7 8 2006/06/05 5 1 2 3 4 6 7 8 2006/06/05 1 2 3 4 6 7 8 2006/06/05 5 6 W 8 W 12 W 10 W 14 W 14 W 12 W 10 W 8 W 6 W a 52 51 50 49 48 47 b 6 W 8 W 12 W 10 W 14 W 52 51 50 49 48 47 1 3 4 5 6 7 8 2006/06/05 c 2 1 3 4 5 6 7 8 2006/06/05 c 2 2 0 0 m 2 0 0 0 m 0 50 100 150 200 m ix e d la y e r d e p th ( m ) 0.00 0.25 0.50 0.75 1.00 1.25 1.50 m W c m -2 µ m -1 s r -1 0 1 2 3 4 5 10 12 14 16 18 20 22 J F M A M J J A S Months (2006) µ g L -1 °C Chl-a nWLr SST MLd Cruise
Fig. 1: a-Time series of remotely sensed weekly Chl-a concentrations and normalized water-leaving radiance @555 nm (nWLr), modelled daily mixed layer depth (MLd) and SST in the study area from January to September 2006. b-Vertical profile of temperature. Black profiles correspond to the stations (2 and 5) located on the continental slope. Chl-a and nWLr are Level-3 SeaWiFS data (http://reason.gsfc.nasa.gov/Giovanni/) and MLd and SST were simulated with Met Office National Centre for Ocean Forecasting for the North-East Atlantic 1/8° model (http://www.nerc-essc.ac.uk/godiva/).
References:
Frankignoulle et al. (1994). Limnology and Oceanography 39, 458–462.
Affiliations:
1. Université de Liège (ULg) - Chemical Oceanography Unit
2. Université Libre de Bruxelles (ULB) - Laboratoire d’Océanographie physique et Géochimie des Eaux 3. Ghent University (UGhent) - Protistology & Aquatic Ecology
4. Princeton University – Dept. Geosciences Acknowledgments:
The authors are grateful to the officers and crewmembers of the R/V Belgica and the Unit of the North Sea Mathematical Models (Brussels/Oostende, Belgium) for their support in data acquisition. T. Smyth and P. Miller (PML) provided the AVHRR images. This study was financed by the Belgian Federal Science Policy Office in the framework of the PEACE project (contract no. SD/CS/03A/B) and by the Helmholtz Association (contract no. HZ-NG-102). JH is postoctoral research associate at the F.R.S-FNRS. AVB is research associate at the F.R.S-FNRS. N. Van Oostende received a PhD grant from the Institute for the Promotion of Innovation through Science and Technology in Flanders (IWT-Vlaanderen) and is postdoctoral research associate at Princeton University. This work is a contribution to the EU FP6 European Network of Excellence EUR–OCEANS (contract no. 511106-2) and EU IP CARBOOCEAN (contract no. 511176).
http://www.co2.ulg.ac.be/peace 0.0 0.2 0.4 0.6 0.8 0 10 20 30 40 50 2 1 4 1b 4b 7 8 ∆ρ ∆ρ∆ρ ∆ρ100m-3m [kg m-3] % C h l-a D ia to m s 0.0 0.5 1.0 1.5 2.0 0 10 20 30 40 50 60 70 2 1 4 1b 4b 7 8 r²=0.28 p=0.06 DSi [µmol L-1] % C h l-a D ia to m s 0.0 0.2 0.4 0.6 0.8 0 10 20 30 40 50 2 1 4 1b 4b 7 8 r²=0.30 p=0.20 ∆ρ ∆ρ∆ρ ∆ρ100m-3m [kg m-3] % C h l-a P ry m n . 0.0 0.2 0.4 0.6 0.8 0.00 0.04 0.08 0.12 0.16 2 14 1b4b 7 8 5 r²=0.56p=0.03 ∆ρ ∆ρ∆ρ ∆ρ100m-3m [kg m-3] P O4 [ µ m o l L -1] 0.0 0.2 0.4 0.6 0.8 0 500 1000 1500 2000 2500 5 2 1 4 1b 4b 7 8 r²=0.46p=0.06 P P [ m g C m -2 d -1] 0.0 0.2 0.4 0.6 0.8 0 200 400 600 800 2 5 1 4 1b 4b 7 8 r²=0.37p=0.24 C A L [ m g C m -2 d -1] 0.0 0.2 0.4 0.6 0.8 0 25 50 75 100 125 150 2 1 4 7 8 ∆ρ ∆ρ∆ρ ∆ρ100m -3m [kg m-3] B P [ m g C m -2 d -1] 0.0 0.2 0.4 0.6 0.8 50 75 100 125 2 14 1b 4b 7 8 r²=0.29p=0.10 ∆ρ ∆ρ∆ρ ∆ρ100m-3m [kg m-3] D C R [m m o l O2 m -2 d -1]
Fig. 3: Depth integrated over the top 30 m Chl-a relative percentage for
diatoms (% Chl-a Diatoms),
Prymnesiophytes (% Chl-a prym.), and
PO4 concentration versus the
difference of density at 3 m depth
and at 100 m depth (Δρ100m-3m) in
northern Bay of Biscay in June 2006, and %Chl-a Diatoms versus averaged DSi concentration.
The linear regression and the 95% confidence intervals (dashed lines) are represented together with the determination coefficient (r2). Plain
regression lines are based on all stations, dashed regression lines are based on the continental shelf stations (excluding the continental slope—stations 2 and 5). Numbers refer to the sampling station.
Fig. 4: PP, CAL, BP (mg C m-2d-1) and
DCR (mmolO2 m-2 d-1) versus the
difference of density at 3 m depth
and at 100 m depth (Δρ100m-3m) in
northern Bay of Biscay in June 2006.
The linear regression and the 95% confidence intervals (dashed lines) are represented together with the determination coefficient (r2). Plain
regression lines are based on all stations, dashed regression lines are based on the continental shelf stations (excluding the continental slope—stations 2 and 5). Numbers refer to the sampling station.