This is an author-deposited version published in: http://oatao.univ-toulouse.fr/ Eprints ID: 17512
To cite this version:
Barus, Matthias and Welemane, Hélène and Collombet, Francis and
Pastor, Marie-Laetitia and Cantarel, Arthur and Nassiet, Valérie and
Crouzeix, Laurent and Grunevald, Yves-Henri A New NDT Method for the
study of composite bonded repair. (2016) In: 17th European Conference
on Composite Materials - ECCM17, 26 June 2016 - 30 June 2016
(Munich, Germany).
O
pen
A
rchive
T
oulouse
A
rchive
O
uverte (
OATAO
)
OATAO is an open access repository that collects the work of Toulouse researchers and makes it freely available over the web where possible.
Any correspondence concerning this service should be sent to the repository administrator: [email protected]
A NEW NDT METHOD FOR THE STUDY OF COMPOSITE BONDED
REPAIR
M. Barus1,2, H. Welemane2, F. Collombet1, M.L.Pastor3, A. Cantarel3, V. Nassiet2, L. Crouzeix1, Y.H. Grunevald4
1Universit´e de Toulouse, UT3, Toulouse, France
Email: [email protected], www.institut-clement-ader.org, www.enit.fr
2Universit´e de Toulouse, INP ENIT-LGP, Tarbes, France 3Institut Cl´ement Ader, IUT de Tarbes, Dpt GMP, Tarbes, France
4Composites Expertise & Solutions, Castanet Tolosan, France
Keywords: composite materials, bonded repair, infrared thermography, joint response
Abstract
This paper deals with the non destructive analysis of bonded repaired CFRP laminates by means of an active Infrared Thermography (IT) approach. The challenging issue comes from the weak property contrast between parts of repaired assemblies (carbon-epoxy composites bonded by an epoxy glue) and thickness of the joint. A specific experimental device has been set up to strongly control tests conditions (heat load, boundary conditions) and be able to develop a physically consistent numerical model of the thermal problem. Comparison between measured and simulated surface temperature fields shows very good agreement regarding temporal and spatial evolutions and provides new solutions for the non destructive testing (NDT) of bonded repaired composites. Specially is investigated here the opportunity to incorporate relevant additives with specific infrared signatures into the adhesive to improve thermal contrast between different parts and thus to improve the defects detection.
1. Introduction
Design of modern aircraft is mainly based on the use of large and non dismantle composite structures and the replacement of damaged parts (due to collisions, impacts or maintenance operations...) remains very expensive. A growing interest thus appears for structural bonded repair of composite materials and for their non destructive inspection [1]. Active infrared thermography (IRT) is a non contact technique based on the measurement of thermal surface fields induced by an external thermal sollicitation such as a halogen or flash lamp. The presence of defects can be highlighted from heterogeneities within thermal fields. Studies on active thermography devices are mainly based on a diffuse lightning and do not address the question of boundary conditions problems [2, 3]. These conventional devices are suitable to detect defects presenting a high contrast with their integration environment. However, for the study of bonded repaired composites with very close thermal properties, the detection of the glue joint and its defects remains very difficult.
In order to contribute to the reliability assessment of such a repair technique, we have designed a specific experimental device able to control load and boundary conditions (section 2). From this, it was then possible to develop a physically consistent numerical model of the thermal problem and to identify the thermal load intensity (section 3). The study of repaired assemblies bonded with conventional epoxy adhesive (Section 4) and epoxy adhesive including additives to exacerbate the joint response (section 5)
is finally done through the comparison of experimental and numerical responses. 2. Experimental procedure
In agreement with the industrial context, active infrared thermography is set up with the reflection con-figuration (heat source and infrared camera on the same side). Classical test concon-figurations often lead to a heterogeneous heating of the part surface, create heat sinks at the fixture point and even local cooling on edges due to the contact between the sample and a metallic support. Moreover, numerical models used to simulate these tests are often based on the assumption of a homogeneous heat flow on the entire surface of the part and frequently require corrective factors to corroborate experiments [4–6].
The new bench is designed to better control the thermal stimulation and boundary conditions (Figure 1 a). Indeed, it allows to generate a homogeneous heat flow by the use of a convergent optical lens which transforms the initial divergent light delivered by the halogen lamp (maximum power of 1000 W) into a parallel light beam. Furthermore the sample is pasted on an insulating polymer reticulated foam (Airex R C70) and the assembly is held at the foam bottom (Figure 1 b)). This avoids heat sinks and thermally insulates the back face of the sample. To precisely control the position of the thermal stimulation, each element (lamp, shutter, lens and camera) is placed into a rigid metallic support. Since the thermal camera optical axis should be orthogonal to the sample surface, the sample is tilted relative to the light source (forming an angle of 25◦), which makes the heat impacted area elliptical in shape whose dimensions are fixed by the lens diameter and the inclination angle (namely the minor axis 65 mm and major axis 72 mm long). At last, all samples are painted in mat black to consider the emissivity of carbon (ǫ = 0.98) and the bench is entirely covered with a black sheet to limit most of environment disturbances.
Sample Convergent lens
Thermal camera
Shutter Halogen lamp Black sheet 125 mm 85 mm Sample (mat black) Insulating material Holding points 5 mm
a) Control of the heat flow b) Insulation of the sample back side Figure 1. Specific experimental device
Compared with conventional device, the improvement obtained with this new experimental configuration is presented on the Figure 2 for the same material (Inconel), thermal load (step heat load), equipment (lamp, IR camera) and distances (lamp-sample, sample-camera). Even if the optical system reduces globally the amount of heat flow received by the sample, this new configuration enables a significant improvement in terms of load distribution, providing namely an homogeneous intensity on a delimited elliptical area. An other significant advantage is that such loading configuration and boundary conditions of the thermal problem can be physically taken into account by a numerical model.
3. Identification and verification of the heat flow intensity
In order to identify the thermal load intensity, the Finite Element Model Updating (FEMU) method has been implemented with Abaqus software and based upon the transient thermal response of an Inconel
ΔT (°C) 2.5 0 1.25 ΔT (°C) 0.8 0 0.4
a) Classic IRT device b) Specific test bench
Figure 2. Surface temperature variation on an Inconel plate for a classic IRT device and the specific test bench, after a step heat load of 3 s
alloy plate (thickness of 0.9 mm). To create the numerical model, Inconel material, glue and the insulated foam are considered as isotropic (see Table 1). The ambient temperature is considered as steady and uniform in the whole room and is measured before every test. Radiative and convective phenomena are neglected and the contact between the reference coupon and its support is assumed to be perfect. An homogeneous heat flow is applied on an elliptical area with dimensions given previously and in form of a load step of 10 s (begining at t = 2 s, end at t = 12 s). Global response of the model shows its physical consistency with experimental results and leads to an identified value of ϕid = 500 W m−2.
Same study is next set up for a virgin (not repaired) composite laminate composed of 18 plies of M10 epoxy resin and T300 fibers with [0/90/0]6 stacking sequence (thickness of 4.7 mm). The numerical
modelling for such a case integrates the transversely isotropic behavior of CFRP plies and their specific orientation. Also, simulated response corresponds to the heat load intensity ϕid identified previoulsy on
the Inconel material. If the model is able to capture the global non linear behavior of the composite under these thermal conditions, note that the transverse conductivity λtof composite ply has been calibrated to
match the time evolution of the average thermal variation over the central analysis area (Figure 3). To check the adequation of the model, is shown on Figure 4 the spatial distribution of surface temperature variation ∆T through temperature profiles at different steps (middle and end of heating phase and middle of cooling phase). Since simulations are in good agreement with measurements, this allows to validate the experimental set up and related modelling.
Material Density ρ Thermal Conductivity λ Specific heat Cp (kg m−3) (W m−1K−1) (J kg−1K−1) Inconel 8492m 12m 387m 0◦ply 1550m λa: 3.05 f 883m λt : 0.51c Glue 1172m 0.226m 1317m Airex 80f 0.033f 1130b Epoxy adhesive 1000f 0.12c 1000c
Table 1. Thermal and physical properties of materials (m: measurement, b: bibliography, f: furnisher, c: calibration); thermal properties measured by Hot Disk TPS 2500S; axial (λa) and transverse (λt)
ΔT (°C) 1.3 0 0.75 Y2 X profile Analysis area X1 X2 Y profile ΔT (°C) 1.3 0.75 0 Y1 Y2 Y profile X profile Analysis area X1 X2
a) Experimental and numerical b) Time evolution of the average of ∆T fields at t = 5 s over the analysis area
Figure 3. Surface temperature variation ∆T for a [0/90/0]6composite
a) b)
Figure 4. Surface temperature variation ∆T for a [0/90/0]6composite: temperature profiles along X-axis
(a) and Y-axis (b) at different steps (Y-axis corresponds to 0◦ply direction) 4. Study of composite bonded repair coupons
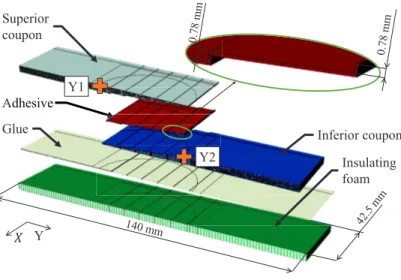
Two coupons of the composite laminate studied previously have been machined by water jet and bonded to form repaired assemblies with a step lap geometry. Precisely, the repaired assembly is composed of five steps with a length of 12 mm and a thickness of 0.78 mm (Figure 5). A structural epoxy adhesive (ST1035) with a thickness of 0.3 mm is used to bond the two elementary parts and polymerized by means of a heating bench. As for the virgin materials, repaired assemblies are painted in mat black and pasted on the reticulated foam. Afterwards, they are thermally solicited under same conditions using the specific experimental device. The studied assembly is placed such that the elliptical heating area covers along Y axis both repaired and virgin parts of the laminate. Regarding the numerical modelling, same approach as for section 3 has been implemented. Given to the complexity of the geometry, a supplementary work was however necessary to ensure a perfect coincidence between the mesh nodes and thus to respect the perfect thermal contact assumption between parts. Note finally that some adhesive film goes up to the surface during the bonding procedure (Figure 5), which was taken into account in the numerical model and allows to calibrate the missing properties of the adhesive film.
Adhesive Inferior coupon Adhesive Glue Insulating foam Y1 Y2 ܺ Y Superior coupon
Figure 5. Constitutive parts of the FE model for the study of repaired assembly (Y-axis corresponds to 0◦ply direction)
Surface temperature variations ∆T for [0/90/0]6 composite repaired assembly are illustrated on Figure
6a and 6b. We observe on the temperature profile along Y-axis that the most important temperature elevation is near point Y2 (at the shallowest step, Figure 6b). This can be explained by the poor thermal effusivity (pλρCp) of the adhesive film (less than those of the composite material) which behaves as a
barrier for the heat load. Indeed, the more the deep of the joint becomes important (that is far from Y2), the more the temperature elevation decreases. For this reason, it is not possible to distinguish clearly on ∆T profiles the specific response of the joint.
In order to improve such interpretation, a data processing called relative temperature is proposed: ∆T2= ∆T (repaired material) − ∆T (virgin material) (1)
where the variations ∆T related to the repaired assembly and to the virgin material are both obtained in the same conditions (load and boundary conditions) and at the same time. Such a post processing allows to avoid edge effects relative to the convergent lens and to highlight the thermal response of the glue joint. The good agreement between experimental and numerical results on ∆T2is illustrated on Figure
6c. With the new experimental procedure (and current light source), it is thus possible to highlight the three shalowest steps, that is to access to the joint standing at a maximum inspection depth of 2.34 mm. Such result is consistent with detection limits generally encountered by IRT for similar properties contrast (using for instance Teflon inserts as artificial defects).
5. Modification of the thermal properties of the glue joint
The final goal associated to the NDT of bonded repair is to detect voids or defects affecting the glue joint. Indeed, small defects induced during the bonding procedure (such as kiss-bonding or disbonding) may be the onset of larger damages for the repaired structure in service, and thus seriously affect its reliability. As shown before, the present experimental procedure based on IRT allows to assess to the joint response through the modification of the relative temperature ∆T2. In case of the existence of local voids inside the
joint or at the interface between the joint and the composite parts, ∆T2would be also affected regarding
the air insulating properties. Accordingly, it seems relevant to modify the thermal properties of the joint to exacerbate the temperature constrast between undamaged and damaged parts of repaired assemblies and thus to better highlight defects.
ΔT (°C) 2.2 0 1.1 Y profile a) b) c)
Figure 6. Surface temperature variation for a [0/90/0]6 composite repaired assembly at t = 12 s : experimental ∆T field (a), experimental and numerical ∆T (b) and ∆2T (c) temperature profiles along
Y-axis. Limits of steps are indicated by green lines (respective depths : 3.9 mm (1), 3.12 mm (2), 2.34 mm (3), 1.56 mm (4), 0.78 mm (5))
In this way, it was proposed to incorporate additives with specific infrared signature inside the epoxy adhesive. The numerical model of the repaired assembly was used to define the more relevant nature (conductive or insulating) and volume ratio of additives. It appears that a conductive joint should reverse the behaviour of the thermal fields acquired by IRT (previously observed in Section 4) and then create a more substantial thermal contrast between joint and defects. In this way, boron nitride with a rate of 16 % in volume (maximum blend rate) was incorporated inside the epoxy adhesive so as to obtain an effective thermal conductivity of the joint of 0.8 W m−1K−1 (measured by Hot Disk), which multiplies by four the initial thermal conductivity of the joint.
Figure 7 presents the first experimental results. We observe a maximum temperature elevation ∆T near the deepest step, equal to the case of bonded repair without additive. The minimum temperature elevation ∆T is located at the shallowest step which confirms the predicted conductive behaviour of the epoxy adhesive with additives. Note also that a local temperature elevation on ∆T field (at the right bottom of the assembly, Figure 7a) can be attributed to the presence of a disbond. The numerical modelling is this time again based on the same assumptions and uses the effective physical and thermal properties of the joint with additives. The model is able to capture the global tendency of the variation of ∆T2(Figure 7c)
and allows to inspect the joint response at a depth of 3.9 mm. These results are thus very encouraging, providing a full confidence with the numerical modelling and allowing to validate the assumptions taken into consideration. ΔT (°C) 2.4 1.8 2.1 Y1 Y2 Y profile a) b) c)
Figure 7. Surface temperature variation for a [0/90/0]6composite repaired assembly with boron nitride
inside the glue joint at t = 12 s : experimental ∆T field (a), experimental and numerical ∆T (b) and ∆2T
5.1. Conclusions
In this work, a new experimental procedure was developed to ensure the non destructive analysis of composite bonded repairs by infrared thermography under controlled conditions. By means of FEMU, it was possible to identify the intensity of a heat load and to calibrate the transverse thermal conductivity of composite ply. Bonded repair assemblies were next studied experimentally and numerically. Numerical predictions have allowed to determine relevant thermal properties of the bonded joint so as to improve the detection of defects. Boron nitride was thus added to the epoxy joint to increase its thermal conductive behavior. First results confirm the relevance of such approach, with a stronger ability to highlight air voids at a significative depth. Further studies need now to be conducted to confirm such tendency, especially by introducing artificial bonding defects.
References
[1] K.B. Katnam, L.F.M. Da Silva, and T.M. Young. Bonded repair of composite aircraft structures: A review of scientific challenges and opportunities. Progress in Aerospace Sciences, 61:26 – 42, 2013. [2] I. Amenabar, A. Mendikute, A. L´opez-Arraiza, M. Lizaranzu, and J. Aurrekoetxea. Comparison and analysis of non-destructive testing techniques suitable for delamination inspection in wind turbine blades. Composites Part B: Engineering, 42(5):1298–1305, 2011.
[3] K.R. Mitchell, A. Poudel, S. Li, T.P. Chu, and D. Mattingly. Nondestructive evaluation of composite repairs. In abstract accepted for Proceedings of ASNT 2013 Fall Conference, Las Vegas, NV, 2013. [4] A. Aktas, M. Gower, R. Shaw, R. Simpson, L. Wright, S. Gnaniah, L. Chapman, and G.
Pilking-ton. Non destructive testing of defects in thick composites by means of pulse and lock in thermog-raphy techniques. In IProceedings of the 20th International Conference on Composite Materials (ICCM20), Copenhaguen, 19-24 July 2015 2015.
[5] M. Krishnapillai, R. Jones, I.H. Marshall, M. Bannisterand, and N. Rajic. Thermography as a tool for damage assessment. Composite Structures, 67(2):149–155, 2005.
[6] R.C. Waugh, J.M. Dulieu-Barton, and S. Quinn. Modelling and evaluation of pulsed and pulse phase thermography through application of composite and metallic case studies. NDT & E International, 66:52–66, 2014.

![Figure 4. Surface temperature variation ∆T for a [0/90/0] 6 composite: temperature profiles along X-axis (a) and Y-axis (b) at different steps (Y-axis corresponds to 0 ◦ ply direction)](https://thumb-eu.123doks.com/thumbv2/123doknet/3103262.88025/5.892.128.760.146.649/temperature-variation-composite-temperature-profiles-different-corresponds-direction.webp)
![Figure 6. Surface temperature variation for a [0/90/0] 6 composite repaired assembly at t = 12 s : experimental ∆T field (a), experimental and numerical ∆T (b) and ∆ 2 T (c) temperature profiles along Y-axis](https://thumb-eu.123doks.com/thumbv2/123doknet/3103262.88025/7.892.150.770.139.323/temperature-variation-composite-repaired-experimental-experimental-numerical-temperature.webp)