OATAO is an open access repository that collects the work of Toulouse
researchers and makes it freely available over the web where possible
Any correspondence concerning this service should be sent
to the repository administrator:
[email protected]
This is an author’s version published in:
http://oatao.univ-toulouse.fr/
2
2111
To cite this version:
Michetti, Jérôme and Basarab, Adrian and Diemer, Franck and Kouamé, Denis Comparison of an adaptive local thresholding method on CBCT and µCT endodontic images. (2018) Physics in Medicine and Biology, 63. 015020. ISSN 0031-9155.
Official URL:
https://doi.org/10.1088/1361-6560/aa90ff
Comparison of an adaptive local thresholding method on CBCT
and
µCT
endodontic images
Jérôme Michetti ,,2, Adrian Basarab1, FranckDiemer3 and Denis Kouame1
1 University ofToulouse, !RIT, CNRS UMR 5505, 118 Route de Narbonne, 31062 Toulouse Cedex 9, France 2 Faculté de Chirurgie Dentaire, Université Paul Sabatier, Toulouse, 31059 Cedex 9, FranceD
3 Clément Ader Institute, Toulouse, France
E-mail: [email protected]
Keywords: cone beam computed tomography, microcomputed tomography, endodontics, segmentation
Abstract
Root canal segmentation on cone beam computed tomography ( CBCT) images is difficult because of the noise level, resolution limitations, beam hardening and dental morphological variations. An image processing framework, based on an adaptive local threshold method, was evaluated on CBCT images acquired on extracted teeth. A comparison with high quality segmented endodontic images on micro computed tomography (µCT) images acquired from the same teeth was carried out using
a dedicated registration process. Each segmented tooth was evaluated according to volume and
root canal sections through the area and the Peret' s diameter. The proposed method is shown to overcome the limitations of CBCT and to provide an automated and adaptive complete endodontic segmentation. Despite a slight underestimation (-4, 08%), the local threshold segmentation method based on edge-detection was shown to be fast and accurate. Strong correlations between CBCT and µCT segmentations were found both for the root canal area and diameter (respectively 0.98 and 0.88). Our findings suggest that combining CBCT imaging with this image processing framework may benefit experimental endodontology, teaching and could represent a first development step towards the clinical use of endodontic CBCT segmentation during pulp cavity treatment.
1. Introduction
Endodontics is the dental specialty concerned with the maintenance of the dental pulp ( formed by nerves, blood vessels and connective tissues) in healthy state and with the treatment of the pulp cavity, i.e. pulp chamber and root canal. A good knowledge of the root canal ana tom y is an indispensable prerequisite for ensuring the success of pulp cavity treatment.According to Peters (2004), three guidelines are important and must be followed during such treatment: identifying and preparing the root main canais using endodontic instruments; establishing and respecting working length; and assessing the initial apical canal diameter to allow an adequate preparation size (Peters 2004). T he reduction of endodontic therapeutic failures, i.e. periapical diseases, and their consequences on health, such as the future of the treated teeth, the prosthetic replacement of the extracted tooth on the jaw or the impact on cardiovascular and diabetic diseases, require new techniques for evaluating the quality of endodontic treatments (Cotti et al201 la, 201 lb,Segura-Egeaetal2012,Astolphi et al 2013, Gomes etal2013).
To date, the gold standard for imaging and investigating the root canal anatomy is a miniaturized form of standard computed tomography called micro computed tomography (µCT). Images acquired with µCT scan ners are characterized by high spatial resolution and excellent contrast allowing the different imaged anatomi cal structures to be distinguished easily. Consequently, a simple thresholding method applied to µCT images is sufficient for automatically detecting the root canal anatomy and providing a precise three-dimensional (3D) visualization of the external and internai tooth morphology (Gao et al 2009). Mainly inspired by the studies on trabecular bone structure, many applications dedicated to qualitative and quantitative analysis of root canais in
vitro exist. For example, the cross-sectional appearance of the root canal, rod-like or more plate-like shaped, can be characterized using the structure model index. Moreover, canais' thickness can be evaluated using existing distance transformation techniques (Peters et al 2001, Paqué et al 2009). Finally, volume and surface computa tion, evaluation of root canal geometry changes after endodontic preparation ( Gao et al 2009), analysis of the 3D
curvature of root canals and distinction between the different components of a root canal filling have also been assessed using µCT (Jung et al 2005, Paqué et al 2005, Lee et al 2006).
However, µCT has several drawbacks that limit its use in the investigation of the whole maxilla-facial struc-tures. First, the limited field of view (FOV) restricts the studies to small samples, i.e. to extracted teeth (e.g. a 1 cm-FOV provides a resolution of 20 µm). Second, µCT is not only time consuming (of the order of a few hours for acquisition and reconstruction of one image of a single tooth), but also uses higher irradiation doses than conventional medical scanners. µCT is thus exclusively dedicated to in vitro endodontic research studies.
Cone beam computed tomography (CBCT) is an interesting alternative to µCT, offering easy-access in den-tal offices and reduced costs and dimensions. CBCT is an extra-oral imaging system dedicated to exploring the whole maxillofacial region or to partially visualize dento-maxillofacial structures. Its FOV varies from 5 cm or less to 15 cm (Scarfe et al 2009). Unlike conventional medical scanners, CBCT has a reduced acquisition time, and uses lower irradiation doses. Moreover, despite its relatively limited FOV, it presents a good spatial resolution in all imaging planes (Winter et al 2005, Nair and Nair 2007, Pauwels et al 2015). Spatial resolution is related to the FOV used and, in general, a smaller scan volume corresponds to a higher spatial resolution of the image (the resolution varies from 0.6 to 0.075 mm) (Nemtoi et al 2013). CBCT devices provide dental surgeons with high-quality 3D maxillofacial diagnostic images. A large variety of dental disciplines exploit the potential of CBCT for diagnosis, decisions on therapy and surgical planning (Cotton et al 2007, Patel and Dawood 2007, Patel et al 2007, Tsurumachi and Honda 2007, Ball et al 2013). However, despite its interesting characteristics, there is currently no application dedicated to endodontics aiming at exploring the root canal system quantitatively, mainly due to its insufficient resolution for the aforementioned application.
The European Commission on Radiation Protection concluded in 2012 (Sedentexct project 2012) that further research to establish the diagnostic accuracy of dental CBCT devices in identifying root canal anatomy is necessary to justify their indication in endodontic treatment. Quantitative analysis of the root canal from CBCT data could indeed offer a deep understanding of the endodontic morphology (number of main canals, localization, length, curvature, thickness and apical diameter) and help to overcome the existing difficulties in root canal treatment.
Automatic segmentation of the endodontic system from CBCT images is the first and most important step towards such a quantitative analysis. The main difficulty in endodontic segmentation is related to the partial volume effect (PVE). In the apical part of the root, the canal appears as a very small structure. The narrowest dimension of the apical canal or minor diameter measures on average between 0.210 to 0.244 mm according to Kuttler (1955). Due to the lower resolution of CBCT, difficulties occur when attempting to clearly identify root canal edges. The consequence of the PVE is that all possible values between pure-dentine and pure-root canal are present within the grey-level histogram.
The aim of this paper is to investigate the ability of an image processing framework to provide reliable root canal measurement tools for endodontics from CBCT images. The proposed framework includes image segmen-tation and automatic apical closure and is validated on a set of anatomical data. In the absence of ground truth, the validation of endodontic segmentations is challenging. Indeed, exact measurements of the internal anatomy of the teeth need their extraction to undertake invasive techniques (Rhodes et al 1999, Michetti et al 2010) or the use of µCT (Liu et al 2010, Maret et al 2010). In our work, we propose using an automatic registration process that allows the segmentation results obtained on CBCT images to be compared to those obtained on the same teeth by µCT. Given the high image quality offered by µCT compared to CBCT, the segmentation results obtained from µCT are assumed to represent the ground-truth. Moreover, alignment between the two modalities allows us to compare the segmented volumes not only in terms of qualitative visual inspection but also in terms of quantita-tive evaluation of the whole root canal using several metrics (Rhodes et al 1999, Maret et al 2010, Michetti et al
2015a). Our aim here is finally to develop a comparison procedure between corresponding endodontic
segmen-tations from CBCT and µCT. Given that µCT is not suitable for in vivo endodontic acquisition because of its limited FOV and high radiation doses, the validation of the image processing framework introduced in this paper was undertaken in vitro on extracted teeth.
We emphasize that in our study µCT was only used as a reference in order to quantitatively and qualitatively appreciate the accuracy of the root canal segmentation on CBCT data. µCT was not used at all to guide the segmentation process on CBCT volumes, or to tune the parameters inherent to the proposed image processing framework.
The remainder of the paper is organized as follows. Section 2 presents the image processing framework that segments the CBCT volumes, registers the root canal anatomy extracted from CBCT and µCT and evaluates the performance of CBCT segmentations. Results on three extracted teeth are provided in section 3 showing the reli-ability of root canal segmentation using CBCT. Finally, discussions and conclusions are drawn in sections 4 and 5.
2. Image processing framework
2.1. Adaptive local threshold method and apical closure
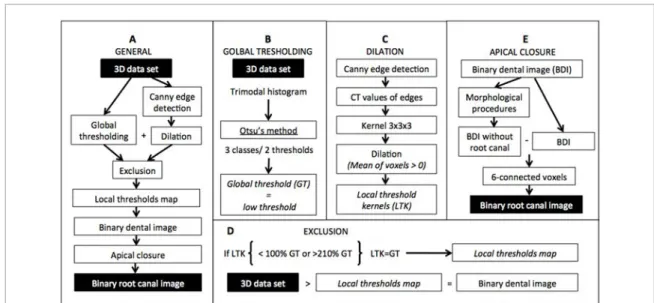
An automated segmentation procedure was carried out on CBCT and µCT data to automatically detect the root canal. Figure 1(a) gives a schematic overview of the image segmentation method applied to CBCT and µCT images, mainly based on the adaptive local threshold method in Chang et al (2013).
Due to the PVE on CBCT images, the data was not filtered to reduce noise. First, a global thresholding using the classical Otsu method (1979) was applied to the 3D data set (see figure 1(b)). The teeth present three ana-tomical structures (enamel, dentine, pulp) with different densities, involving the tri-modal appearance of CBCT and µCT volume histograms. An illustration of a typical histogram within our application is given in figure 2.
The lower threshold among the two optimal thresholds calculated to separate the three classes was defined as the global threshold and used to obtain binary 3D data sets. Figure 3(b) shows an example of Otsu’s method applied to a CBCT lower molar section. Canals in the mesial root were not detected after this global thresholding. To improve global thresholding, local thresholds were defined and were used to replace global thresholding in root canal areas.
Unlike Chang et al (2013), who used Otsu’s method locally in separated kernels to provide local thresholds, we used an edge-detection algorithm as suggested by Waarsing et al (2004). The hysteresis was set to 0.08 and 0.14 for the CBCT data and to 0.5 and 0.6 for the µCT data (see figure 3(c)). The manual choice of the hysteresis parameters was guided by the compromise between (i) over estimating non-anatomical edges and (ii) under estimating the anatomical edges. If this compromise is not respected, resulting effects are missing parts of the root canal or, conversely, overestimation of this anatomy. The above parameters ensured, for all the experiments, the most complete and coherent radicular and root canal edges with a minimum of non-anatomical edges. The binary image obtained was then point-wise multiplied by the 3D data set to provide the initial grayscale intensi-ties at the located edges (see figure 3(d)). This first local threshold map was then divided into separated kernels of size 3 × 3 × 3 voxels. A dilation of the local thresholds was obtained by applying to each kernel’s voxel the mean of the grayscale intensities within the kernel higher than 0. The size of 3 × 3 × 3 voxels was manually chosen to avoid excessive averaging of the local thresholds in CBCT images and to optimise the local thresholding in edge areas. The kernel size was set to the same value for all the experiments undertaken in this study. A schematic rep-resentation of the method used to provide local threshold kernels is presented in the figure 1(c).
The local threshold kernel intensities below 100% or above 210% of the global threshold were excluded from the final map and replaced by the intensity of the global threshold in these regions (see figure 1(d)). A 3D Gauss-ian filter was used to smooth the resulting thresholds and to provide the final map. Figure 3(e) presents the final local thresholds map obtained for the lower molar. The root canal segmentation was carried out by thresholding the initial 3D data set with this adaptive local threshold map. Finally, we obtained a binary image where all voxels assigned to the hard tooth tissues have the value 1 (white) and all the pixels assigned to the foreground and the root canal have the value 0 (black). An example of such a binary image is shown in figure 3(f).
Figure 1. Schematic representation of the adaptive local threshold method. (A) General outline of the entire algorithm. Detailed
flowcharts for the sub processes (B) global thresholding, (C) dilation of the original set of local thresholds, (D) exclusion of local threshold kernels and replacement by the global threshold to compose the local thresholds map and (E) apical closure to extract the root canal anatomy.
At the end of the root, there is an opening or apical foramen where nerve end vessels from bone tissue go inside the root canal volume of the tooth. To extract the root canal volume from the binary-segmented data, an apical closure was needed for extracted teeth (see figure 1(e)). To semi-automatically close this opening, morphological procedures were used to create a binary dental volume without a canal. The pixelwise absolute difference between this volume and the binary-segmented volume of the teeth provided the root canal volume and root boundary outliers, which were caused by the slight modification of the root shape by morphological procedures. To return a 3D binary image containing only the root canal volume, we considered this volume as a six-connected 3D object. By selecting one voxel belonging to the root canal on one slice, we extracted this volume and excluded the artefacts. Comparing this result with the binary dental image (see, e.g. figure 3(f)) easily over passed the distinc-tion between endodontic regions and root boundary artefacts. Caudistinc-tion was taken to avoid the endodontic apical part going missing if the root canal anatomy was segmented in different parts. In this case, several six-connected objects corresponding to the different parts of the root canal were selected and recorded.
2.2. CBCT–µCT registration
Comparing canal root segmentation results obtained from CBCT and µCT required a registration process in order to align the two volumes. Prior to the registration algorithm, a resampling to 75 µm resolution was carried out for the µCT data, initially sampled at 27.25 µm, by standard linear interpolation, to reach the voxel resolution of CBCT. The main advantage of this choice, instead of interpolating the CBCT volumes to µCT resolution, was the reduced computational cost. Before the automatic registration process, manual rotation was performed to reduce the processing time and reduce registration errors.
Figure 2. Histogram of the CBCT lower molar volume. On the left, the plot of the histogram presents three classes corresponding to
the three anatomical structures of the tooth (enamel, dentine and pulp). On the right, we can see a CBCT 2D reconstruction of the coronal part of the lower molar.
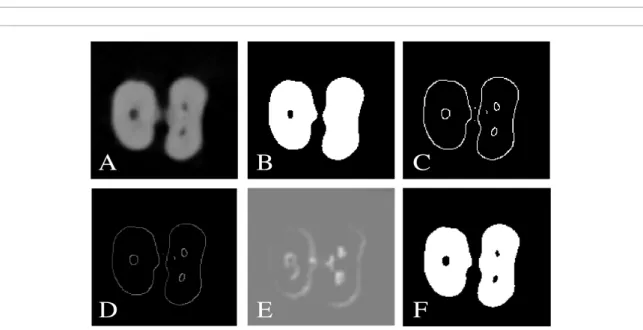
Figure 3. The different steps of the adaptive local threshold method on the radicular part of the CBCT lower molar volume. (A)
Initial grayscale image, (B) global thresholding result, (C) binary image of the edge-detection algorithm result, (D) image of the initial grayscale intensities at the located edges, (E) local thresholds map composed with global threshold and with not excluded local threshold kernels, (F) binary dental image after local thresholding.
The mutual information was used as similarity measurement between the volumes, given its robust-ness to comparing data acquired by the two different sensors used in this application. A standard geometric rigid transform consisting of 3D translations, rotation and scaling factors has been estimated by maximizing the mutual information between the CBCT and the deformed µCT volumes. The estimated geometric trans-formation obtained was then applied to the initial µCT volumes, corresponding to an isotropic voxel size of 27.25 × 27.25 × 27.25 µm3. This procedure avoided as much as possible spatial resolution loss on µCT data
that was supposed to provide ground-truth root canal anatomy. The experiments confirmed that this procedure ensured satisfactory registration results and µCT segmentations were sufficiently accurate to be considered as the reference (the results were validated by the clinicians participating in the study on all the experiments).
For comparison procedures, a resampling to 75 µm in the axial plane was performed on the registered µCT data in order to align the reconstructed slices on those extracted from CBCT volumes. This procedure was adopted to avoid the selection of the closest 27.5 µm µCT slice to the equivalent 75 µm CBCT slice, subject to errors that could influence the comparison results.
3. Materials and results
3.1. Materials
Three different intact freshly extracted teeth (one incisive, one upper molar and one lower molar) with closed apices were selected. These teeth were anonymous donations for research purpose and were extracted for reasons unrelated to the current study.
3.2. Acquisition and reconstruction
The samples were firstly scanned with an in vivo limited CBCT system available in dental offices: CS 8100 3D® (Carestream Health, Trophy, France). Each tooth was placed in the centre of the cone beam. The acquisition settings were set to 80 kilovolts (kV) and 2 milliamps (mA) in order to optimize the visibility of the root canal system. Following a single rotation around the sample (162 s), reconstruction from the 687 projections (of size 617 × 669 pixels) was performed using the software provided by the manufacturer. The reconstructed CBCT volumes had a spatial resolution of 75 µm (isotropic voxel) and a grey value range of 14 bits.
The same samples were then scanned using high-resolution desktop ex vivo microcomputed tomography apparatus: Skyscan 1172® (Bruker, Konitch, Belgium). The acquisition settings were 80 kV and 100 µA and allowed visualisation of the root canal system. Following an acquisition time of 100 min, two connected scans with 387 projections each (of size 668 × 1000 pixels) were reconstructed using NRecon® software (1.6.8.0),
resulting into volumes with a spatial resolution of 27.25 µm (isotropic voxel) through a grey level range of 16 bits.
3.3. Measurements
The accuracy of the root canal measurements with CBCT was evaluated by comparison with the measurements from the µCT data. Given the high-quality µCT images, the root canal anatomy extracted from this modality was considered the ground truth. CBCT and µCT volumes of the root canal segmentations were recorded and visually compared. Two metrics were also used to compare the segmented root canal extracted from CBCT and µCT volumes. For each root, the canal area and the Feret’s diameter were estimated for all the radicular axial reconstructions (see figure 4). The Feret’s diameter defines the longest distance between two parallel straight lines that are tangent to the shape (Michetti et al 2010). The comparison of these estimates was performed using the Pearson correlation analysis (r) and the method of Bland and Altman (1986) through the bias (mean of differences between the two estimated steps) assessing the degree of agreement between the two techniques. 3.4. Root canal segmentation results
Even though the Otsu method classically used in these applications provides fast and straightforward thresholds from the image histogram, global thresholding is not sufficient to ensure an accurate segmentation of the root canal system in CBCT images and fails to correctly detect its complete anatomy. A comparison between the segmentations obtained with a global thresholding and the proposed framework detailed in section 2.1 on CBCT data is shown in figure 5. It allows one to visually appreciate the improvement of 3D segmentation performance when using the adopted image processing framework. This improvement is in agreement with that reported by Burghardt et al (2007). They compared human femoral trabecular parameters from high resolution peripheral quantitative CT (HR-pQCT) with a resolution of 82 µm, with those provided by a µCT at 16 µm. Three different segmentation methods were used on HR-pQCT images. Advanced segmentation techniques like local thresholds seemed to provide equivalent or better accuracy for quantification of trabecular bone microstructure than global threshold segmentation.
In contrast to CBCT, µCT high image quality enables global thresholding to provide very similar results to the proposed adaptive thresholding root canal segmentation. However, adaptive thresholding was used in this
study to extract the root canal from µCT volumes, so the same segmentation method was used for both imaging modalities.
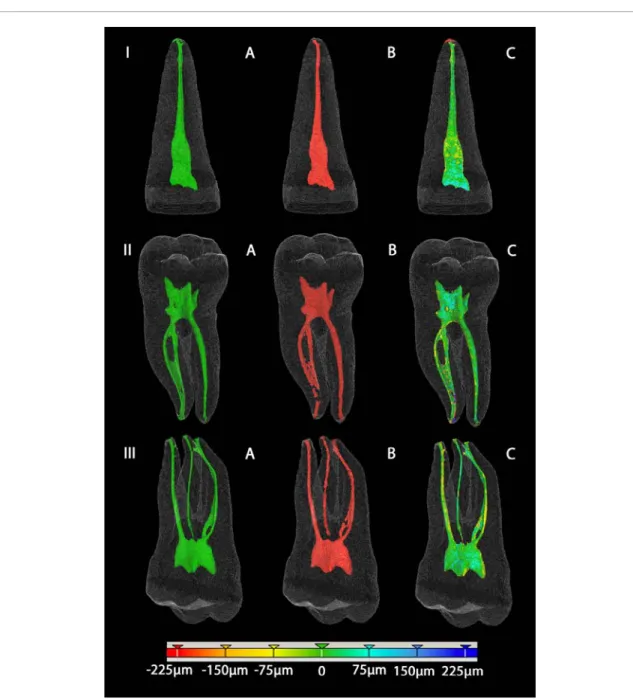
Figure 6 shows, for the three teeth included in this study, the root canal anatomy segmentation results obtained from µCT (first column) and CBCT (second column) data. The third column gives the spatial differ-ences between the two segmentations, colour-coded to indicate the amplitude of the errors, superimposed to the µCT segmentation. One can thus observe that the segmentation and the reconstruction obtained from CBCT data is very close, in terms of error, when compared to the one from µCT, considered as the ground truth in this study.
Figure 4. Schematic representation of a root canal section. Quantitative metrics measured for comparison between CBCT and µCT:
Feret’s diameter (Dmax) and area (A).
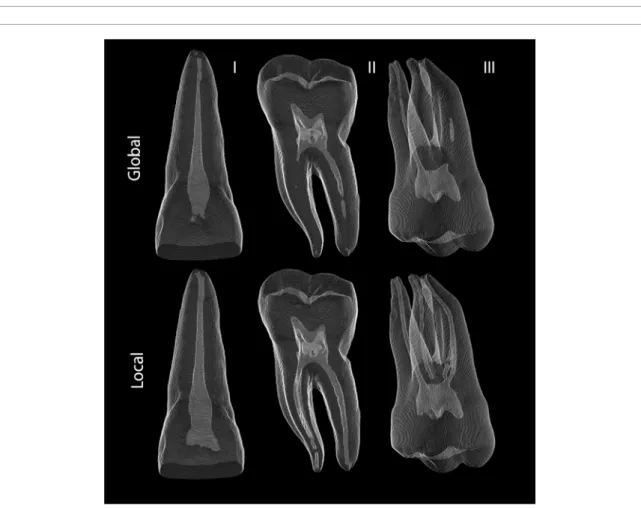
Figure 5. CBCT 3D visualizations of the canal root segmentations on the three considered teeth: incisive (I) on the left, lower molar
(II) in the middle and upper molar (III) on the right, using the global Otsu thresholding method on the top row and proposed local method on the bottom row.
Further volume comparison (see table 1) showed that CBCT segmentations appeared to be slightly smaller than equivalent µCT data: −0.55 mm3 (−4.08%).
853 root canal sections have been compared from the three teeth studied (five roots). To increase the statisti-cal relevance of the data set, we combined the measurements from the three teeth for the root canal area and for the Feret’s diameter. A strong correlation coefficient was found between CBCT and µCT for the area (r = 0.98, p < 0.001) and for the diameter (r = 0.88, p < 0.001). The Pearson correlation coefficient (r) shows the linear relationship between CBCT and µCT. To test the hypothesis of no correlation against the alternative that there is a nonzero correlation, a p-value is associated to each r. A p-value smaller than 0.001 means that the correlation is significantly different from zero.
Figure 6. 3D visualizations of the segmentations with the incisive (I) at the top, the lower molar (II) in the middle and the upper
molar (III) below. A: µCT (red), B: CBCT (green), C: CBCT-µCT distance colour-coded representation on µCT data.
Table 1. Volume comparison between CBCT and µCT.
Teeth CBCT (mm3) µCT (mm3) Difference CBCT-µCT (%)
Incisive 10.82 12.07 −10.36
Upper molar 19.78 19.33 2.33
A high correlation does not necessarily imply that there is a good agreement between the two methods. The degree of agreement between the two modalities is highlighted in table 2, through the mean of differences and the confidence interval (CI). The mean of differences shows whether there is a systematic error between the two modalities. It was found to be −21 501µm2 ± 60 872 (95% CI: −140 810 to 97 808) for the area and −21.88
µm ± 123.48 (95% CI: −264 to 220) for the diameter. These values also indicate an underestimation of the CBCT compared to µCT.
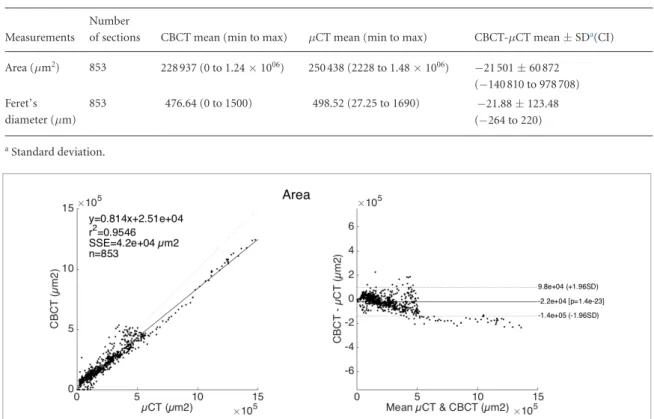
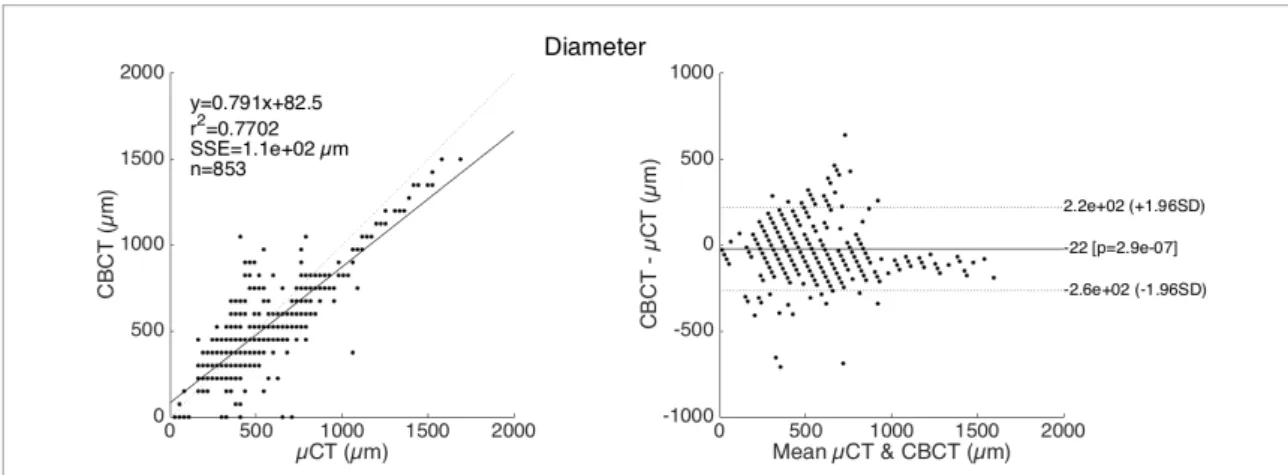
Correlations and Bland–Altman plots of area and Feret’s diameter measurements between CBCT and µCT are presented respectively in figures 7 and 8. The Bland–Altman plot provides a graphical representation of the measurement errors according to the size (area or Feret’s diameter) of the root canal section.
4. Discussion
In our study, the comparison of the root canal segmentation volumes showed a slight underestimation of CBCT data compared to µCT. However, results from 853 sections extracted from the root canals of three teeth showed strong correlations (0.98 for the area and 0.88 for the diameter) between µCT and CBCT. The Bland and Altman analysis performed confirmed equivalent measurements for the diameter (only 38 sections falling outside the limits of agreement). The CI shows that diameter errors between CBCT and µCT did not exceed the equivalent of four CBCT pixels, which is reasonable given that the segmentations were processed with a pixel-wise precision. The area dispersion increases with the section size, leading to an average error of four CBCT pixels. Similarly, both Feret’s diameter and the area presented a slight underestimation for CBCT.
Six roots with different canal morphology extracted from the three teeth were further studied. CBCT seg-mentation errors were higher for root canals shorter than CBCT spatial resolution (canal entry of the disto-buccal root of the upper molar) and for lateral canals and apical delta, which are however not relevant for the endodontic treatment. The thin thickness of the junction on the mesial root of the lower molar was also slightly missegmented without disturbing the segmentation of the root apical part, which is important to determine the initial apical canal diameter.
The comparison procedure developed in this paper allowed the use of µCT as the ground truth to validate CBCT endodontic segmentations. We demonstrated that, used with a dedicated image processing framework, CBCT is a reliable tool to explore in vitro root canal anatomy on extracted teeth. A few minutes are necessary for both acquisition and image processing to provide endodontic segmentation whereas 2–3 h are needed for one µCT volume acquisition.
Table 2. Measurements and differences between CBCT and µCT for the root canal sections.
Measurements
Number
of sections CBCT mean (min to max) µCT mean (min to max) CBCT-µCT mean ± SDa(CI)
Area (µm2) 853 228 937 (0 to 1.24 × 1006) 250 438 (2228 to 1.48 × 1006) −21 501 ± 60 872 (−140 810 to 978 708) Feret’s diameter (µm) 853 476.64 (0 to 1500) 498.52 (27.25 to 1690) −21.88 ± 123.48 (−264 to 220) a Standard deviation.
Figure 7. Scatter plot with regression line of root canal sections area with respect to µCT and CBCT (left). Bland and Altman plot of
area measurements between µCT and CBCT. Positive values indicate smaller area calculated from CBCT compared with µCT data
Nevertheless, the use of µCT on intact freshly extracted teeth limited our study by the absence of surrounding periodontal structures, resulting into a high signal-to-noise ratio, and by the absence of structures placed outside the FOV—potentially a source of artefacts. Equivalent in vivo CBCT images of the teeth used in this study are difficult to obtain. Most of the teeth needing extraction are deteriorated (cavities), with root canal treatment or prosthetics. Intact fully formed teeth have to be extracted for treatment purposes and are often associated with periodontal diseases, resulting in an absence of surrounding tissues around the teeth. Moreover, multi-rooted teeth might need root separation to avoid bone damage during the surgical procedure. Despite the fact that our results may deviate from clinical situations, they still represent a necessary first step, i.e. a comparison procedure showing that, thanks to a dedicated image processing framework, in vitro endodontic segmentations are achiev-able on CBCT volumes. In conclusion, due to its computational effectiveness and fast acquisition, our study dem-onstrates CBCT to be an interesting tool able to replace µCT not only for experimental endodontology but also for teaching tooth morphologies and the different steps of endodontic treatments.
The use of an artificial periodontal phantom around the teeth after µCT acquisition could provide CBCT extracted teeth images similar to in vivo conditions and could be useful for validating imaging processing tech-niques for its clinical purpose (Michetti et al 2015b). Combined with the periodontal phantom, further experi-ments to enhance image quality in in vivo conditions will be investigated in our future works, particularly using super-resolved reconstruction algorithms.
5. Conclusion
In this paper, we demonstrated that the proposed image processing framework, consisting of the combination of an edge-detection based adaptive local threshold with an apical closure, provides a whole and powerful in vitro CBCT endodontic segmentation. Using a dedicated registration process, the comparison with the gold standard µCT shows that this procedure helps to overcome the limitations of CBCT in endodontics. Moreover, the procedure was shown to be reproducible (automated and adaptive according to the type of tooth), accurate and computationally effective (a few minutes for both acquisition and image processing). For a resolution of 75 µm, this image processing technique might allow the use of CBCT on extracted teeth not only for experimental endodontology but also for teaching purposes. Indeed, CBCT devices are more available in dental schools and offices and provide much faster acquisitions than µCT, thus allowing more samples to be studied. Similar to µCT, CBCT combined with the proposed segmentation technique could also serve to evaluate new endodontic instruments and their effects on the root canal anatomy.
The validation of endodontic segmentation techniques for clinical use is very challenging. Further experi-ments are still required. First, the validation procedure in in vivo conditions could require the use of specific phantoms. The enhancement of the image quality is necessary to overpass the reduction of the signal-to-noise ratio due to the presence of surrounding structures around the teeth and the use of a limited FOVs. In conclusion, image processing techniques dedicated to endodontic segmentation have to be tested and improved to robustly work in clinical situations.
References
Astolphi R D, Curbete M M, Colombo N H, Shirakashi D J, Chiba F Y, Prieto A K, Cintra L T, Bomfim S R, Ervolino E and Sumida D H 2013 Periapical lesions decrease insulin signal and cause insulin resistance J. Endod. 39648–52
Figure 8. Scatter plot with the regression line of root canal sections diameter with respect to µCT and CBCT (left). Bland and
Altman plot of Feret’s diameter measurements between µCT and CBCT. Positive values indicate a smaller area calculated from
Ball R I, Barbizam J V and Cohenca N 2013 Intraoperative endodontic applications of cone-beam computed tomography J. Endod.
39548–57
Bland J M and Altman D G 1986 Statistical methods for assessing agreement between two methods of clinical measurements Lancet 1 30710 Burghardt A J, Kazakia G J and Majumdar S 2007 A local adaptive threshold strategy for high resolution peripheral quantitative computed
tomography of trabecular bone Ann. Biomed. Eng. 351678–86
Chang P C, Liang K, Lim J C, Chung M C and Chien L Y 2013 A comparison of the thresholding strategies of micro-CT for periodontal bone loss: a pilot study Dentomaxillofac. Radiol. 4266925194
Cotti E, Dessi C, Piras A and Mercuro G 2011a Can a chronic dental infection be considered a cause of cardiovascular disease? A review of the literature Int. J. Cardiol. 1484–10
Cotti E, Dessi C, Piras A, Flore G, Deidda M, Madeddu C, Zedda A, Longu G and Mercuro G 2011b Association of endodontic infection with detection of an initial lesion to the cardiovascular system J. Endod. 371624–9
Cotton T, Geisler T, Holden D and Schwartz S 2007 Endodontic applications of cone beam volumetric tomography J. Endod. 331121–32
Gao Y, Peters O A, Wu H and Zhou X 2009 An application framework of three-dimensional reconstruction and measurement for endodontic research J. Endod. 35269–74
Gomes M S, Blattner T C, Sant’Ana Filho M, Grecca F S, Hugo F N, Fouad A F and Reynolds M A 2013 Can apical periodontitis modify
systemic levels of inflammatory markers? A systematic review and meta-analysis J. Endod. 391205–17
Jung M, Lomel D and Klimek J 2005 The imaging of root canal obturation using micro-CT Int. Endod. J. 38617–26
Kuttler Y 1955 Microscopic investigation of root apexes J. Indiana Dent. Assoc. 89 20–8
Lee J K, Ha B H, Choi J H, Heo S M and Perinpanayagam H 2006 Quantitative three-dimensional analysis of root canal curvature in
maxillary first molars using micro-computed tomography J. Endod. 32941–5
Liu Y, Olszewski R, Alexandroni E S, Enciso R, Xu T and Mah J K 2010 The validity of in vivo tooth volume determinations from cone-beam
computed tomography Angle Orthod. 80160–6
Maret D, Molinier F, Braga J, Peters O A, Telmon N, Treil J, Inglèse J M, Cossié A, Kahn J L and Sixou M 2010 Accuracy of 3D reconstructions
based on cone beam computed tomography J. Dent. Res. 891465–9
Michetti J, Basarab A, Tran M, Diemer F and Kouame D 2015b Cone-beam computed tomography contrast validation of an artificial
periodontal phantom for use in endodontics Conf. Proc. IEEE Engineering in Medicine and Biology Society pp 7905–8
Michetti J, Georgelin-Gurgel M, Mallet J P, Diemer F and Boulanouar K 2015a Influence of CBCT parameters on the output of an automatic
edge-detection-based endodontic segmentation Dentomaxillofac. Radiol. 4420140413
Michetti J, Maret D, Mallet J P and Diemer F 2010 Validation of cone-beam computed tomography as a tool to explore root canal anatomy
J. Endod. 361187–90
Nair M K and Nair U P 2007 Digital and advanced imaging in endodontics: a review J. Endod. 331–6
Nemtoi A, Czink C, Haba D and Gahleitner A 2013 Cone beam CT: a current overview of devices Dentomaxillofac. Radiol. 4220120443
Otsu N 1979 A threshold selection method from gray-level histograms IEEE Trans. Syst. Man Cybern. SMC-962–6
Paqué F, Barbakow F and Peters O A 2005 Root canal preparation with Endo-Eze AET: changes in root canal shape assessed by
micro-computed tomography Int. Endod. J. 38456–64
Paqué F, Ganahl D and Peters O A 2009 Effects of root canal preparation on apical geometry assessed by micro-computed tomography
J. Endod. 351056–9
Patel S and Dawood A 2007 The use of cone beam computed tomography in the management of external cervical resorption lesions Int.
Endod. J. 40730–7
Patel S, Dawood A, Pitt Ford T and Whaites E 2007 The potential applications of cone beam computed tomography in the management of endodontic problems Int. Endod. J. 40813–30
Pauwels R, Araki K, Siewerdsen J H and Thongvigitmanee S S 2015 Technical aspects of dental CBCT: state of the art Dentomaxillofac.
Radiol. 4420140224
Peters O A 2004 Current challenges and concepts in the préparation of root canal systems: a review J. Endod. 30559–67
Peters O A, Laib A, Göhring T N and Barbakow F 2001 Changes in root canal geometry after preparation assessed by high-resolution
computed tomography J. Endod. 271–6
Rhodes J S, Pitt Ford T R, Lynch J A, Liepins P J and Curtis R V 1999 Micro-computed tomography: a new tool for experimental endodontology Int. Endod. J. 32165–70
Scarfe W C, Levin M D, Gane D and Farman A G 2009 Use of cone beam computed tomography in endodontics Int. J. Dent. 2009634567
Sedentexct Project 2012 Cone Beam CT for Dental and Maxillofacial Radiology—Evidence Based Guidelines (Radiation Protection Series) (Brussels: European Commission)
Segura-Egea J J, Castellanos-Cosano L, Machuca G, López J, Martín-González J, Velasco-Ortega E, Sánchez-Domínguez B and López-Frías F J 2012 Diabetes mellitus, periapical inflammation and endodontic treatment outcome Med. Oral Patol. Oral Cir. Bucal
17e356–61
Tsurumachi T and Honda K 2007 A new cone beam computerized tomography system for use in endodontic surgery Int. Endod. J.
40224–32
Waarsing J H, Day J S and Weinans H 2004 An improved segmentation method for in vivo microCT imaging J. Bone Miner. Res. 191640–50
Winter A A, Pollack A S, Frommer H H and Koenig L 2005 Cone beam volumetric tomography versus medical CT scanners New York State