Expert suggestion for conference program committees
13
0
0
Texte intégral
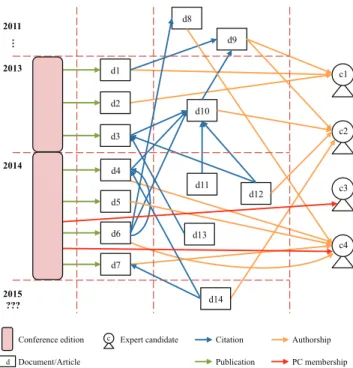
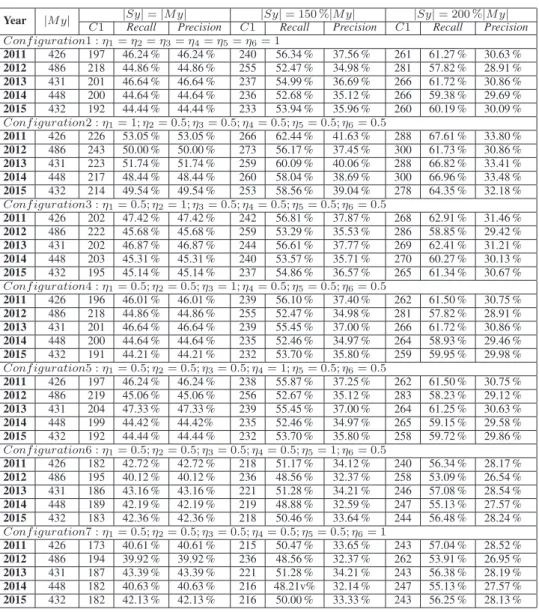
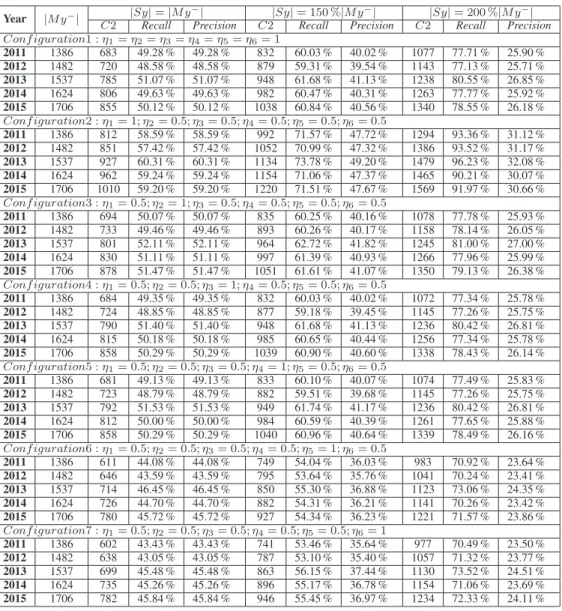
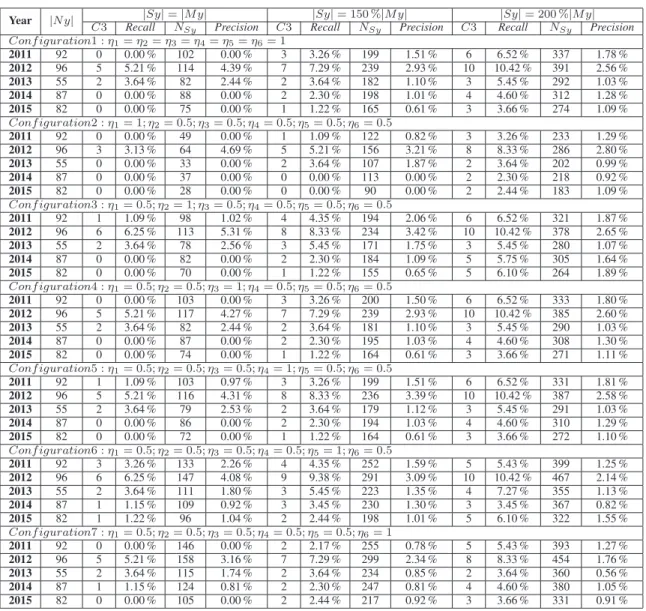
Figure

+4
Documents relatifs