Open Archive TOULOUSE Archive Ouverte (OATAO)
OATAO is an open access repository that collects the work of Toulouse researchers and
makes it freely available over the web where possible.
This is an author-deposited version published in :
http://oatao.univ-toulouse.fr/
Eprints ID : 15548
To link to this article : DOI : 10.1016/j.seppur.2015.10.005
URL :
http://dx.doi.org/10.1016/j.seppur.2015.10.005
To cite this version : Ragueh, Deka Moussa and Meireles, Martine and
Cabane, Bernard and Gummel, Jérémie Filtration of precipitated silica
aggregates: Length scales, percolation threshold and yielding
behaviour. (2015) Separation and Purification Technology, vol. 156 (n°
1). pp. 2-11. ISSN 1383-5866
Any correspondance concerning this service should be sent to the repository
administrator:
[email protected]
Filtration of precipitated silica aggregates: Length scales, percolation
threshold and yielding behaviour
Deka Moussa Ragueh
a,d, Martine Meireles
a,d,⇑, Bernard Cabane
b, Jérémie Gummel
caUniversité de Toulouse, UPS, LGC, 118 route de Narbonne, F-31062 Toulouse, France b
Laboratoire PMMH, ESPCI, 10 rue Vauquelin, F 75231 Paris Cedex 05, France
c
European Synchrotron Research Facility, F38043 Grenoble cedex 9, France
d
CNRS, LGC, F-31062 Toulouse Cedex, France
Keywords: Precipitated silica Filtration Multiscale structure Yielding Specific resistance
a b s t r a c t
Reinforcing precipitated silica systems have a complex hierarchical structure consisting of a branched network made of connected clusters composed of small silica beads welded together into larger dense aggregates. Here, we study the evolution of such structural features during a filtration process. The typical behaviour is that the cakes formed at constant pressure do not reorganize at local scale during a filtration experiment. Accordingly, the creep resistance of a precipitated silica network is high. Overall, there is a percolation threshold, which appears when the branches are pushed into each other. Once this percolation path is reached, the cake withstands compression over more than a decade of applied pressure. Beyond, it seemed useful to make predictions of the filtration properties knowing the typical length scales – small silica beads, dense aggregates, and consolidation behaviour of the cake. A simple approach introducing the concept of an effective medium approximation into Darcy’s law was tested. This approach treats the network as a pseudo-continuum of porous medium built at two main length scales: the size of dense aggregates and a length scale representing the typical distance between the aggregates. The quality of the fit of experimental filtration rates by this simple model indicates that a description based on a continuous network made of two material phases is accurate.
1. Introduction
Highly dispersible silicas are extensively used today in many branches of modern industry including applications in the food industry, and in pharmaceutical and cosmetic products, where they are used as densifying agents or abrasiveness improving agents [20,22]. They are also largely used as fillers to enhance the mechanical properties of polymers in general and elastomers in particular. In tyre applications, for example, the reinforcing effect of fillers includes an increase in tensile strength and wear resistance. Whether or not the desired properties are achieved lar-gely depends on the structure of the solid particles. Decades of studies have concluded that a complex structure, consisting of pri-mary nanoparticles embedded in dense sub micrometre aggregates, is very effective for reinforcement applications
[32,25,26,15,2]. Today, highly dispersible silicas are routinely produced on an industrial scale through a two-step acidification
of sodium silicate solutions. Variations of temperature, acid con-centration, pH and hydrodynamic parameters trigger the desired structured silicas. Schaefer et al. [25] proposed a schematic representation of the structure of dispersible silica based on the mechanisms formulated for sol–gel processes [14,7]. In the first acidification step, primary particles nucleate and grow according to hydrolysis, condensation and interactions controlled by ionic strength and pH, up to the formation of a network. Although quite empirical, the second acidification step has the reputation of being an important consolidation step where deposition of silicate is favoured at the necks between particles and some recombination between small and large particles can contribute to spatial varia-tions of density[13]. It results in a dually structured material made of dense, unbreakable aggregates further clustered into less robust; loose agglomerates that can be disrupted by shear. After the pre-cipitation process, a filtration step is carried out, first to increase the solid silica content and then to wash remaining by-products, mainly salts, out of the filtration cake. At the end, silica cakes are dried and shaped to obtain the final powder. Generally, post synthesis processes, such as filtration and washing steps, remain a major limitation of productivity and, for some products, even
http://dx.doi.org/10.1016/j.seppur.2015.10.005
⇑ Corresponding author at: Université Paul Sabatier, LGC, F-31062 Toulouse,
France.
the bottleneck of the process. Indeed, there is lack of rational design tools that would link the material properties and length scales (specific surface area, size, morphology) to process parameters such as specific filtration rate or final silica content in the cake. One reason is that the mechanisms by which such dually structured materials may consolidate or yield inside a filter cake are elusive at best[31,28].
Here we would like to study how a highly dispersible silica structure consolidates during a filtration process and we intend to address the following questions: What are the structure and the length scales in the cakes? Is there any threshold for consolida-tion? Can we propose a link between material properties and transport properties of filtration cakes based on analytical standard filtration models?
The consolidation of aggregated systems has been largely con-sidered in the framework of solid-liquid separations, which include filtration, mechanical compression, and drying or centrifugation. As discussed by several groups, the efficiency of such solid-liquid processes depends on the way the cake built up or, to put it differ-ently, how the network of aggregates responds to applied stress
[1,16,9,21]. Some cakes are not easily compressible: this is the case when strong bonds connect particles within the wet cake. At low to moderate applied pressures, the organization of the cakes changes very little, although they can still be compressed to relatively high densities at very high pressures. Other cakes are highly compress-ible: this is the case when weak bonds connect the particles. These cakes have a weak mechanical resistance and yield even at low applied pressures. The relation between the mechanical resistance of wet cakes and the nature of the bonds connecting the particles has been well established. Colic et al.[10]showed that dispersions flocculated by the addition of large counterions such as Cs+ had a weak mechanical resistance compared with counterions having a small bare diameter such as Li+ or Na+. The mechanical resistance was even higher when the dispersions were flocculated at their isoelectric point, when the surfaces lost their counterions. Parneix et al.[23]measured the osmotic stress resistance for silica aggre-gates where bonds were adjusted from weak to strong by varying the pH of the dispersions. Experimental laws obtained are in very good agreement with the numerical simulation by Botet et al.[5]
showing that cakes evolve through a similar process but with dif-ferent thresholds corresponding to the strength of their interparti-cle bonds. A different question was addressed by Madeline et al.
[18,19]. They looked into the nature of the restructuring process at a local scale. In this work, model silica particles were used to cre-ate aggregcre-ates which were further packed into cakes by filtration. Macroscopic filtration experiments as well as local investigations of structures by Small Angle Neutron Scattering (SANS) were car-ried out. By comparing the spectra of dispersions and cakes, it was clearly established that there was a pressure threshold, below which the structures were only slightly affected in a self-similar mode and, above which the structures were clearly reorganized. It was also concluded that a redistribution of the mass occurred at large length scale from the compression of voids between aggre-gates and ultimately the formation of lumps. The reason for this non-affine deformation may be that some regions are stiffer than others. Qualitatively, it is easy to imagine that the largest voids within the cake will collapse, making the cake denser. Meanwhile, the cores of the aggregates pushed into less dense ones accumulate more particles and turn into stiffer 3D lumps. Some quantitative models of such compression processes have been further developed by Seto et al.[29].
Although the work is challenging, the structures of highly dispersible silicas have been studied comprehensively and extensively by transmission electron microscopy, small angle X ray scattering (SAXS) and ultra-small angle X ray scattering[27,2].
Using small angle X-ray scattering (SAXS), small angle neutron scattering (SANS), X-ray diffraction and light scattering, Schaefer et al.[25]studied the hierarchical structure of precipitated silicas on length scales varying from 4 Å to 100
l
m. By examining the scattering profile over many decades, they could determine (i) the morphology of smooth surfaced spherical particles, (ii) a power-law profile characteristic of fractal clustering of primary particles and (iii) a broad feature attributed to the so-called agglomerate structure.In order to better quantify the organization of the so-called agglomerates, the multi-scale structure of precipitated silica was further studied by Baeza et al.[2]by transmission electron micro-scopy (TEM) and ultra-small angle X ray scattering (USAXS). They produced a complete quantitative model extending from primary particles having radii of the order of 10 nm to a micron sized fractal network of branches formed from connected aggregates. Capturing the void volume between the branches through TEM image analy-sis showed that the data were compatible with a large-scale net-work having an average fractal dimension of about 2.4. The complete quantitative description also gave an indication of the aggregate polydispersity.
Suryawanshi et al.[30]and Schafer et al.[27]used light scatter-ing and small angle X-ray scatterscatter-ing to examine the structure of three different silica sources before and after sonication and before and after a drying protocol. They showed that, with the exception of the large-scale fractal network, which was highly sensitive to drying or sonication conditions, all the other structural levels were robust. They reported that sonication broke down weaker bonds, leaving smaller sized networks as expected in a fragmentation mechanism, while drying played a critical role in hardening bonds (dried silicas were less redispersible) because it implied a yielding mechanism by which a mass distribution occurred. This effect is compatible with the observation reported by Schaefer[11] show-ing how shearshow-ing affects the large scale features while smaller, stronger features survive.
These findings raise a number of interesting questions concern-ing the structural processes by which highly dispersible precipi-tated silica can yield in filtration. In dispersions of highly dispersible silica, as described above, different length scales and organization, and probably different natures of bonds between par-ticles, coexist. So there are two main problems to be addressed if some answers are to be provided to the previous questions. One is: can we quantify the different length scales and identify whether they evolve through some structural process during filtration? Then, a related question concerns the effect of initial structures: do dispersions with different initial structures end up with differ-ent structures after filtration and do they evolve through the same pathway?
The next problem deals with the strength of bonds in the net-work and how they may determine the structural pathway for the yielding process. Once more, we have to consider that the reor-ganization pathway can occur at some scales but not at others and that reorganization may propagate through the network.
To provide some answers to these questions, we studied three industrial silica dispersions that differed in the way the precipita-tion steps were conducted during their synthesis. We examined the multi-level structural organization of the silicas on length scales varying from 1 nm to 500
l
m through small angle X-ray scattering (SAXS) and USAXS. We filtered these dispersions at increasing applied pressures and examined the SAXS scattering profile in the cakes. We also measured the filtration rate and silica content in cakes and deduced the permeability. Resistance of the bonds was appreciated for three silica dispersions through osmotic stress experiments. Finally we evaluated a simple model quantitatively introducing the concept of an effective mediumapproximation to link the material properties and the transport properties of filtration cakes.
2. Materials and methods
2.1. Silica systems
Aqueous, highly dispersible silica particles were used as starting materials. These dispersions were directly sampled from a precip-itation reactor and supplied by Solvay Rhodia (Rhodia Opérations, France). The silica particles, labelled S1, S2, and S3 in this work, tar-get different application properties; hence they have different specific surfaces. The choice of these silicas was important for one reason: they are produced through different synthesis path-ways and thus ought to have different multi-scale organization. Specific surfaces were determined by nitrogen physisorption. The silica particles were diluted with deionized water and centrifuged (1000g, 40 min) in order to purify the sample of residual sodium and sulphate ions. The operation was repeated three times before the silica dispersion was dried overnight at 100 "C. The samples were out-gassed at 160 "C before N2 physisorption analysis (Micromeritics ASAP 2020). Specific surface areas were determined using the Brunauer–Emmet–Teller (BET) method. Silica volume fractions were measured by thermogravimetric analysis (HR73, Mettler Toledo, Viroflay, France) using a ramp at 30 "C/min from 25 to 105 "C under air. The silica volume fractions could be estimated within an uncertainty of 5%. For each sample, the salt content was estimated from the conductivity of a dry pellet redispersed in Milli-Q water.Table 1shows typical values of initial volume fraction for the three industrial dispersions.
2.2. Filtration experiments
For the filtration experiments, we used a laboratory filtration cell of 102 cm3 (Choquenet, France) and filter cloths from Sefar
Fyltis (France) corresponding to a surface area of 51 cm2. The order
of magnitude of the hydraulic resistance of filter cloths was a hun-dred times less than the hydraulic resistance of the cakes formed during the filtration experiments, so the resistance of the medium was neglected. The cell was fed with silica dispersion circulating from a guard reservoir maintained at a constant pressure by a reg-ulated air supply. During the filtration, silica particles accumreg-ulated on the filter to form a cake. The experiment was terminated when the cake filled the entire space of the cell and fluid permeation out of the cell was no longer observed. Filtration experiments were conducted at a constant operating fluid pressure in the range 400–600 kPa and at a temperature of 25 "C. At the completion of the filtration, the wet cake was recovered and cut into different pieces. Some pieces were kept in closed boxes and used later for SAXS experiments. Some were used to determine the silica mass. The solid mass of wet cake was measured by thermogravimetric analysis (Mettler Toledo, Viroflay, France). This solid mass included the contribution of both silica and salts. The mass of salts was determined by measuring the conductivity of a dry pellet redis-persed in Milli-Q water. The silica mass in the wet cake was there-fore estimated from the difference between solid mass and salt
mass. Finally, the measured weights of wet cake and silica were used to calculate the volume fraction of the silica in the cake using the known densities of 2.02 g/cm3for the silica and 1 g/cm3 for
water.
Because we were interested in the permeability of the filtration cakes, we gravimetrically determined the flow rate during a filtra-tion experiment by recording the mass of fluid permeating out of the cell on an electronic balance at regular time intervals. Filtration experiments were repeated five times to check the reproducibility of the filtration data. The specific resistance
a
was directly determined from the variation of the permeating volume V with filtration time t. Assuming a negligible hydraulic resistance of the filter cloth, the filtration data can be expressed in a way that deter-mines the average specific resistancea
according Darcy’s law:dt ¼ ð
la
W=A2D
PÞVðtÞdV ð1Þwhere
l
is the viscosity of the fluid phase, W is the mass of depos-ited silica, A is the filter cloth area andDP the applied pressure.Assuming the specific resistance
a
remains constant during the cake growth, Eq.(1)can be integrated to give Eq.(2):t=VðtÞ ¼ ð
la
W=2A2D
PÞVðtÞ ð2ÞThus, if the specific resistance of the cake remains constant over the filtration, then the ratio t/V(t) must be a linear function of V(t). This linear behaviour predicted by Eq.(2)was verified for the complete set of filtration experiments reported in this study.
The mass of deposited silica, W, used in Eqs.(1) and (2), is cal-culated from the silica mass fraction of the dispersion, s (kg/kg) and the ratio of the wet cake to silica mass fraction in the cake, m (kg/ kg) by:
W ¼
q
l$ s1 % ms ð3Þ
2.3. Osmotic stress experiments
Unlike the pressure filtration described in the previous section, compression by osmotic stress is a slow, isotropic process. Origi-nally used in biology, osmotic stress was introduced a few decades ago to concentrate colloidal particle dispersions [24]. Bonnet-Gonnet et al. [4], first used it to concentrate latex dispersions. Briefly, the osmotic stress technique is based on a water exchange between the sample placed in a dialysis bag and a reservoir of known osmotic pressure. Using this process, it is expected that the suspension in the dialysis bag will be concentrated until an osmotic equilibrium is reached between the two sides of the dial-ysis membrane. When silica dispersions are dewatered by the application of osmotic pressure, the silica structures come into contact, connect and form a continuous network. Whether the extraction of water continues depends on the resistance of the net-work to the osmotic pressure applied. If the osmotic stress applied to the network is below its resistance, then the volume occupied by the network remains constant. Above a threshold value, parts of the network start to yield and the volume of the network is reduced due to local reorganization.
For osmotic stress experiments, a volume of silica dispersion (20 ml) was introduced into a dialysis bag (Spectra Por Biotech membranes MWCO 12 000, Spectrum Laboratories, Rancho Dom-inguez CA). Dispersions were then dialysed against solutions of polyethylene glycol of 35 000 g/mol molar mass (Fluka, Buchs, Switzerland) prepared in Milli-Q water at concentrations varying from 0.0001 g/g to 0.27 g/g. Dialysis was performed at room tem-perature (20 "C). After two weeks, the concentrated samples were collected from the dialysis bag and their silica solid content was measured using a thermogravimetric balance as described earlier (Mettler Toledo, Viroflay, France). Some parts of the concentrated
Table 1
Three industrial slurries labelled S1, S2 and S3 were investigated. This table presents the silica dry weight content and volume fraction measured by thermogravimetric analysis.
Silica dry mass g/g of solution Silica volume fraction
S1 0.053 0.020
S3 0.053 0.018
samples were also kept in closed boxes and used later for SAXS experiments.
The osmotic pressure,P, of PEG 35 000 solutions can be repre-sented by a polynomial function of the PEG concentration[6]. The osmotic pressure range corresponding to solutions containing 0.0001 g/g to 0.27 g/g of PEG lies between 100 Pa and 700 KPa according to
Logð
P
osmÞ ¼ a þ b $ ðCPEGÞd ð4Þwith a = 0.49, b = 2.5 and d = 0.24
The final osmotic pressure was calculated using Eq.(4)where the final PEG concentration CPEGwas determined from total carbon content (TOC Shimadzu 5050A, Shimadzu). For some experiments, Na2SO4 salt (Sigma Aldrich, France) solutions was added to PEG
solutions in order to match the ionic concentration of the silica sample placed in the dialysis bag (0.3 mol/l). It is known that the osmotic pressure of PEG solutions can be affected by the presence of an electrolyte altering the interaction between polymer and solvent molecules. According to[24], however, the effect of an electrolyte solution on the PEG osmotic pressure is limited. The strongest effect was reported for NaClO4 1 M solutions, which
interacted with PEG 2000 polymer and reduced the osmotic pres-sure by a factor of 20%. For osmotic stress experiments conducted in 0.3 M Na2SO4PEG solutions, we calculated the final osmotic
pressures considering a 20% reduction from the theoretical value given by Eq.(4).
2.4. Structural analysis
The silica microstructure in the dispersions was investigated by transmission electron microscopy. TEM images were obtained with samples prepared by ultracryomicrotomy at %80"C. Electron microscope observations in transmission were obtained with a Jeol 2100 LaB6 (200 keV).
The silica microstructure in the dispersions and in the concen-trated systems (filtration cakes, contents of dialysis bags) were studied by small angle X-ray scattering (SAXS). Scattering methods use interference experiments to measure distance correlations (relative positions of particles) within the sample.
SAXS experiments (beamline ID2, ESRF, Grenoble) were per-formed at a wavelength of 0.103 nm (12.46 keV) and two sample-to-detector distances (1 and 10 m) which covered a range of scattering vectors (q-range) from 8.7 $ 10%3nm%1 to 1 nm%1,
(correlation distances of the order of 10 nm to 1000 nm). Lower values of scattering vectors (q-range) were measured on the Bonse–Hart set-up on ID2. The smaller q-range value of this set up corresponds to a scattering vector q = 10%3nm%1(distance of
the order of 6000 nm). For concentrated systems (cakes and dialy-sis bag contents), samples were cut into pieces and inserted into thin mica cells. The sample thickness was varied from 0.5 to 2 mm depending on the solid concentration of the samples corre-sponding to sample volumes from 0.05 cm3to 0.2 cm3. Care was
taken to avoid evaporation of water during the transfer. The mica cells were placed in the beam of the instrument and the intensities were collected on the detector. If the sample is isotropic as a whole, then the scattered intensity I depends only on the magnitude of the scattering vector, which is inversely proportional to the incident wavelength and the half scattering angle:
q ¼4
p
sin hk ð5Þ
The scattering cross section per unit sample volume (nm%1), –
also termed scattered intensity, I – was obtained using a standard procedure including radial averaging, background subtraction and calibration. SAXS was considered an ideal method to probe the
structure of the filtration cakes since it allowed the cake to be left undisturbed between the filtration experiment and the structural analysis. With primary particles in the nanometre range and aggregates in the range of a hundred nanometres, it was also considered as the least elusive method to quantify the relative positions of particles and aggregates in the network and track their displacement through reorganization processes.
3. Results
In this section, we first present the TEM images of silica disper-sions, followed by a quantitative determination through scattered X-ray intensity profiles of the multilevel structure as they are in the original dispersions and then how they appear in the cakes and dialysis bags after some dewatering. For each type of silica, we compare the structure obtained in the cakes and in the dialysis bags to the initial structure. In this way, we characterize the resis-tance of the network to compression and the possible reorganiza-tion pathways. We then quantify the specific resistance of filtrareorganiza-tion cakes and also the compression behaviour through osmotic exper-iments to assess transport properties and material properties.
3.1. Structure analysis of silica dispersions
TEM was used to obtain images from the large-scale structure of the silica dispersions. Fig. 1 shows a micrograph taken from S1 samples. A clear multi-level structural feature can be seen that can be summarized as follows: a branched structure made of con-nected clusters of small silica beads welded together into larger dense areas.
The scattering patterns of highly dispersible silica obtained from SAXS and USAXS experiments show a complex structure as reflected by the different scaling regimes inFig. 2for the three sil-ica systems.
The high q part of the scattering curves corresponds to interfer-ence between pairs of scattering centres that are quite close to each other, i.e. a regime that reveals the signature of primary par-ticles. For S1 and S2 slurries and for scattering vector ranges of [0.25–0.35 nm%1], a double logarithmic plot of the scattered
intensity revealed a power law with an exponent value of %4.0 consistent with smooth-surfaced primary particles. In a reasonable approach, primary particles can be represented as spheres with a rough surface represented by the so-called surface fractal ds[3],
Fig. 1. Typical TEM micrograph of S1 dispersion reveals a branched structure made of connected clusters composed of small silica beads welded together into larger dense areas.
with ds = 2.0 for a smooth surface and ds = 3.0 for an infinitely rough surface. The scattering of a fractal surface being simply I = q-(6-ds),
the exponent of the power law in the high q range provides simple access to the surface roughness. For S3 slurry, such a power law pro-file with an exponent value of %4.0 is seen in a much higher range of
q values, indicating that primary particles are smaller.
The high q-range of the scattering curve is an asymptotic case, characterized by a limit at large scattering vector (called the Porod limit). Representing scattered intensities as Porod plots – I(q) q4
plotted versus q – provides information about the specific surface developed in the samples as described by the Porod law. The plateau that appears for each silica dispersion inFig. 3allows the specific surface SSAXS(m2/g)[17]to be calculated according to:
SSAXS¼ lim q!1IðqÞ $ q 4 2
pq
m$D
q
2 ð6Þwhere
q
mis the silica density (kg/m3) and the scattering contrast
between the silica particles and water.
The values of the specific surface calculated from the Porod pla-teau using Eq.(6)are reported inTable 2for S1, S2, and S3 silica dispersions. These values are in very good agreement with data
obtained from nitrogen adsorption on dried powder for S1 and S2 dispersions, although for S3 silica the specific surface obtained from the Porod plateau is 10% higher than the specific surface measured by nitrogen adsorption. This difference can be attributed to the underestimation by the latter method of pores or interstices smaller than 2 nm, the density of nitrogen being different in nanopores. The diameter of primary particles was determined from the values of specific surface, using Eq. (7) for monodisperse spherical particles:
dp ¼ 6
1000 $
q
silica$ SSAXS ð7ÞThe values of the primary particle radii for silicas S1, S2 and S3 are reported inTable 2
The intermediate part of the scattering curves is controlled by interference between neighbouring primary particles clustered in larger units. On approaching intermediate q, a first break in slope may be observed. Its position is related to the typical interparticle distance between primary particles dinter– for crowded primary particles in contact it is located close to 2
p
dinter. If neighbouring primary particles form dense, clustered structures, another break in slope at a lower q value may be found, located at the inverse of the typical size of aggregates. It is possible to better visualize this break in slope by counterbalancing the power law decrease as in the Kratky plots – I(q) q2plotted versus log q – presented in Fig. 4. The break in slope then appears as an easily recognizable maximum or the change from a slope to a plateau. The maxima were calculated by a mathematical routine based on local maxima0 1 10 100 1000 10000 0.0 0.1 1.0 I(q) [nm-1] q [nm-1] S1 S2 S3
q
-4q
-2.4Fig. 2. Scattering curves of silica dispersions. Horizontal scale: scattering vector q,
in nm%1and logarithmic representation. Vertical scale: Scattered intensity in nm%1
and logarithmic representation. Symbols as follows S1 (diamonds), S2 (squares), S3 (triangles). 0.E+00 1.E-08 2.E-08 3.E-08 4.E-08 5.E-08 6.E-08 0.00 0.25 0.50 0.75 1.00 I(q).q4 [nm -5] q [nm-1] S1 S2 S3
Fig. 3. Scattering curves of silica dispersions represented as Porod plots. Horizontal
scale: scattering vector q, in nm%1. Vertical scale: the product of the scattered
intensity by the fourth power of scattering vector I$q4. Symbols as follows S1
(diamonds), S2 (squares), S3 (triangles). The plateau provides information about the specific surfaces developed in the samples.
Table 2
Specific surface areas were deduced from nitrogen physisorption (SBET) and from the
value of the scattering intensity corresponding to a plateau in a Porod representation
– Iq4versus q – for high q range values (S
SAXS). Typical primary particle diameter dp
was calculated from SSAXSusing Eq.(7). The fitting error is about 0.1 nm and the
values are well reproducible.
SSAXS(m2/g) SBET(m2/g) dp(nm) S1 161 169 17 S3 110 114 25 S3 280 232 10 0.E+00 1.E-06 2.E-06 0.0 0.1 1.0 I(q).q2 [nm-3] q [nm-1] S1 S2 S3 fractal arrangement of
size of aggregates ( from q at the maximum)
aggregates (power law)
Fig. 4. Scattering curves of silica dispersions represented as Kratky plots on SAXS
q-range. Horizontal scale: scattering vector q, in nm%1. Vertical scale: the product of
the scattered intensity by the second power of the scattering vector I$q2 in
logarithmic representation. Symbols as follows S1 (diamonds), S2 (squares), S3 (triangles). The peak provides information about the size of dense aggregates and
the fit with a power law I(q) = q%dffor data at q smaller than q peak provides
detection (Matlab, The Mathworks Inc.). The locations of these maxima were used to calculate the size of the aggregates according to:
rKratky¼
p
qpeak
ð8Þ
The values of the typical size of aggregates are reported inTable 3
for S1, S2 and S3 silica dispersions.
On approaching q-values smaller than the maxima, the power law regime originates from aggregate-aggregate correlations within the network. Typical values for mass fractal dimensions of 1.8, 2.2 and 2.2 can be found for S1, S2 and S3 respectively. These values of mass fractal can be related to diffusion limited or reaction controlled aggregation mechanisms occurring during the synthesis path. At that stage, the scattered intensities reveal signatures in accordance with the features that can be seen on TEM images but SAXS results show that it is possible to analyse the complex multi-structure in a quantitative manner.
Finally, on the low q part of the scattering curves (USAXS q range), there is a strong low-q upturn at q values around 10%3nm%1as shown onFig. 5. This cannot be described by a simple
function but it can be roughly represented by a power law in q%4.
This power law is a characteristic of scattering by a two-phase material containing regions of high scattering density separated by regions of lower scattering density. In general, this means lumps dispersed in a homogeneous matrix. We can conclude that the clusters seem to be further orgainzed in some fractal fashion.
More detailed modelling of the multilevel structured silica is beyond the scope of this paper. Here, we discuss only the general features of the SAXS scattering curves and report on the quantifica-tion of two important length scales: the primary particle and aggregate scales. Of course, the relations between crossovers of the scaling laws and typical sizes of the microstructure are clarified here on the basis of general scattering for spherical, symmetrical, monodisperse particles and aggregates. A generalization to include polydispersity can be developed as detailed in Baeza et al.[2]but, again, this is beyond the scope of this paper.
3.2. Filtration cakes
3.2.1. Volume fraction and specific resistances of filtration cakes
In this section, we present the overall characteristics of cakes formed in the filtration cell at different pressures. The silica volume fractionU of cakes formed at a constant pressure in the range
400 kPa to 600 kPa is reported inTable 4for S1, S2 and S3 silica dis-persions. The data show little dependence on applied pressure, suggesting that the filtration does not promote substantial collapse of the multilevel structure. For instance, for the S1 system, at the lowest pressure (400 kPa), the silica volume fraction is around 0.082 (that means that the void volume fraction is 0.918) and, at
the highest pressure (600 kPa), it is 0.096 (the void volume fraction is then 0.904), much lower than for an ordered packing of spheres. These values can be compared to the silica volume fraction of the initial dispersions, which is of the order of 0.05. The values of the specific resistance,
a
, measured in the same range of pressures are also reported inTable 4for the three silica dispersions. The data reveal that the specific resistance varies by about 40% to 60% depending on the applied pressure while it varies by 200% or, respectively, 300% when S3 is compared to S2 or S1 silica disper-sion at a given pressure.3.2.2. Local analysis by SAXS
For the different silica dispersions, below a pressure threshold, no differences between the intensity of X-rays scattered by the cakes and the intensity of those scattered by the dispersion could be evidenced in the full q-range. The same power laws, cross-over and maximum values as those reported inTable 2were iden-tified on the scattering regimes. Above some pressure threshold, the scattered measurements reveal that the intensity is unchanged at short and intermediate distances but increases at very large dis-tances. This is evidence onFig. 6with the scattered data obtained for S1 cake at 600 KPa: a strong U-turn is observed in the cakes at
q < 0.015 nm%1.
These observations suggest that the morphology of primary particles and dense aggregates is completely retained in the cake structures whatever the pressure, whereas the large scale morphology appears to be more fragile. It is obvious that any mechanical force such as applied in the present work is unable
Table 3
Typical size of the aggregates and fractal dimension of the branched network were
quantified from the scattering spectra using a Kratky representation – Iq2versus q.
Typical size of dense aggregates (nm)
RKratky
Branch organization (fractal
dimension)
S1 82 1.8
S2 125 2.2
S3 175 1.8
The typical sizes of dense aggregates was calculated from the q scattering vector corresponding to the maximum or crossover between a power law and a plateau. The branch organization was determined by fitting a power law for q-range smaller than the maximum/crossover. The fitting error was quite small: about 0.02 for the fractal dimension and about 0.2 nm for the size. The intervals chosen for fitting the fractal power law were a compromise between the largest possible range and the
perturbations to the influence of crossovers. Values are well reproducible. 1.E-07
1.E-06 1.E-05 0.00 0.01 0.10 1.00
Iq²[nm-3]
q [nm-1]
S1 S2 S3Fig. 5. Scattering curves of silica dispersions represented as Kratky plots on SAXS– USAXS q-range. Horizontal scale: scattering vector q in logarithmic representation. Vertical scale: the product of the scattered intensity by the second power of the
scattering vector I$q2 in logarithmic representation. Symbols as follows S1
(diamonds), S2 (squares), S3 (triangles). The strong U turn in the very low q-range is the signature of the bushy structure of the silica networks.
Table 4
The specific resistance of cakes formed at 400 kPa, 500 kPa and 600 kPa for S1, S2 and S3 silica dispersions are reported with the volume fraction of the cake recovered at the end of the filtration. The specific resistance is expressed as a function of a reference value R (m/kg) which cannot be disclosed.
S1 S2 S3 Specific resistance (m kg%1) @400kPa 2.5 R ± 4.7% 1.5 R ± 6.8% 0.77 R ± 6.8% @500kPa 2.82 R ± 4.8% 1.74 R ± 6.8% 1.1 R ± 6.2% @600kPa 3.63 ± 4.5% 2.4 R ± 6.2% 1.2 R ± 6.3% Volume fraction @400kPa 0.082 ± 0.2% 0.084 ± 0.2% 0.070 ± 0.2% @500kPa 0.088 ± 0.2% 0.086 ± 0.2% 0.074 ± 0.2% @600kPa 0.096 ± 0.2% 0.108 ± 0.2% 0.078 ± 0.2%
to crack either the fractal surface or the primary particle or the bonded aggregates. In contrast, changes in the slope at low q-limit are reported in the literature after a drying process or ultrasound redispersion. They are associated with the clustering of the agglomerates.
3.3. Osmotic stress experiments 3.3.1. Compression curves
Figs. 7 and 8show a double logarithmic representation of the silica volume fraction in the dialysis bags at equilibrium when osmotic pressure increases. For the data presented inFigs. 7 and 9, the polymer was dissolved in Milli-Q water. Under this condi-tion, Na+and SO
4
2%were transferred out of the sample into the
dial-ysis reservoir during the compression experiment. For this set of data, the ionic strength decreased over the course of the compression to reach a value of 0.03 mol/l at equilibrium. For the data presented inFig. 8, [Na2SO4] was added to the polymer
solu-tion at a concentrasolu-tion of 0.3 mol/l. Under this condisolu-tion, the ionic strength of the sample was kept constant during the compression experiment.
At this stage it was already obvious that the compression curve was made up of very distinct regimes:
– A ‘‘dilute” regime in which the silica volume fraction at equi-librium was almost proportional to the osmotic pressure. In this regime the dispersions were liquids.
– A ‘‘percolation threshold” at which the volume fraction remained almost constant when the osmotic pressure was raised by more than a factor of 10. In this regime, the disper-sions were like gels or soft solids. It is clear that, in this
0 1 2 3 4 5 0.01 0.1 1 I( q ). q ² ( n m -3) q [nm-1]
S1 silica dispersion S1 cake@400 kPa S1 cake@600 kPa
Fig. 6. Scattering curves of cakes formed at 400 kPa and 600 kPa for S1 silica
dispersion. Horizontal scale: scattering vector q, in nm%1. Vertical scale: the product
of the reduced scattered intensity by the second power of scattering vector. Symbols as follows S1 silica dispersion (triangles), S1 cake@400kPa (circles), S1
cake@600kPa (diamonds). The increase of I(q)$q2at very low q (q < 0.015 nm%1)
reflects the growth of dense lumps in the cake formed for a pressure of 600 kPa. Large scales and intermediate scales are comparable for cakes formed at 400 kPa and 600 kPa. In this figure, the scattered intensity is rescaled to compare the structure within samples at different silica concentrations.
10 100 1000 10000 100000 1000000 0.01 0.10 1.00 OsmoJc pressure Π (P a ) Volume fracJon (-) φthreshold φmax~36% Π ∼ φ3
Fig. 7. Osmotic compression curves of silica dispersions with no adjustment of
Na2SO4concentration in the dialysis bag (equilibrated ionic strength 0.03 mol/l).
Horizontal scale: silica volume fraction at equilibrium (logarithmic scale). Vertical scale: osmotic pressure at equilibrium (logarithmic scale) (Pa). Symbols as follows S1 (diamonds), S2 (squares), S3 (triangles) There are clearly three distinct regimes: a dilute regime, a percolation threshold, and a yielding regime.
10 100 1000 10000 100000 1000000 0.01 0.10 1.00 OsmoJc pressure Π ( P a ) Volume FracJon (-) φmax~0.12 φthreshold
~
Π ~Φ8Fig. 8. Osmotic compression curves of silica dispersions. Concentration of Na2SO4
in the dialysis bag was adjusted to Na2SO4concentration of the dilute slurries (ionic
strength 0.3 mol/l). Horizontal scale: silica volume fraction at equilibrium (loga-rithmic scale). Vertical scale: osmotic pressure at equilibrium (loga(loga-rithmic scale) (Pa). Symbols as follows S1 (diamonds), S2 (squares), S3 (triangles) There are clearly three distinct regimes: a dilute regime, a percolation threshold, and a yielding regime. In the last regime, the rise of osmotic pressure with the volume fraction is stiffer: the systems are less likely to yield.
2 3 4 5 6 7 8 9 0.01 0.10 1.00
I(
q
).
q
²
(
n
m
3)
q [nm-1]
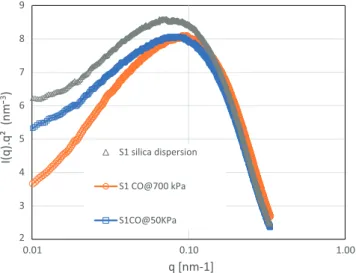
S1 silica dispersion S1CO@50KPa S1 CO@700 kPaFig. 9. Scattering curves of samples collected in dialysis bags at low ionic strength (ionic strength 0.03 mol/l) for S1 silica dispersion. Horizontal scale: scattering
vector q, in nm%1. Vertical scale: the product of the reduced scattered intensity by
the second power of the scattering vector. Symbols as follows S1 silica dispersion (triangles), S1 CO@50kPa (squares), S1 CO@700kPa (circles).
regime, a network resists osmotic stress. Note also that the volume fraction values corresponding to the percolation threshold were well within the range of the volume fractions measured in the filtration cakes.
– A yielding regime, in which the silica volume fraction increased with the osmotic pressure. The pressure rose approximately as the 3rd power of the volume fraction for the data reported inFig. 7and to the eighth power of the vol-ume fraction for the data reported inFig. 8. In this regime, the samples behaved as solids. Some parts of the network started to yield.
– Remarkably, varying ionic strength only impacted the ‘‘yield-ing regime”. The reduction of Na2SO4concentrations made it
easier to concentrate the dispersions. In this regime the dis-persions with higher ionic strength had a compression resis-tance nearly three times as high as that of dispersions with reduced ionic strength.
Differences between the three silicas were as follows: percolation threshold was 0.06 for S3 silica, 0.08 for S1 silica and 0.09 for S2 silica; no significant differences were found in the ‘‘diliute” regime.
3.3.2. Local analysis by SAXS
The scattering measurements from samples collected in dialysis bags compressed at a constant ionic strength showed that the multi-scale structure of dispersion and compressed samples were identical in the full q-range whatever the osmotic stress (or pres-sure). As previously mentioned, it was expected that the network resistance to osmotic compression would be high and that no reor-ganization would be observed in the SAXS q-range.
The scattered intensities from samples collected in dialysis bags compressed at low ionic strength are compared to the scattered intensity of the dispersion inFig. 9. As previously, scattered inten-sity is rescaled by R1
0 ImðqÞ $ q2dq (also called invariant) to compare the structure within samples at different silica concentrations. A change in the low q-range scattering regime and position of the crossover is found. The crossover still exists but the maximum cor-responds to a smaller typical size of the aggregates. Changes in the power law decay for q-values smaller than the maximum, corre-sponding to aggregate-aggregate correlations within the network are obvious.
At this stage, we conclude that the three regimes identified on the compression curve are accompanied by a structural pathway.
In the dilute regime, the structure becomes more homogeneous
through compression, with large voids being compressed more than smaller ones.
At the percolation threshold, the volume fraction remains at a
constant value (around 6–10% depending on the system). The aggregates have formed a rigid skeleton that resists further com-pression. In the yielding regime, the volume fraction rises to 30%. Accordingly, large dense regions (lumps) can been formed. These lumps are generated by the interpenetration of rigid clusters under compression. In the latter regime, if salts remaining in the disper-sions from the synthesis are transferred out of the sample, it appears that the network becomes more fragile and that the corre-lations between aggregates are modified in the network. A plausi-ble explanation is that silicate deposited at the necks between particles during the synthesis solubilizes when the dispersion is maintained at low ionic strength for several weeks.
3.4. Summary of results
These results can be considered according to the questions raised in the introduction: What are the structures and thus the
length scales in the cakes. ? Is there any threshold for consolida-tion? To examine these questions, we compared cakes made from different types of silica (with different initial structures and different initial bonds) and found typical behaviour with very few variations around this behaviour.
The typical behaviour is that the structure of precipitated silica quantified by the SAXS experiments is mainly maintained in the cakes, so they do not reorganize at local scale during a filtration experiment. Accordingly, the resistance of the network is high. A variation is observed for S3 silica at the highest operating pressure: there is a strong low-q U-turn indicating that some dense parts of the network are pushed into less dense ones, thus accumulating more particles and turning into denser lumps.
The osmotic compression results provide an answer to the second question concerning consolidation. Overall it appears that, for all the systems, once the network is formed, it withstands compression over more than a decade. It would be tempting to determine a pressure threshold, above which cake would undergo compression in filtration, from the numbers in the osmotic pressure scale. However, the two dewatering processes are not comparable as, in one case, the process is slow and isotropic (osmotic pressure) whereas, in the other case, the effective pres-sure applied to the network varies with cake height. It is most interesting to compare the numbers in terms of volume fraction measured at the end of the filtration and compression processes. The values of the volume fraction in the cakes measured are of the same order as those obtained in the compression experiments. The reason for this consistency may be that the network formed when silica structures come into contact are quite similar for both processes – provided that neither the filtration pressure nor their resistance of each silica to compression is too high. Qualitatively, we can now consider that, when multilevel structured silica systems accumulate into a filtration cake, they keep their specific organization in the range of parameters investigated. This qualita-tive interpretation could be assessed by some quantitaqualita-tive approach based on the modelling of transport properties of cakes.
3.5. Modelling
Beyond the assessment of the typical behaviour of these systems, it would be useful to make predictions of their transport properties, knowing their typical length scales and their consolida-tion behaviour. For this purpose, we choose a model of the network that does not explicitly take the details of complex structure into account but still captures a relevant characteristic. We are dealing with a pseudo-homogeneous network, in the sense that it is spa-tially non-uniform in terms of length scales. This problem is similar to that of modelling the drag on a large self-similar aggregate or the diffusion of a flexible macromolecule. A very simple approach for this type of problem has been proposed by Brinkman[8]and Debye[12], by introducing the concept of an effective medium approximation for an aggregate made of spherical particles. This concept requires the aggregate to contain enough particles to form a valid statistical ensemble and the length scale over which the velocity gradient (drag or permeation) occurs to be large with respect to the particles. Their approach treats the network as a por-ous pseudo-continuum built from two main parameters, the size of the spherical beads and a length scale representing the typical dis-tance between the beads. Introducing this effective medium con-cept into Darcy’s law leads to an analytical expression of the network permeability K (m2): K d2beads ¼ 1 /beads þ34 ffiffiffiffiffiffiffiffiffiffiffiffiffiffiffiffiffiffiffiffiffiffiffiffiffiffiffi 8 /beads % 3 # $ s " #, 18 ð9Þ
where dbeadsis the size of the beads and is the volume fraction of the beads in the network, an inverse function of the correlation distance between the beads.
To compare the predictions of such a model with filtration data, we used the experimental specific resistance, silica density and bead volume fraction in order to calculate the permeability of the different cakes produced from different systems in the range of pressure investigated according to:
Kexp¼ 1
2200/beads
a
ð10Þ
The bead volume fraction in the cakes was determined from the integral of I(q). q2over the complete q range. At high q values, the
integral of the intensity scattered in all directions of reciprocal space tends to a limit (Q), which depends only on the average fluc-tuation of the density of scattering length in the volume that is irradiated by the beam. For materials that have only 2 levels of density of scattering length, this average fluctuation is expressed simply as a function of the difference in scattering density between particles and solvent, ð
q
silica%q
waterÞ and the volume fraction of these two phases[17]:Z 1
0
ImðqÞ $ q2dq ¼ 2
p
2u
beadsð1 %u
beadsÞðq
m%q
sÞ2
ð11Þ
The SAXS q range does not reach infinite q values; therefore, we measured the values of q at a finite q max of 0.3 nm%1. The volume
fraction obtained from the scattered intensity is compared with the volume fraction / obtained from thermogravimetric analyses in
Table 5. Values of the volume fraction obtained from the two meth-ods are in good agreement, with the advantage for the value obtained from the scattered intensity of not being biased by the approximations implied by the thermogravimetric method.Fig. 10
presents the fit of Kexp/d2beads experimental values (symbols) by
K/d2beadscalculated values (line) from Eqs.(9) and (10). In this set
of data, the values of the size of the aggregates determined from the location of the maxima in the Kratky plots is used as dbead.
For S3 silica some discrepancy can be observed for filtration data corresponding to the highest filtration pressure. This probably originates from the reorganization occurring in these conditions giving rise to denser lumps. For that case, a better fit could be obtained by taking a variation of the distance between the beads with the pressure applied to the network into account. Neverthe-less, the quality of the fit indicates that the description of filtration based on a simple model of a continuous network made of two material phases is accurate.
4. Concluding remarks
Reinforcing precipitated silica systems have a complex hierar-chical structure consisting of a branched network made of con-nected clusters composed of small silica beads welded together into larger dense aggregates. Here we study the evolution of these structural features during a filtration process. The length scales were first quantified for three different industrial silica systems and the way the length scales are retained in the filtration cakes was investigated. The typical behaviour is that the structure of precipitated silica quantified by small angle X-ray scattering experiments is mainly kept in the cakes, which do not reorganize at local scale during a filtration experiment. Accordingly, the creep resistance of the precipitated silica branched network is high. This creep resistance was assessed through osmotic compression experiments. Overall it appears that, for all the systems, there is a percolation threshold that appears when the branches are pushed into each other. Once this percolation is reached, the continuous network withstands compression for applied pressure varying over more than a decade. Another important result is the similarity in the range of volume fraction in the cakes formed during compression experiments and in the filtration cakes. The reason for this consistency may be that the networks formed when silica structures come into contact, and thus their resistance to compression, are quite similar for both processes.
Beyond the assessment of the typical behaviour of precipitated silica in filtration, it seemed useful to make predictions concerning the cake properties, knowing structural features such as typical length scales and consolidation behaviour. For this purpose, we chose a model of the network that did not explicitly consider the details of complex structure but still captured relevant characteris-tics. A very simple approach introducing the concept of an effective medium approximation into Darcy’s law was tested. This approach treats the network as a pseudo-continuum of porous medium built at two main length scales: the size of dense aggregates and a length representing the typical distance between the aggregates.
The filtration data are well reproduced by the model using the size of the aggregates determined from the location of the maxima in the SAXS – Kratky plots. The quality of the fit indicates that the description of filtration based on a simple model of a continuous network made of two material phases is accurate.
Acknowledgements
The authors acknowledge support from Rhodia Operations, CNRS (Centre National de la Recherche Scientifique) and ANRT (Association Nationale de la Recherche Scientifique).
Table 5
Using scattering data obtained for the cakes formed at different pressures and for different silica dispersions, the bead volume fractions in the cakes were calculated
from the integral of I(q). q2in the q range at finite q max of 0.3 nm%1. They are
compared here with the volume fraction obtained by the thermogravimetric method. Values are in good accordance.
S1 S2 S3
Volume fraction (from gravimetric analysis)
@400kPa 0.082 ± 0.2% 0.084 ± 0.2% 0.070 ± 0.2%
@500kPa 0.088 ± 0.2% 0.086 ± 0.2% 0.074 ± 0.2%
@600kPa 0.096 ± 0.2% 0.108 ± 0.2% 0.078 ± 0.2%
Bead volume fraction (from SAXS analysis)
@400kPa 0.092 0.125 0.071 @500kPa 0.108 0.128 0.076 @600kPa 0.112 0.15 0.077 0.00 0.20 0.40 0.60 0.07 0.08 0.09 0.1 K /d b e a d s ² (-) Volume fracon φ (-) Brinkman model S1 S2 S3
Fig. 10. Symbols represent the variations of the ratio of the experimental
permeability Kexpto dbeads obtained from the location of maxima in the SAXS
Kratky plots as a function of volume fraction / estimated from average fluctuations Eq.(10). Line is from calculated values of the ratio of K to dbeadsusing Eq.(9)– Brinkman model – as a function of volume fraction /.
They thank S. Neveu and M. Clouin (Solvay Rhodia) for intensive discussions and Stéphanie Balor (FRBT IBCG-TRI) for cryoTEM micrographs.
References
[1]D. Antelmi, B. Cabane, M. Meireles, P. Aimar, Cake collapse in frontal filtration, Langmuir 17 (2001) 7137–7144.
[2]G.P. Baeza, A.C. Genix, C. Degrancourt, J. Gummel, M. Couty, J. Oberdisse, Multiscale filler structure in simplified industrial nanocomposite silica/SBR systems studied by SAXS and TEM, Macromolecules 2013 (46) (2013) 317– 329.
[3]G. Beaucage, Approximations leading to a unified exponential/power-law approach to small-angle scattering, J. Appl. Crystallogr. 28 (1995) 717–728. [4]C. Bonnet-Gonnet, L. Belloni, B. Cabane, Osmotic pressure of latex dispersion,
Langmuir 10 (1994) 4012–4021.
[5]R. Botet, B. Cabane, Scaling behaviors of colloidal aggregates under uniform pressure, Phys. Rev. E 70 (031403) (2004) 1–11.
[6]A. Bouchoux, P.E. Cayemitte, J. Jardin, Gesan-Guiziou, B. Vabane, C. Gonnet, Casein micelle dispersion under osmotic stress, Biophys. J. 96 (6) (2009) 2547. [7]C.J. Brinker, G.W. Scherer, Sol–Gel Science: The Physics and Chemistry of Sol–
Gel Processes, Academic Press, 1990.
[8]H.C. Brinkman, Problems of fluid flow through swarms of particles and macromolecules in solutions, Appl. Sci. Res. 2 (1949) 140–144.
[9]R. Buscall, L.R. White, The consolidation of concentrated suspensions – theory of sedimentation, J. Chem. Soc. Faraday Trans. 83 (1987) 873–891.
[10]M. Colic, G.V. Franks, M.L. Fisher, F.F. Lange, Effect on counterion size on short range repulsive forces at high ionic strengths, Langmuir 13 (1997) 3129–3135. [11]M. Dale, Schaefer, Multilevel structure of reinforcing silica and carbon, J. Appl.
Cryst. 33 (1997) 587. 587-531.
[12]P. Debye, The relation between intrinsic viscosity and molecular weight in polymer solutions, Phys. Rev. 71 (1947) 486.
[13]M. Dubois, B. Cabane, Light scattering study of the sol–gel transition in silicon tetraethoxide, Macromolecules 5 (22) (1989) 2526–2533.
[14]R.K. Iler, The Chemistry of Silica, Wiley, 1979.
[15]D.J. Kohls, G. Beaucage, Rational design of reinforced rubber, Curr. Opin. Solid State Mater. Sci. 6 (3) (2002) 183–194.
[16]J. Li, B. Cabane, M. Sztucki, et al., Drying dip-coated colloidal films, Langmuir 1 (28) (2012) 200–208.
[17] P. Lindner, Neutrons, X-rays and light: scattering methods applied to soft condensed matter, chapter 2, in: P. Lindner, T. Zemb (Eds.), North Holland, 2002.
[18]J.B. Madeline, M. Meireles, J. Persello, R. Botet, R. Schweins, B. Cabane, From colloidal dispersions to colloidal pastes through solid/liquid separation processes, Pure Appl. Chem. 8 (77) (2005) 1369–1394.
[19]J.B. Madeline, M. Meireles, C.J. Bourgerette, R. Botet, R. Schweins, B. Cabane, Restructuring of colloidal cakes during dewatering, Langmuir 23 (4) (2007) 1645–1658.
[20]J.E. Mark, B. Erman, F.R. Eirich, Science and Technology of Rubber, Academic Press, San Diego, CA, 1994.
[21]K.T. Miller, R. Melant, C.F. Zukoski, Comparison of the compressive yield response of aggregated suspensions: pressure filtration, centrifugation and osmotic consolidation, J. Am. Ceram. Soc. 79 (1996) 2545–2556.
[22]K. Nusser, S. Neueder, G.J. Schneider, M. Meyer, W. Pyckhout-Hintzen, L. Willner, A. Radulescu, D. Richter, Conformations of silica–poly(ethylene-propylene) nanocomposites, Macromolecules 43 (23) (2010) 9837–9984. [23]C. Parneix, J. Persello, B. Cabane, How do colloidal aggregates yield to
compressive stress?, Langmuir 25 (2009) 4692–4707
[24]V.A. Parsegian, R.P. Rand, N.L. Fuller, D.C. Rau, Osmotic stress for the direct measurement of intermolecular forces, Meth. Enzymol. 127 (1986) 400–416. [25]D.W. Schaefer, T. Rieker, M. Agamalian, J.S. Lin, D. Fischer, S. Sukumaran, C.Y. Chen, G. Beaucage, C. Herd, J. Ivie, Multilevel structure of reinforcing silica and carbon, J. Appl. Crystallogr. 33 (1) (2000) 587–591.
[26]D.W. Schaefer, C. Suryawanshi, P. Pakdel, J. Ilavsky, P.R. Jemian, Challenges and opportunities in complex materials: silica-reinforced elastomers, Physica A 314 (1-4) (2002) 686–695.
[27]D.W. Schaefer, D. Kohls, H. Feinblum, Morphology of highly dispersing precipitated silica: impact of drying and sonication, J. Inorgan. Organ. Polym. Mater. 3 (22) (2012) 617–623.
[28]G.J. Schneider, D. Goeritz, Structural changes in precipitated silica induced by external forces, J. Chem. Phys. 15 (132) (2010) 154903.
[29]R. Seto, R. Botet, M. Meireles, et al., Compressive consolidation of strongly aggregated particle gels, J. Rheol. 5 (57) (2013) 1347–1366.
[30]C.N. Suryawanshi, P. Pakdel, D.W. Schaefer, Effect of drying on the structure and dispersion of precipitated silica, J. Appl. Crystallogr. 36 (3) (2003) 573– 577.
[31]R. Wakeman, The influence of particle properties on filtration, Sep. Purif. Technol. 58 (2007) 873–891.
[32]T.A. Witten, M. Rubinstein, R.H. Colby, Reinforcement of rubber by fractal aggregates, J. Phys. II 3 (3) (1993) 367–383.