OATAO is an open access repository that collects the work of Toulouse
researchers and makes it freely available over the web where possible
Any correspondence concerning this service should be sent
to the repository administrator:
[email protected]
This is an author’s version published in: http://oatao.univ-toulouse.fr/24238
To cite this version:
Villarreal Soto, Silvia Alejandra
and Beaufort, Sandra
and Bouajila,
Jalloul
and Souchard, Jean-Pierre
and Renard, Thierry and Rollan,
Serge and Taillandier, Patricia
Impact of fermentation conditions on the
production of bioactive compounds with anticancer, anti-inflammatory and
antioxidant properties in kombucha tea extracts. (2019) Process
Biochemistry, 83. 44-54. ISSN 1359-5113
Official URL:
https://doi.org/10.1016/j.procbio.2019.05.004
Impact of fermentation conditions on the production of bioactive
compounds with anticancer, anti-in
flammatory and antioxidant properties
in kombucha tea extracts
Silvia Alejandra Villarreal-Soto
a, Sandra Beaufort
a, Jalloul Bouajila
a,⁎, Jean-Pierre Souchard
a,b,
Thierry Renard
c, Serge Rollan
c, Patricia Taillandier
a,⁎aLaboratoire de Génie Chimique, UMR 5503, Université de Toulouse, CNRS, INPT, UPS, Toulouse, France bLaboratoire des Interactions Moléculaires et Réactivité Chimique et Photochimique, UMR 5623, Toulouse, France cLaboratoire Symbiotec, ZA les Pousses, Villeneuve-Tolosane, France
A B S T R A C T
The production of natural bioactive compounds through the fermentation of plants has increased in recent years. The biological activities of the extracts obtained from the fermentation of black tea with the kombucha con-sortium were evaluated. To improve the productivity of these compounds two different vessel geometries were used and successive extractions with solvents of increasing polarity were performed. Forty-seven compounds were identified by GC–MS, including several organic acids and phenolic compounds. Total phenolic content, pH value, and antioxidant, antiproliferation and anti-inflammatory activities were measured after 21 days of fer-mentation. A higher surface/height (s/h) ratio seemed to enhance the anti-inflammatory activity of kombucha tea, resulting in IC50value of 9.0 ± 0.1μg/mL compared to 24.3 ± 0.2 μg/mL with the lowest ratio. Regarding
the anticancer activity, the highest inhibition percentage of 55.3% at 50μg/mL against the HCT-116 human colon carcinoma cell line was obtained with the ethyl acetate extract after 21 days of fermentation compared to the value of 8% obtained with the same extraction solvent using the non-fermented black tea. These results showed that fermentation may improve the biological activities of the tea and that the production of bioactive compounds can vary depending on the fermentation conditions.
1. Introduction
Kombucha is a beverage of Manchurian origin obtained from sweet tea infusions which are fermented by a mixed microbial consortium composed of bacteria (e.g., Komagataeibacter xylinum, Acetobacter xyli-noides, Gluconobacter oxydans, Gluconacetobacter hansenii, Oenococcus oeni,Komagataeibacter europaeus, Lactobacillus sp…) and yeasts (e.g., Saccharomyces sp., Schizosaccharomyces pombe, Zygosaccharomyces kombuchaensis Torulaspora delbrueckii, Brettanomyces sp...) [1–4].
During kombucha fermentation, black tea compounds such as
flavo-noids, amino acids and phenolic acids [5] together with sucrose
undergo a transformation by the action of yeasts and bacteria. Many metabolites, such as organic acids (glucuronic, acetic), vitamins (C, B1,
B2, B12) and ethanol, are produced by this complex microbial
con-sortium [4,6,7]. Among them, some are able to inhibit the growth of potentially contaminating bacteria. Kombucha tea is also known for being a functional food with several benefits [8], such as neurodegen-erative disease prevention, blood pressure reduction, antioxidant ac-tivity, hypoglycemic effect, detoxification activity and anticancer properties, which are attributed to the produced metabolites during fermentation. This fermentation also leads to the formation of a solid polymeric structure ("bacterial cellulose") thatfloats on the surface of
Abbreviations: BSTFA, N,O-bis(trimethylsilyl)trifluoroacetamide; BHB, 3-tert-butyl-4-hydroxybenzoic acid; CAFF, caffeine; CAA, caffeic acid; C, catechin; CGA, chlorogenic acid; CA, P-coumaric acid; DPPH, 2,2-diphenyl-1-picrylhydrazyl; EC, (−)-epicatechin; ECG, epicatechin gallate; EGCG, epigallocatechin gallate; FA, ferulic acid; GA, gallic acid; HCT-116, human colon cancer cell line; HPLC, high performance liquid chromatography; LOD, limit of detection; LOQ, limit of quantification; LOX, lipoxygenase; MCF-7, breast cancer cell line; MTT, 3-(4,5-dimethylthiazol-2-yl)-2,5 diphenyltetrazolium bromide; NDGA, nordihydroguaiaretic acid; NSAID, nonsteroidal anti-inflammatory drugs; R2, coefficient of correlation; RI, refractive index; RUT, rutin hydrate; s/h, surface/height; s/v, surface/volume, specific interfacial area; TAX, taxifolin; TB, theobromine; TCA, trans-cinnamic acid; TMCS, chlorotrimethylsilane; TPC, total phenolic content; UPLC, ultra perfor-mance liquid chromatography
⁎Corresponding authors.
E-mail addresses: [email protected](J. Bouajila), [email protected](P. Taillandier).
https://doi.org/10.1016/j.procbio.2019.05.004
formula:
Yield (%) = Dry weight of bacterial cellulose (g/L) / Sucrose con-centration (g/L).
2.5. pH determination
The pH of the fermented tea was measured using an electronic pH-meter (Eutech Instruments, model pH 700).
2.6. Sugars, ethanol and acetic acid quantification (UPLC-RI)
One milliliter of the fermented medium was centrifuged at 10 000 rpm for 5 min (Fisherbrand Centrifuge, Illinois, USA). The super-natant was thenfiltered through a membrane filter (Fisherbrand, PTFE) (0.45μm) into UPLC vials. The resulting filtrate was subjected to quantitative analyses of sucrose, glucose, fructose, acetic acid and ethanol using HPLC (Thermo Scientific, Dardilly, France). Samples were injected into the UPLC system equipped with a refractive index detector and a Rezex ROA-Organic acid H+ (8%), 250 x 4.6 mm ion exclusion column (Phenomenex, Le Pecq, France) thermostated at 30 °C. The elution was performed at 170μL/min with a 10 mM sulfuric acid so-lution (pH 2.2). Twenty-five microliters of injection volume were au-tomatically analyzed. The concentration of each compound was quan-tified using standard curves and expressed as (g/L). Standard solutions were prepared with an analysis range of 1.25–10.00 g/L for the sucrose, glucose, fructose and ethanol quantifications and 0.25–2.00 g/L for the glycerol and acetic acid quantifications (Table 2). All the standards and sample dilutions were prepared using high quality deionized water.
2.7. Sample preparation and extraction
Kombucha fermented tea was extracted by using a differential li-quid-liquid method with immiscible organic solvents of increasing po-larity (ethyl acetate and butanol). The remaining aqueous phase was also characterized. All the extractions were performed at room tem-perature with 500 mL of solvent and 500 mL of fermented medium (1:1), and were performed twice to maximize the extraction process. Mechanical agitation was applied to increase the interfacial area be-tween the two phases followed by a settling stage that allowed the phases to separate. The solvents were then evaporated using a vacuum rotary evaporator at 35 °C (Heidolph, Germany) to obtain a dry extract.
Table 1
Characteristics of the fermentation vessels.
Vessel Diameter (cm) Area (cm2) Volume (cm3) s\v (cm−1) Height (cm) s\h (cm) A 9 63.6 963 0.066 15.15 4.19 B 23 415.2 6291 0.066 15.15 27.41
s/h: surface/height. s/v: surface/volume, specific interfacial area.
Table 2
LOD, LOQ, RT and R2of standards for UPLC analysis.
Metabolite RT (min) LOD (mg/L) LOQ (mg/L) R2
Sucrose 10.97 5 10 0.99 Glucose 12.57 5 10 0.99 Fructose 13.74 5 10 1.00 Glycerol 17.29 5 10 0.99 Acetic acid 19.28 5 10 0.99 Ethanol 24.02 10 20 0.99
RT: retention time. LOD: limit of detection. LOQ: limit of quantification. R2:
coefficient of correlation.
the culture medium because of the activity of certain strains such as Komagataeibacter xylinus or Gluconacetobacter spp. Moreover, other species that are not part of the Kombucha consortium are also capable to produce this cellulosic biofilm, such as Aerobacter, Agrobacterium, Azotobacter, and Rhizobium, Salmonella [9]. As the fermentation ad-vances, this cellulosic biofilm keeps widening and forming new layers that accumulate one over the other, and after 7–14 days, the cellulosic biofilm may reach a thickness between 8 and 12 mm. Its formation as well as fermentation kinetics can be influenced by several parameters such as, temperature, pH, dissolved oxygen, type of sugars, fermenta-tion time, and vessel geometry [10–12]. The last parameter is especially important in kombucha fermentation because it is performed in static conditions. Therefore, the activity of acetic acid bacteria, which are strictly aerobic, will highly depend on the transfer of oxygen from the air into the fermentation broth [10]. Several studies have shown the impact of the interfacial area on bacterial cellulose production as well as on the microbial kinetics, and different theories have been proposed [10,11,14]. Although these studies propose various interesting theories, little information is available regarding the influence of these para-meters on the kinetics and biological activities of kombucha tea. Therefore, the aim of this study was to evaluate the impact of the vessel geometry by examining the dynamics and bioactive properties of fer-mentation products from two vessels with different surface/height ra-tios but the same surface/volume ratio.
2. Materials and methods 2.1. Starter culture
The kombucha SCOBY used in this study was obtained from the Laboratory Symbiotec, Villeneuve-Tolosane, France. The culture was produced using a previous backslopping method.
2.2. Chemicals and reagents
The analytical standards used for the identification and quantifica-tion of the main phenolic compounds found in the tea were: gallic acid, theobromine, caffeine, chlorogenic acid, catechin, (-)-epicatechin, caf-feic acid, coumaric acid, ferulic acid, rutin hydrate, taxifolin, trans-cinnamic acid and 3-tert-butyl-4-hydroxybenzoic acid, all of which were obtained from Sigma-Aldrich (USA).
2.3. Preparation of standard solutions
Standard stock solutions of gallic acid, theobromine, caffeine, chlorogenic acid, catechin, (−)-epicatechin, caffeic acid, coumaric acid, ferulic acid, rutin hydrate, taxifolin, trans-cinnamic acid and 3-tert-butyl-4-hydroxybenzoic acid, were individually prepared at con-centrations of 50, 20, 10, 5, and 1 mg/L in water/acetonitrile (80:20 v/ v). Quantification was performed using the method described in Section 2.9. All of the solutions were stored at −20 °C to prevent degradation. 2.4. Preparation of the tea infusion and inoculation
Ten grams of black tea leaves obtained from the laboratory Symbiotec were added to 1 L of boiling water and allowed to infuse for 15 min at 80 °C. Afterwards, the tea leaves were removed, and sucrose was added at a concentration of 70 g/L. After the infusion was cooled to room temperature (25 °C), two different volumes 1 L (vessel A) and 6 L (vessel B), were inoculated with 40 g/L of the starter culture provided by Laboratory Symbiotec. The inoculated black tea was poured into the different sized fermentation vessels, resulting in the same specific in-terfacial area s/v of 0.066 cm−1 but two different s/h ratios (Table 1).
The vessels were covered with cheesecloth and incubated at 25 °C for 21 days. All fermentations were performed in duplicate. The final biofilm was weighed and the yield was calculated according to the following
2.8. Chemical composition (GC–MS)
Gas chromatography-mass spectrometry detection (GC–MS) analysis was carried out with a Varian Saturn 2000 (Les Ulis, France) ion trap GC/MS with a CP-3800 GC systemfitted with a fused silica capillary
DB-5MS column (5% phenylmethylpolysyloxane, 30 x 0.25 mm, film
thickness 0.25μm). Chromatographic conditions were a 60–260 °C
temperature increase at a gradient of 5 °C/min and 15 min of isothermal conditions at 260 °C. A second gradient was applied to reach 340 °C at 40 °C/min. The trap temperature was 250 °C and that of the transfer line was 270 °C. Mass scanning was performed from 40 to 650 m/z. Extracts were solubilized in their solvents of extraction (except for water extract,
where methanol was used) at 3 mg/mL and 2μL were injected.
Compounds were identified by (i) comparison of their retention index (RI) relative to C5-C24 n-alkanes obtained on a nonpolar DB-5MS column with those provided in the literature and (ii) by comparison of their mass spectra with those recorded in NIST 08 (National Institute of Standards and Technology).
2.8.1. Derivatization
The derivatization method used [15] consisted of dissolving 5 mg of each extract in 1 mL of acetonitrile and then adding 150μL of N,O-bis (trimethylsilyl)trifluoroacetamide (BSTFA) reagent and 1.5 μL of chlorotrimethylsilane (TMCS). After stirring, nitrogen was bubbled through the solution 20 s to eliminate the humidity from the air, and then the mixture homogenized via ultrasound for 10 s followed by an incubation in a heated bath at 40 °C, for 15 min. All samples (2μL) were injected directly. The identification of derivatized compounds from the organic extracts was carried out with the same GC–MS equipment but with another gradient: 5 min at 60 °C, 60–270 °C at 15 °C/min, 6 min at 270 °C, 270–300 °C at 50 °C/min and finally 4.5 min at 300 °C. The entire chromatographic program lasted 30 min. The identification of
compounds was performed as described in Section2.8. 2.9. Aromatic compound and polyphenol determination (HPLC-UV)
HPLC analyses were performed using a Thermos Scientific Dionex UltiMate 3000 pump and UV-150 model detector. Separation was achieved on a RP-C18 column (Phenomenex, Le Pecq, France), 25 cm x 4.6 mm and particle size 5μm, at room temperature. Elution was per-formed at aflow rate of 1.2 mL/min, using a mobile phase consisting of acidified water (pH = 2.65) acidified with pure acetic acid and water/ acetonitrile (20:80 v/v, pH = 2.65). To detect the majority of com-pounds, all samples were prepared at the same concentration (20 mg/ mL). Twenty microliters were then injected, and the detection was performed at 280 nm.
2.10. Antioxidant activity (DPPH assay)
The free radical scavenging activity was measured according to a previously described method [16] with some modifications. Twenty microliters of the kombucha extracts were mixed with 180μL of a 0.2 mM methanolic DPPH solution. The mixture was then incubated at 25 °C for 30 min. The reduction of the DPPH free radicals was assessed by reading the absorbance at 520 nm in a Multiskan Go spectro-photometer, and the results were recorded as A(sample). A blank ex-periment was performed using the same procedure without the extract, and the absorbance was measured as A (blank). Ascorbic acid was used as a standard. The free radical-scavenging activity of each solution was then calculated as the percent inhibition according to the following equation:
% inhibition = 100 (A(blank)– A(sample)) /A(blank)
2.11. Determination of total phenolic concentration (TPC)
TPC of kombucha fermented tea was quantified using the Folin-Ciocalteu colorimetric method [16]. One hundred microliters of Folin-Ciocalteu reagent (0.2 N) were added to 20μL of each extract prepared at a concentration of 3 mg/mL. After 5 min of incubation at room temperature, 80μL of sodium carbonate solution (75 g/L in water) were added. Then the mixture was incubated for 15 min and the absorbance was measured at 765 nm. A standard calibration curve was done using different concentrations of gallic acid (0–200 μg/mL). The results were expressed as mg of gallic acid equivalents (GAE)/g of dry weight (dw). 2.12. Anti-inflammatory activity
Anti-inflammatory evaluation was performed against the enzyme 5-LOX using a previously described method [16]. The activity
measure-ment was tested in a 96-well plate containing 150μL of 100 mM
phosphate buffer (pH 7.4), 20 μL of the extract solution at a con-centration of 3 mg/mL, 60μL of linoleic acid (3.5 mmol/L), and 20 μL of 5-LOX (Soybean 500 U). The mixture was then incubated at 25 °C for 10 min in a Multiskan Go spectrophotometer and the absorbance was measured at 234 nm. The anti-inflammatory activity was defined as the
Fig. 1. Dimensions of vessels used for kombucha tea fermentation.
Fig. 2. Scanning electron micrograph of bacteria embedded within the cellulose microfibrils from kombucha tea.
percentage of inhibition of the 5-LOX enzyme. Nordihydroguaiaretic acid (NDGA) was used as a standard.
2.13. Antiproliferation activity
This assay is based on the reduction of 3-(4, 5-dimethyl thiazol-2-yl)-2,5-diphenyl tetrazolium bromide (MTT) by the mitochondrial
de-hydrogenase of intact cells to a purple formazan product.
Antiproliferation of extracts on human colon cancer (HCT-116) and human breast cancer (MCF-7) cell lines was estimated as described
previously [16] with modifications. Cells were maintained at 37 °C in a humidified 5% CO2 incubator (NBS Eppendorf, Germany) using
Dul-becco’s modified Eagle’s medium (DMEM, Sigma Aldrich, USA) for the human breast cancer cell line and RPMI-1640 (Sigma Aldrich, USA) for the colon cancer cell line. Cells were seeded in 96-well plates at a concentration of 3 × 10⁴cells/well in 100μL of culture medium, and
then 100μL of culture medium containing a sample at various con-centrations were added. Non-treated control cells were also maintained for comparing growth inhibition. The plates were then incubated at 37 °C for 48 h. The supernatant was then removed, and 50μL of MTT
solution was added followed by incubation, for 40 min. After removing the MTT reagent (Sigma, M-5655), 80μL of DMSO were added to so-lubilize the formazan crystals. The absorbance was measured at 605 nm. All extracts were re-suspended in DMSO followed by dilution in the buffer so that the DMSO did not exceed 1%. Tamoxifen was used as a positive control.
2.14. Statistical analysis
The programs Minitab 17 and Microsoft Excel were used for the statistical treatment of the data. The means were compared by two-way analysis of variance (ANOVA) and the Tukey multiple comparison test (p < 0.05). All data are expressed as the mean ± standard deviation (SD) of triplicate measurements.
Fig. 4. HPLC chromatograms of ethyl acetate kombucha extracts. Peaks: 1-gallic acid (GA); 2-theobromine (TB); 3-catechin (C); 4-chlorogenic acid (CGA); 5-(-)-epicatechin (EC); 6-caffeic acid (CAA); 7-caffeine (CAFF); 9-ferulic acid (FA); 10-rutin hydrate (RUT); 12-trans-cinnamic acid (TCA); 13-3-tert-butyl-4-hydro-xybenzoic acid (BHB).
Fig. 5. HPLC chromatograms of butanol kombucha extracts. Peaks: 1-gallic acid (GA); 3-Catechin (C); 5-(-)-epicatechin (EC); 7-caffeine (CAFF); 9-ferulic acid (FA); 10-rutin hydrate (RUT); 11-taxifolin (TAX); 12-trans-cinnamic acid (TCA).
3. Results and discussion
3.1. Impact of the vessel geometry (s/h and s/v ratio)
Cvetković et al. [17] developed a mathematical model to ensure the scaling-up process of kombucha tea fermentation, which can be quite complex and should take into account several variables. In their study, they proposed that the specific interfacial area was the key variable that would ensure the scaling-up procedure. They concluded that regardless the vessel size, if the specific interfacial area (s/v) is the same, the final kombucha tea may had the same characteristics. To prove this theory, two vessels (Fig. 1) with different s/h ratio (4.19 and 27.41 cm) and the same specific interfacial area s/v (0.066 cm−1) were used to determine
which parameter had a bigger impact on the processing. 3.2. Cellulose production and scaling-up process
Cellulose production values were similar for both vessels reaching a value of 23 g/L with a depth of 15 cm and afinal yield percentage of 1.1 and 0.7 for vessels A and B, respectively, after 21 days of fermentation. This similarity in the cellulose production, despite different vessel depths could be due to the fact that bacteria form the biofilm at the air-liquid surface. According to Hornung [11], this biofilm represents ap-proximately 10% of the total bacterial cells that may have been trapped in the cellulose matrix (Fig. 2) contributing in this way to its formation. This can be a key information regarding kombucha fermentation, be-cause the biofilm development could be improved and because larger volumes of fermented tea could be obtained at the same time. Thus, it was concluded that the depth was a determining parameter for the optimization of cellulose production because it can reduce the fer-mentation time and therefore the cost of the process.
3.3. Sugars consumption
The results of the fermentation kinetics (Fig. 3) revealed that the parameter s/h had a clear impact, both on substrates consumption and on metabolite production. Sucrose was hydrolyzed into glucose and fructose in both cases and occurred linearly with time, reachingfinal
values of 3.8 and 0.2 g/L in vessels A and B, respectively. After 15 days of fermentation, the sucrose concentration was around 12 and 2 g/L, for vessels A and B, respectively, similar to the values obtained by Kallel et al [18] with a concentration of 100 g/L sucrose at the beginning of fermentation. Regarding the consumption of reducing sugars, glucose is typically preferred by the microbial consortium over fructose, which normally results in a difference between the consumption of the two sugars, leading to a sluggish fermentation and therefore, an increased risk of potential contamination [19]. However, in the case of kombucha fermentation, both sugars were consumed without accumulating in the fermented medium because of the multiple microorganisms and bio-chemical pathways that were occurring simultaneously. Nevertheless, in vessel B, which was the one with the higher surface area, sucrose began to be consumed in thefirst days of incubation. However, sucrose consumption was much slower vessel A, showing that a higher s/h ratio may accelerate the fermentation kinetics.
3.4. Ethanol content
The production of ethanol was faster in the vessel with the higher surface area, with a maximum production of 32.8 ± 4.7 g/L (4.1% v/ v) after 11 days, compared to a production of 23.1 ± 2.4 g/L (2.9% v/ v) after 16 days in the vessel with the smaller surface area. However, notably despite this fact, thefinal ethanol concentration was almost the same in both vessels after 21 days of fermentation, of around 11 g/L (1.4% v/v), although in the vessel with the higher surface area it was rapidly produced and rapidly re-consumed. The obtained ethanol con-centrations are higher than those reported in other studies [20,21] which were in the range of 2–8 g/L with 70 and 100 g/L initial sucrose, compared to 11.2 g/L. Differences between several kombucha fermen-tations may be caused by the origin of the inoculum as well as the fermentation conditions.
3.5. pH values and acidity
The pH value of the initial black tea infusion was 6.4, which dropped nearly three units after 1 h of incubation with the consortium and continued to decrease during the first 15 days until it became
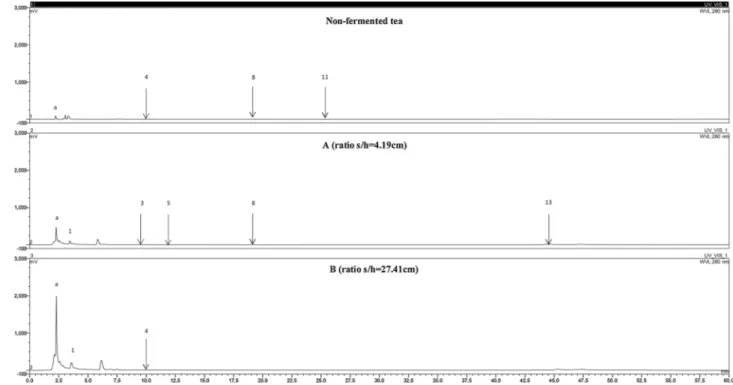
Fig. 6. HPLC chromatograms of aqueous kombucha extracts. Peaks: 1-gallic acid (GA); 3-catechin (C); 4-chlorogenic acid (CGA); 5-(-)-epicatechin (EC); 8-coumaric acid (CA); 11-taxifolin (TAX); 13-3-tert-butyl-4-hydroxybenzoic acid (BHB).
stable, reaching afinal value of 2.7. Several authors have reported the same behavior [6,18,21] which is normal because of the organic acids produced, mainly acetic acid. Cvetković [13] found the same tendency in terms of titratable acidity, where the specific area ratios had a huge impact. Thefinal concentrations of acetic acid after 21 days were dif-ferent between the two ratios, 15.1 in A and 6.0 g/L in B. Usually acetic acid bacteria oxidize ethanol to acetaldehyde and then to acetic acid [22,23], but this was not the case in vessel B, in which the concentra-tion of acetic acid was much lower than that of ethanol. This can be explained either by the cell concentration of acetic acid bacteria or by the metabolic path followed in each culture media, considering the hypothesis that some bacteria can produce ethanol and others can consume it and produce acetic acid. This suggests that important in-teractions occur between yeast and bacteria that are present both in the liquid broth and in the cellulose pellicle [3,24–26].
3.6. Chemical composition of kombucha extracts 3.6.1. HPLC analysis
HPLC analysis was performed and several compounds were detected at 280 nm in all kombucha extracts.Fig. 4shows the high-resolution separation of 14 compounds in the ethyl acetate extract of the non-fermented tea samples compared to 8 compounds in the non-fermented samples. This decrease may be due to the microbial transformation, or to the nature of the phenolic compounds [26]. It can be observed that compounda increased in concentration from trace amounts to a high intensity peak in vessel B after fermentation. Compoundse, f, and g were consumed during fermentation andb, c and d were produced in vessels B and A, respectively. A similar profile was obtained with bu-tanol extracts (Fig. 5), in which compounda showed the same behavior of increased intensity together with ethyl acetate and the aqueous fraction. Regarding the aqueous fraction (Fig. 6), the compounds ob-tained after fermentation were visibly of higher intensity with the ratio of vessel B compared to the trace amounts found in the non-fermented tea. This analysis allowed to observe the highest impact of the s/h ratio and the fermentation on the compounds formation or biotransformation process.
3.6.2. Identification and quantification of the main phenolic compounds Fourteen components were identified and quantified in the black tea and kombucha samples using a gradient HPLC method based in their retention times compared with those of standards. The content of each component was calculated as milligrams per kilogram of kombucha tea extract (Table 3). It was observed in the ethyl acetate extracts (Fig.4) that the highest content of phenolic compounds was in the non-fer-mented tea and then it gradually decreased after fermentation. Black tea contains several phenolic compounds that may be subjected to biotransformation during processing, increasing or reducing their con-centration. Yeast and bacteria are also known to play a crucial role in the metabolism of these compounds [27]. For the identified com-pounds, TB and CAA were completely consumed, and CAFF was nearly depleted decreasing from a concentration of 35142.4 to 41.1 mg/kg after 21 days of fermentation. The release of catechins from microbial cells and the oxidation of EGCG or ECG by oxidative degallation [28] could explain the amount determined in this study of 3161.6 mg/kg in the case of the vessel B compared to that Lin [21] found (50 mg/kg) in non-fermented black tea samples. The increased concentrations (˜80%) of GA in both fermented ratios may be due to the de-esterification of the 3-galloyl substituted catechins by the enzymes secreted during the fermentation [29]. On the other hand, in the butanolic extract of the fermented tea the concentration of many phenolic compounds (C, FA, TAX) increased with the high s/h ratio as did the GA content in the aqueous residual phase compared to the values in the non-fermented tea. Other compounds such as, EC and CA were considerably reduced during the tea fermentation. Similar concentrations as those reported by Souza et al [30] were obtained in the range of 0.1−0.3 mg g−1for
Table 3 Content of phenolic compounds, theobromine and ca ff eine from black tea and kombucha extracts by HPLC (mg/kg). N° RT Compound InChI Key Non-fermented tea A (ratio s/h = 4.19 cm) B (ratio s/h = 27.41 cm) EtOAc BuOH H2 O EtOAc BuOH H2 O EtOAc BuOH H2 O 1 3.45 Gallic acid (GA) LNTHITQWFMADLM-UHFFFAOYSA-N 26.0 ± 3.0 2969.0 ± 486.6 1359.5 ± 499.7 2859.4 ± 76.3 2 4.26 Theobromine (TB) YAPQBXQYLJRXSA-UHFFFAOYSA-N 50.2 ± 0.8 3 9.56 Catechin (C) PFTAWBLQPZVEMU-HIFRSBDPSA-N 12.4 ± 0.3 0.2 ± 0.1 575.0 ± 0.8 3161.7 ± 7.0 4 9.93 Chlorogenic acid (CGA) CWVRJTMFETXNAD-JUHZACGLSA-N 8.3 ± 0.4 4.0 ± 0.5 2.7 ± 0.1 5 11.93 (− )-Epicatechin (EC) PFTAWBLQPZVEMU-UKRRQHHQSA-N 87.5 ± 3.4 2.6 ± 0.8 0.3 ± 0.0 1.6 ± 0.5 6 12.99 Ca ff eic acid (CAA) QAIPRVGONGVQAS-DUXPYHPUSA-N 179.1 ± 10.6 7 14.6 Ca ff eine (CAFF) RYYVLZVUVIJVGH-UHFFFAOYSA-N 35142.4 ± 555.8 41.1 ± 0.7 8 19.33 P-Coumaric acid (CA) NGSWKAQJJWESNS-ZZXKWVIFSA-N 21.3 ± 0.1 0.5 ± 0.3 9 20.60 Ferulic acid (FA) KSEBMYQBYZTDHS-HWKANZROSA-N 4.7 ± 0.9 7.6 ± 0.3 88.0 ± 1.6 10 22.69 Rutin hydrate (RUT) PGHSKTKIQIBATG-ZAAWVBGYSA-N 56.4 ± 3.1 7.13 ± 2.8 2.3 ± 0.1 11 25.3 Taxifolin (TAX) CXQWRCVTCMQVQX-LSDHHAIUSA-N 0.3 ± 0.0 3.1 ± 0.2 12 41.54 Trans-Cinnamic Acid (TCA) WBYWAXJHAXSJNI-VOTSOKGWSA-N 852.2 ± 5.4 0.4 ± 0.0 0.6 ± 0.2 13 44.56 3-tert-Butyl-4-hydroxybenzoic acid (BHB) PVFDJRIEGYDIEK-UHFFFAOYSA-N 16.2 ± 2.0 279.0 ± 22.7 13.9 ± 1.3 All the data are average values of triplicate analyses.
CA. Rutin hydrate and 3-tert-butyl-4-hydroxybenzoic acid were present before and after the fermentation, differing from TAX which seems to be produced during fermentation especially in well aerated vessels. 3.6.3. GC–MS analysis
The compounds identified in the GC–MS analysis are summarized in Table 4. Caffeine and 2,5-di-tert-butylphenol were detected in the non-fermented tea samples as well as in the non-fermented samples. The samples were then derivatized by silylation to increase their detectability and 47
different compounds were detected including several organic and
phenolic acids, alcohols and sugars. Glycerol was found in all samples.
It can be produced by Saccharomyces cerevisiae during the hydrolysis of glucose to ethanol [31]. It can also be produced by several osmotolerant yeasts belonging to the genera Candida, Pichia, Schizosaccharomyces, Torulaspora and Zygosaccharomyces, that are normally present in the kombucha consortium. Around 50% of the detected compounds were found in the ethyl acetate extracts, and these were also the compounds with the highest biological activities. This may be attributed to the presence of the organic acids that have been reported to be active compounds in kombucha tea [32]. Lactic acid is known to function as a natural preservative in foods and to have beneficial effects on the di-gestive system [33]. The obtained results agree with those found in a
Without derivatization
N° RT (min) Compound InChI Key Non-fermented tea A (ratio s/h = 4.19 cm) B (ratio s/h = 27.41 cm)
EtOAc BuOH H2O EtOAc BuOH H2O EtOAc BuOH H2O
1 13.88 2,5-di-tert-butylphenol KDBZVULQVCUNNA-UHFFFAOYSA-N 0.83 0.11 1.62 0.19
2 16.84 Caffeine RYYVLZVUVIJVGH-UHFFFAOYSA-N 9.14 0.06 5.25 14.19 6.97
With derivatization
1 7.02 Isovaleric acid GWYFCOCPABKNJV-UHFFFAOYSA-N 0.64 2.96 1.39
2 7.59 Carbonic acid AOQORSDBSDUUBQ-UHFFFAOYSA-N 1.27
3 7.99 Pyruvic acid LCTONWCANYUPML-UHFFFAOYSA-N 16.53 19.11 30.25 20.09 19.27
4 8.28 Formic acid BDAGIHXWWSANSR-UHFFFAOYSA-N 2.18
5 8.42 2,3 Butanediol OWBTYPJTUOEWEK-UHFFFAOYSA-N 41.57 11.75 48.36 49.47 6.97
6 8.57 2,3 Butanediol (isomer 2) OWBTYPJTUOEWEK-UHFFFAOYSA-N 27.92
7 8.91 Lactic acid JVTAAEKCZFNVCJ-UHFFFAOYSA-N 66.82 25.94
8 9.03 Furan, tetrahydro-2-peroxy JSZPBTUOIOMFMS-UHFFFAOYSA-N 26.06 12.66 143.67 89.03 305.54 245.10 38.41 147.06
9 9.17 Caproic acid (hexanoic) FUZZWVXGSFPDMH-UHFFFAOYSA-N 0.75
10 10.03 3-Hydroxypropionic acid ALRHLSYJTWAHJZ-UHFFFAOYSA-N 3.90
11 10.12 (2E)-2-Butene-1,4-diol ORTVZLZNOYNASJ-OWOJBTEDSA-N 7.58
12 10.18 α-Hydroxy isovaleric acid NGEWQZIDQIYUNV-SCSAIBSYSA-N 8.84 7.85
13 10.98 2-hydroxy-3-methylpentanoic acid
RILPIWOPNGRASR-UHFFFAOYSA-N 2.89
14 11.07 Butyric acid FERIUCNNQQJTOY-UHFFFAOYSA-N 4.97
15 11.10 2-Phenylethanol WRMNZCZEMHIOCP-UHFFFAOYSA-N 4.74 11.22
16 11.33 Glycerol PEDCQBHIVMGVHV-UHFFFAOYSA-N 221.99 3338.37 1605.27 244.68 3219.66 3791.11
17 11.41 Octanoic acid WWZKQHOCKIZLMA-UHFFFAOYSA-N 0.82 0.28
18 11.70 Propanoic acid XBDQKXXYIPTUBI-ZDOIIHCHSA-N 69.17 1.54
19 11.90 Succinic acid KDYFGRWQOYBRFD-UHFFFAOYSA-N 923.57 443.74 56.63 1185.47 559.50 23.59
20 12.22 Z-Fumaric acid VZCYOOQTPOCHFL-OWOJBTEDSA-N 9.60
21 13.37 Malic acid BJEPYKJPYRNKOW-UHFFFAOYSA-N 12.23 18.93 17.07 21.69 41.02
22 13.71 Salicylic acid YGSDEFSMJLZEOE-UHFFFAOYSA-N 2.40
23 13.74 Erythronic acid JPIJQSOTBSSVTP-PWNYCUMCSA-N 9.36
24 13.85 Threonic acid JPIJQSOTBSSVTP-GBXIJSLDSA-N 1.40
25 13.94 3,5-di-t-butyl-4-hydroxybenzoic acid ethyl ester
FJKROLUGYXJWQN-UHFFFAOYSA-N 13.07 19.68 2.43
26 14.08 2-hydroxyglutaric acid HWXBTNAVRSUOJR-UHFFFAOYSA-N 17.22 12.91 4.91
27 14.2 4-Hydroxyphenyl ethanol YCCILVSKPBXVIP-UHFFFAOYSA-N 27.88 38.66
28 14.31 2-hydroxy-2-phenyl-propanoic acid
NWCHELUCVWSRRS-UHFFFAOYSA-N 32.49
29 14.37 2-Ketoglutaric acid KPGXRSRHYNQIFN-UHFFFAOYSA-N 2.06 20.69
30 14.63 Beta-D-Arabinopyranose SRBFZHDQGSBBOR-SQOUGZDYSA-N 1.18
31 14.86 2-hydroxyadipic acid OTTXIFWBPRRYOG-UHFFFAOYSA-N 0.31
32 15.06 L-(-)-Arabitol HEBKCHPVOIAQTA-IMJSIDKUSA-N 40.08 18.31 76.76
33 15.12 Erythritol UNXHWFMMPAWVPI-ZXZARUISSA-N 3.06
34 15.26 2-Deoxyribonic acid VBUWJOHKCBQXNU-IUYQGCFVSA-N 0.50
35 15.55 D-(-)-Tagatofuranose RFSUNEUAIZKAJO-OEXCPVAWSA-N 150.25
36 15.75 L-sorbofuranose RFSUNEUAIZKAJO-AMVSKUEXSA-N 0.76 7.46 13.11 1195.71 2976.05 10.33 424.60
37 15.89 Citric acid KRKNYBCHXYNGOX-UHFFFAOYSA-N 21.48 781.49
38 15.92 Mannopyranoside SRBFZHDQGSBBOR-UHFFFAOYSA-N 4.05
39 15.95 L-(-)-Arabitol (isomer) HEBKCHPVOIAQTA-IMJSIDKUSA-N 110.11
40 16.32 Lactulose JCQLYHFGKNRPGE-FCVZTGTOSA-N 5076.23
41 16.47 Gluconic acid RGHNJXZEOKUKBD-SQOUGZDYSA-N 77.24 638.57 13.67 42.20 288.14
42 16.55 2-Hydroxy-3-(4-hydroxyphenyl)propanoic acid
JVGVDSSUAVXRDY-UHFFFAOYSA-N 17.20
43 16.9 Gallic acid LNTHITQWFMADLM-UHFFFAOYSA-N 158.97 460.74 85.81 651.71 73.14
44 17.04 Ribonic acid QXKAIJAYHKCRRA-BXXZVTAOSA-N 55.95
45 20.23 Sucrose CZMRCDWAGMRECN-UGDNZRGBSA-N 8.22 1025.21 20.93 106.54
46 20.81 D-(+)-Turanose SEWFWJUQVJHATO-RMDVNNDRSA-N 4.65 12.28 61.54 7.14
47 24.54 Catechin PFTAWBLQPZVEMU-HIFRSBDPSA-N 11.50 10.03
Table 4
previous study [32], in which the presence of lactic acid was observed after three days of fermentation in both green and black teas, but not in non-fermented sample, as this acid is formed by some yeasts and mainly by lactic acid bacteria. Pyruvic, malic, salicylic, succinic, citric and gluconic acids were detected in all samples, and these acids have been reported to be the most abundant acids found in kombucha tea [8].
3.6.3.1. Principal component analysis (PCA). The molecules production patterns were investigated using PCA (Fig. 7). Principal components 1 and 2 explained 59.9 and 21.7 of the total variance, respectively. This analysis was done in order to investigate the relationship between the produced metabolites in the Kombucha samples at the end of fermentation (two different ratios:A and B) and the non-fermented
Fig. 7. PCA score plots of the GC–MS obtained molecules. (a) three different samples where NF: non-fermented tea and at the end of the fermentation for the A and B conditions (ratios s/h = 4.19 cm and s/h = 27.41 cm) and (b) chemical groups distribution.
Table 5
Total polyphenols, DPPH and anti-inflammatory activities of kombucha tea.
Sample Extract Total polyphenols (mg eq AG/g) DPPH Anti-inflammatory activity
% at 50μg/mL IC50(μg/mL) % at 50μg/mL IC50(μg/mL)
Non-fermented tea EtOAc 215.0 ± 0.9a 98.1 ± 0.3a 9.5 ± 0.3a 66.0 ± 1.7a > 50a
BuOH 35.9 ± 0.8b 70.9 ± 1.7b 28.0 ± 0.5b 0b > 50a H2O 3.0 ± 0.2c 14.6 ± 1.1c > 50c 0b > 50a A EtOAc 221.6 ± 6.8a 96.4 ± 0.0a 9.0 ± 0.1a 87.7 ± 0.4c 24.3 ± 0.2b BuOH 43.4 ± 2.3b 77.6 ± 2.0d 26.0 ± 0.0d 36.9 ± 0.5d > 50a H2O 8.9 ± 0.2c,d 18.2 ± 0.0e > 50c 19.0 ± 0.9e > 50a B EtOAc 212.4 ± 6.1a 96.3 ± 0.3a 9 ± 0.0a 91.47 ± 0.7c 9.0 ± 0.0c BuOH 92.2 ± 1.7e 96.2 ± 0.4a 16 ± 0.5e 81.8 ± 1.6f 16.0 ± 0.5d H2O 11.8 ± 1.0d 23.5 ± 0.6e > 50c 20.5 ± 0.9e > 50a
Values in the same column that are labeled with different letters (a–f) differ significantly (p < 0.05).
tea. A clear difference in the diversity of detected molecules can be observed between the NF and the A and B, showing the high impact of the fermentation (Fig. 7a). However, a negative correlation was observed specifically in the case of the phenolic compounds (catechin, 2,5-di-tert-butylphenol) and organic acids (isovaleric, pyruvic, lactic, citric, gallic, gluconic) (Fig. 7b), suggesting that these molecules had opposite behaviors regarding their production, either by increasing (gallic acid) or by being produced just after 21 days of fermentation (organic acids) when compared to the NF tea. The low positive correlation observed in acids and alcohols, revealed that these compounds were present in both ratios but did not follow exactly the same production pattern.
3.7. Phenolic composition and antioxidant activity
The total phenolic composition present in kombucha extracts was determined by the Folin-Ciocalteu method obtaining concentrations in the range of 36.0–221.6 mg eq AG/g for all samples (Table 5). Similar concentrations were found by Turkmen et al. [34] who obtained values in the range of 29.1–80.4 mg eq AG/g in extracts of non-fermented black tea, showing that tea phenolic composition is fairly constant de-spite tea processing. However its chemical structure may change or be polymerized into molecules with higher molecular weight [35]. This might have happened during the fermentation as the total phenolic composition in the butanol and water extracts was twice that in the non-fermented tea. The antioxidant capacity of the extracts, was mea-sured by the DPPH method in thefinal solvent extracts.Table 5shows the antioxidant activities of the tested samples (ethyl acetate, butanol and aqueous fractions), which were high in both s/h ratio conditions, indicating that the activity it is not affected by the vessel geometry or the fermented volume. The enhancement of antioxidant activity has been reported in others studies [26,27], which can be due to the in-teractions between microbial enzymes and phytochemicals in the fer-mented media. In the case of the two tested ratios, the increase in the phenolic content as well as in the antioxidant activity were higher with the highest vessel ratio, increasing from 70.9% inhibition in the non-fermented tea to 96.2% in the butanol extracts and from 14.6 to 23.5% in the water extracts. The half-maximal inhibitory concentration (IC50)
was also calculated. The highest value was in the ethyl acetate extracts, which probably means that most of the antioxidants compounds in the tested samples were non-polar.
3.8. Anti-inflammatory activity
No studies on 5-LOX inhibition with kombucha tea extracts have been published in the literature. Our results (Table 5) indicated an improvement in this activity after fermentation with the kombucha consortium. The non-fermented tea obtained 66% or even 0% of in-hibition compared to 87–91% after 21 days of fermentation. An IC50
value of 9.0 ± 0.00μg/mL was obtained for vessel B, with ethyl
acetate extract, which is close to the maximal inhibitory concentration of 7.0 ± 0.2μg/mL for the natural LOX inhibitor Nordihydroguaiaretic
acid (NDGA). These results indicated that kombucha extracts can po-tentially be effective as 5-LOX inhibitors and consequently become an alternative for the development of non-steroidal drugs (NSAIDs).
3.9. Antiproliferation evaluation
Kombucha tea extracts were tested against human breast cancer (MCF-7) and human colon cancer (HCT-116) cell lines and an en-hancement of anticarcinogenic activity after fermentation in all vessels and for both cell lines was observed (Fig. 8). The kombucha consortium was able to produce bioactive compounds with different polarities, obtaining an inhibition increase in all the tested extracts compared to the non-fermented tea. However, the highest inhibition percentage was obtained with vessel B, especially against the HCT-116 cell line. These results showed a good similarity with those obtained by Jayabalan et al. [36] where the highest inhibition percentage was found with the ethyl acetate extract (55.3%) against HCT-116 cell line. However, this was significantly different from the rest of the samples at a concentration of 50μg/mL. Regarding the human breast cancer cells, the fermentation was found to have the largest effect, increasing the inhibition percen-tages in both vessels.
4. Conclusion
Several parameters should be taken into account to provide a sui-table environment to the active consortium. Two different s/h ratios with the same interfacial area were compared to determine which parameter had more significant effect on the final product. The results showed that with a higher s/h ratio the fermentation kinetics were
accelerated and the final anti-inflammatory and antiproliferation
properties were improved. These results supports the conclusion that using different vessel geometries may produce different fermentation metabolites and bioactive compounds. A statistically significant differ-ence (p < 0.05) was observed between all samples and extracts, also supporting this conclusion. Moreover, these findings suggested that fermentation of black tea with the kombucha consortium increases its bioactive potential and promotes the synergy between the fermentation metabolites and the microorganisms leading to the formation of interest compounds. These results represent preliminaryfindings that will aid in the evaluation of the bioactive potential of kombucha extracts.
Author contributions
Silvia Alejandra Villarreal-Soto performed the experiments and wrote the manuscript under the supervision of the other authors. Patricia Taillandier, Sandra Beaufort, Jalloul Bouajila, and Jean-Pierre Souchard validated the experiments and refined and revised the manuscript for publication. Thierry Renard and Serge Rollan provided the starting culture.
Fig. 8. Effect of kombucha tea extracts (50 μg/mL) on human breast cancer (MCF-7) and human colon cancer (HCT-116) cells. NF: non-fermented tea; A: ratio s/ h = 4.19 cm; B: ratio s/h = 27.41 cm.
[1] A.L. Teoh, G. Heard, J. Cox, Yeast ecology of Kombucha fermentation, Int. J. Food Microbiol. 95 (2004) 119–126,https://doi.org/10.1016/j.ijfoodmicro.2003.12. 020.
[2] R. Jayabalan, S. Baskaran, S. Marimuthu, K. Swaminathan, S.E. Yun, Effect of kombucha tea on aflatoxin B1 induced acute hepatotoxicity in albino rats-pro-phylactic and curative studies, J. Appl. Biol. Chem. 53 (2010) 407–416,https://doi. org/10.3839/jksabc.2010.063.
[3] A.J. Marsh, O. O’Sullivan, C. Hill, R.P. Ross, P.D. Cotter, Sequence-based analysis of the bacterial and fungal compositions of multiple kombucha (tea fungus) samples, Food Microbiol. 38 (2014) 171–178,https://doi.org/10.1016/j.fm.2013.09.003. [4] M. Coton, A. Pawtowski, B. Taminiau, G. Burgaud, F. Deniel, L.
Coulloumme-Labarthe, A. Fall, G. Daube, E. Coton, Unraveling microbial ecology of industrial-scale Kombucha fermentations by metabarcoding and culture-based methods, FEMS Microbiol. Ecol. 93 (2017) 1–16,https://doi.org/10.1093/femsec/fix048. [5] M. Naveed, J. BiBi, A.A. Kamboh, I. Suheryani, I. Kakar, S.A. Fazlani, X. FangFang,
S.A. kalhoro, L. Yunjuan, M.U. Kakar, M.E. Abd El-Hack, A.E. Noreldin, S. Zhixiang, C. LiXia, Z. XiaoHui, Pharmacological values and therapeutic properties of black tea (Camellia sinensis): a comprehensive overview, Biomed. Pharmacother. 100 (2018) 521–531,https://doi.org/10.1016/j.biopha.2018.02.048.
[6] R. Malbaša, E. Lončar, M. Djurić, M. Klašnja, L.J. Kolarov, S. Markov, Scale-up of black tea batch fermentation by kombucha, Food Bioprod. Process. 84 (2006) 193–199,https://doi.org/10.1205/fbp.05061.
[7] J. Lin, C. Lin, Y. Liang, I. Juan, Survey of Catechins, Gallic Acid, and
Methylxanthines in Green, Oolong, Pu-erh, and Black Teas, 8561 (1998),https:// doi.org/10.1021/jf980223x.
[8] M.I. Watawana, N. Jayawardena, C.B. Gunawardhana, V.Y. Waisundara, Health, wellness, and safety aspects of the consumption of kombucha, J. Chem. 2015 (2015),https://doi.org/10.1155/2015/591869.
[9] B.V. Mohite, S.V. Patil, A novel biomaterial: bacterial cellulose and its new era applications, Biotechnol. Appl. Biochem. 61 (2014) 101–110,https://doi.org/10. 1002/bab.1148.
[10] A. Phunsri, P. Tammarate, W. Krusong, S. Tantratian, The liquid / air interface area and depth of liquid medium suitable for cellulose production from Acetobacter tistr 975, J. Sci. Res. Chula. Univ. 28 (2003) 35–43.
[11] M. Hornung, Optimizing the Production of Bacterial Cellulose in Surface Culture : Evaluation of Substrate Mass Transfer Influences on the Bioreaction (Part 1), (2006), pp. 537–545,https://doi.org/10.1002/elsc.200620162.
[12] A. Rosma, A.A. Karim, R. Bhat, Fermentation of Black Tea Broth (Kombucha): I. Effects of Sucrose Concentration and Fermentation Time on the Yield of Microbial Cellulose 19 (2012), pp. 109–117.
[13] C. Chen, B.Y. Liu, Changes in major components of tea fungus metabolites during prolonged fermentation, J. Appl. Microbiol. 89 (2000) 834–839,https://doi.org/ 10.1046/j.1365-2672.2000.01188.x.
[14] M. Schramm, S. Hestrin, Factors affecting production of cellulose at the air/ liquid interface of a culture of Acetobacter xylinum, J. Gen. Microbiol. 11 (1954) 123–129,https://doi.org/10.1099/00221287-11-1-123.
[15] S.H. Tzing, W.H. Ding, Determination of melamine and cyanuric acid in powdered milk using injection-port derivatization and gas chromatography-tandem mass spectrometry with furan chemical ionization, J. Chromatogr. A 1217 (2010) 6267–6273,https://doi.org/10.1016/j.chroma.2010.07.081.
[16] J. Bekir, M. Mars, J.P. Souchard, J. Bouajila, Assessment of antioxidant, anti-in-flammatory, anti-cholinesterase and cytotoxic activities of pomegranate (Punica granatum) leaves, Food Chem. Toxicol. 55 (2013) 470–475,https://doi.org/10.
1016/j.fct.2013.01.036.
[17] D. Cvetković, S. Markov, M. Djurić, D. Savić, A. Velićanski, Specific interfacial area as a key variable in scaling-up Kombucha fermentation, J. Food Eng. 85 (2008) 387–392,https://doi.org/10.1016/j.jfoodeng.2007.07.021.
[18] L. Kallel, V. Desseaux, M. Hamdi, P. Stocker, E.H. Ajandouz, Insights into the fer-mentation biochemistry of Kombucha teas and potential impacts of Kombucha drinking on starch digestion, Food Res. Int. 49 (2012) 226–232,https://doi.org/10. 1016/j.foodres.2012.08.018.
[19] J. Tronchoni, A. Gamero, F.N. Arroyo-López, E. Barrio, A. Querol, Differences in the glucose and fructose consumption profiles in diverse Saccharomyces wine species and their hybrids during grape juice fermentation, Int. J. Food Microbiol. 134 (2009) 237–243,https://doi.org/10.1016/j.ijfoodmicro.2009.07.004. [20] J. Reiss, Influence of different sugars on the metabolism of the tea fungus, Z.
Lebensm. Unters. Forsch. 198 (1994) 258–261,https://doi.org/10.1007/ BF01192606.
[21] A. Velićanski, D. Cvetković, S. Markov, Characteristics of Kombucha fermentation on medicinal herbs from Lamiaceae family, Romani 18 (2013) 8034–8042. [22] R. Jayabalan, R.V. Malbaša, E.S. Lončar, J.S. Vitas, M. Sathishkumar, A review on
kombucha tea-microbiology, composition, fermentation, beneficial effects, toxicity, and tea fungus, Compr. Rev. Food Sci. Food Saf. 13 (2014) 538–550,https://doi. org/10.1111/1541-4337.12073.
[23] Z. Yang, F. Zhou, B. Ji, B. Li, Y. Luo, L. Yang, T. Li, Symbiosis between micro-organisms from kombucha and kefir: potential significance to the enhancement of kombucha function, Appl. Biochem. Biotechnol. 160 (2010) 446–455,https://doi. org/10.1007/s12010-008-8361-6.
[24] N.K. Nguyen, P.B. Nguyen, H.T. Nguyen, P.H. Le, Screening the optimal ratio of symbiosis between isolated yeast and acetic acid bacteria strain from traditional kombucha for high-level production of glucuronic acid, LWT - Food Sci. Technol. 64 (2015) 1149–1155,https://doi.org/10.1016/j.lwt.2015.07.018.
[25] S. Chakravorty, S. Bhattacharya, A. Chatzinotas, W. Chakraborty, D. Bhattacharya, R. Gachhui, Kombucha tea fermentation: microbial and biochemical dynamics, Int. J. Food Microbiol. 220 (2016) 63–72,https://doi.org/10.1016/j.ijfoodmicro.2015. 12.015.
[26] S. Kallithraka, M.I. Salacha, I. Tzourou, Changes in phenolic composition and an-tioxidant activity of white wine during bottle storage: accelerated browning test versus bottle storage, Food Chem. 113 (2009) 500–505,https://doi.org/10.1016/j. foodchem.2008.07.083.
[27] Y. Wang, Z. Kan, H.J. Thompson, T. Ling, C. Ho, D. Li, X. Wan, Impact of six typical processing methods on the chemical composition of tea leaves using a single Camellia sinensis cultivar, Longjing 43 (2018),https://doi.org/10.1021/acs.jafc. 8b05140.
[28] T. Muthumani, R.S.S. Kumar, Food Chemistry Influence of Fermentation Time on the Development of Compounds Responsible for Quality in Black Tea 101 (2007), pp. 98–102,https://doi.org/10.1016/j.foodchem.2006.01.008.
[29] S. Sang, J.D. Lambert, C. Ho, C.S. Yang, The chemistry and biotransformation of tea constituents, Pharmacol. Res. 64 (2011) 87–99,https://doi.org/10.1016/j.phrs. 2011.02.007.
[30] R. Souza, A. Azevedo, B. Souto, M. Celeste, Multivariate analysis of the composition of bioactive in tea of the species Camellia sinensis, Food Chem. 273 (2019) 39–44,
https://doi.org/10.1016/j.foodchem.2018.04.030.
[31] H. Wang, K. Helliwell, Determination of ¯ Avonols in Green and Black Tea Leaves and Green Tea Infusions by High-performance Liquid Chromatography 34 (2001), pp. 223–227.
[32] R. Jayabalan, S. Marimuthu, K. Swaminathan, Changes in content of organic acids and tea polyphenols during kombucha tea fermentation, Food Chem. 102 (2007) 392–398,https://doi.org/10.1016/j.foodchem.2006.05.032.
[33] R. Malbaša, E. Lončar, M. Djurić, I. Došenović, Effect of sucrose concentration on the products of Kombucha fermentation on molasses, Food Chem. 108 (2008) 926–932,https://doi.org/10.1016/j.foodchem.2007.11.069.
[34] N. Turkmen, F. Sari, Y.S. Velioglu, Effects of extraction solvents on concentration and antioxidant activity of black and black mate tea polyphenols determined by ferrous tartrate and Folin-Ciocalteu methods, Food Chem. 99 (2006) 835–841,
https://doi.org/10.1016/j.foodchem.2005.08.034.
[35] S.C. Chu, C. Chen, Effects of origins and fermentation time on the antioxidant ac-tivities of kombucha, Food Chem. 98 (2006) 502–507,https://doi.org/10.1016/j. foodchem.2005.05.080.
[36] R. Jayabalan, S. Marimuthu, P. Thangaraj, M. Sathishkumar, A.R. Binupriya, K. Swaminathan, E.Y. Sei, Preservation of kombucha tea - Effect of temperature on tea components and free radical scavenging properties, J. Agric. Food Chem. 56 (2008) 9064–9071,https://doi.org/10.1021/jf8020893.
Conflict of interest statement
The authors declare that they have no conflict of interest. Acknowledgments
The authors thank the Mexican Council of Science and Technology (CONACYT- México) for funding the doctoral scholarship. In addition, they thank Sylvie Cazaux and Agathe Juppeau for their excellent technical assistance.