OATAO is an open access repository that collects the work of Toulouse
researchers and makes it freely available over the web where possible
Any correspondence concerning this service should be sent
to the repository administrator:
[email protected]
This is an author’s version published in:
https://oatao.univ-toulouse.fr/
26017
To cite this version:
Szczepanski, Mateusz and Malec, David and Maussion, Pascal and
Manfé, Philippe Design of Experiments predictive models as a tool for lifespan
prediction and comparison for enameled wires used in low voltage inverter-fed motors. (2020) IEEE Transactions on Industry Applications, 56 (3). 3100-3113.
ISSN 0093-9994.
Official URL:
https://doi.org/10.1109/TIA.2020.2970855
Design of Experiments (DoE) predictive models as a
tool for lifespan prediction and comparison for
enameled wires used in low voltage inverter-fed
motors
Mateusz Szczepanski, David Malec, Pascal Maussion
LAPLACE, Université de Toulouse, CNRS, INPT, UPS Toulouse, France [email protected] fr [email protected] fr [email protected] fr
Philippe Manfé
Nidec; Leroy-Somer Angoulême, France philippe.manfe@mail nidec.comAbstract — Since the development of power electronic components, which allowed the manufacturing of reliable and efficient inverters, variable speed drives using inductive motors have become more and more popular. The PWM technique has proven to be a very effective method of rotational speed control. However, the fast changing voltage pulses, with very steep slopes (in the order of a few kV/ s), has brought new hazards for the electrical insulation system of such motors. Very high frequency harmonic components of PWM voltage will result in significant overvoltage due to an impedance mismatch between the cable and the motor. As an effect, the voltage seen by some parts of the insulation system may exceed the Partial Discharge Inception Voltage (PDIV) stating localized partial discharges activity. The aim of this paper is to investigate and analyze the aging process of the enameled wire exposed to different factors and to propose a method allowing to predict their lifespans in given conditions. This study introduces a prediction based on the Design of Experiments method and the statistical Weibull distribution. Thanks to the model obtained with short multi-stress aging tests, it is possible to predict the results of significantly longer ones. Moreover, the adapted methodology is proposed that allows to predict the scatter of the long tests basing on the short-time results dispersion. The same approach is used to compare different products between each other and rank them. All model predictions are compared with the experimental data in order to prove the model accuracy.
Keywords — lifespan prediction; comparative method; design of experiments; accelerated aging; rotating machines; partial discharge; electrical insulation system; inverter-fed motors; PWM; Weibull distribution
I. INTRODUCTION
A. Form- and random-wound machines
The windings of the machines can be divided into two groups: form-wound or random-wound. [1]
Form windings use rectangular magnet wires. The position of each individual turn inside the slot is well controlled. As a result a turn-to-turn voltage stress as well as temperature distribution are more uniform compared to random-wound machines. Due to much higher cost, both of materials and labor, this type of winding is used almost only for high voltage or high power
(typically more than hundreds of kW) low voltage machines and thus will not be further discussed in this review.
Low voltage and/or low power machines are almost exclusively random-wound. The windings are made with insulated round copper conductors, called magnet wire. As their arrangement in the coil during skeining or insertion cannot be controlled, the winding is called random. As a result, wires from one turn can touch any other turn and therefore the maximum turn-to-turn voltage can be significantly higher than for form-wound machines. In the worst-case scenario the beginning and the end of the winding can be adjacent. According to some studies [2] the probability of such a situation can be higher than 90%. Moreover, this type of winding is much more vulnerable to mechanical damages due to vibrations or loose wire. Further problems can be caused by uneven resin build-up, non-uniform temperature distribution or higher accumulation of moisture and contaminates due to unsteady air circulation.
Fig. 1. Cross-section of a slot: form winding (left) and random winding (right) [1]
B. Electrical insulation system of low voltage motors
Electrical insulation system is an insulating structure containing one or more insulating materials together with associated conducting parts employed in an electrotechnical device [3]. The IEC standard [4] divides the electrical insulation systems used in electric machines into 2 main categories, called type I and type II. The type I system consists in the materials that are not expected to experience any partial discharges (PDs) activity within specified conditions in their service lives. It is generally used in random-wound low voltage machines (rated
voltage 700 VRMS) and is based almost uniquely on organic polymer materials. By contrast, systems expected to withstand PDs in any part of the insulation throughout their service lives, are classified as type II [5]. These systems are usually used in form-wound high voltage machines and use both the organic polymer materials and inorganic materials. In this review we concentrate only on type I electrical insulation system in random-wound machines.
Insulating components in low voltage machines can be divided according to their function into the following groups [6]:
Phase-to-ground insulation Phase-to-phase insulation Turn-to-turn insulation
Impregnating varnish or potting resin
The first three components are often called primary or major insulation, as opposed to impregnating liquid, which is a secondary insulation. The overview of the components of a low-voltage insulation system is shown in Fig. 2.
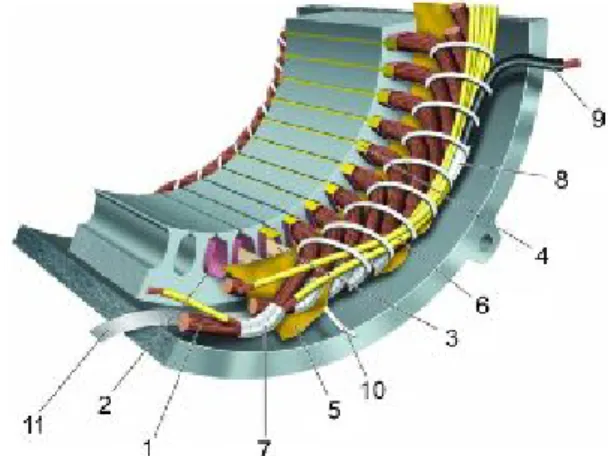
Fig. 2. Overview of materials in a low-voltage insulation system: 1 turn insulation, 2 slot liner, 3 slot separator, 4 wedge, 5 phase separator, 6 lead
sleeving, 7 coil-nose tape, 8 connection tape, 9 cable, 10 tie cord and 11 bracing. [7]
The phase-to-ground insulation prevents the winding coils from touching the stator core. Each slot of the stator is lined with a slot liner made most commonly of so-called insulating “paper”, such as aramid paper (well-known under its Dupont trade name NomexTM), polyester film (known as MylarTM) or polyester fleece (known as DacronTM). Generally, they present high breakdown strength, good mechanical properties, such as tear resistance and they resist well to chemical attack. The choice of the insulating material is often defined by the thermal class of the machine. The slot liners are available in wide range of thicknesses, depending of their voltage class [6] [7].
The phase-to-phase insulation prevents the any two coils of different phases from touching one-another. At the end winding the coils are separated by the phase separators. For those winding configurations with two different phases in the slots, their coil are separated by the slot separators. For phase-to-phase insulation, the same materials are used as for the phase-to-ground insulation. The insulators are typically slightly thicker due to higher voltage that they need to support.
In order to further improve the properties of the insulating papers they can be piled together into flexible laminates. These laminates are best known under their trade names, e.g. NMN (Nomex/Mylar/Nomex) or DMD (Dacron/Mylar/Dacron). The role of turn-to-turn insulation is to electrically separate the turns of the same coil from each other. In low voltage machines this insulation consists in the thin enamel layer on the copper wire. For each diameter of a magnet wire there are several enamel thicknesses available, called grades. Typically grades 1 or 2 are used (higher grade= thicker enamel), but higher grades (up to 9 [8]) are commercially available. All the wire dimensions are standardized in [9] or [10].
Polymer materials are easily eroded by a partial discharges activity. The enamel of conventional wires is also highly vulnerable to PDs. On the other hand, inorganic materials can withstand a partial discharges activity for a long time, but are hard to process and thus expensive. Magnet wire manufacturer desired to combine the advantages of those two groups of materials. As a result, composite materials were developed, where the micro- or nano- inorganic particles, such as TiO2, SiO2 or Al2O3, are dispersed in the polymer matrix. The wires enameled with such composites are often referred to as “corona resistant”. Although they are not completely resistant to a PD activity, they have significantly higher breakdown strength and lifespan in a partial discharges regime than the conventional wires [11]. The impregnation serves in the machines as a secondary insulation. Naturally it strengthens the primary insulation, but also improves heat transfer (better thermal conductor than the air) as well as mechanically blocks the winding and protects it toward vibrations and environmental conditions. Usually the low-voltage machines are dip or trickle impregnated. Due to high slot fill factor the varnish cannot easily penetrate in-between the wires and often multiple air voids can be found inside the slots or at the coil outhangs. There are techniques allowing better covering of the winding, such as VPI (vacuum-pressure impregnation) of potting, but are still rarely used for low-voltage machines.
C. Partial discharges in low voltage motors
A partial discharge (PD) is an electric discharge that only partially bridges the insulation between two conductors [3]. In low-voltage machines powered directly from the grid, the voltage seen by any part of the insulation system is lower than the minimum required in order to start a partial discharges activity, called partial discharge inception voltage (PDIV). Thus the problem of partial discharges was associated only with high voltage machines. Since the introduction of power electronic inverters the stress seen by the insulation system has raised significantly. Very short surges produced by such sources creates voltage transients having very short rise times (as short as a fraction of s), which can result in a partial discharges activity. High dV/dt of the slope is a source of very high frequency harmonics in the FFT spectrum of a PWM signal. The input impedance of the machine is usually significantly larger than the characteristic impedance of the cable connecting the inverter and the motor, especially for smaller machines. This impedance mismatch, completely negligible for low frequency harmonics (associated with fundamental frequency and its
harmonics), is the reason for a significant increase of the peak voltage at the motor terminals.
Fig. 3 shows how the overvoltage at the machine terminals is influenced by the impulse rise time and the length of the cable between the inverter and the motor. Generally speaking the longer the cable and the smaller the rise time, the higher the overvoltage factor (defined as the ratio between the peak voltage at motor terminals and at the inverter output). The introduction of new wide-bandgap semiconductors based on silicon carbide (SiC), gallium nitride (GaN) or diamond, which will further reduce the rise time, will result in even higher stress applied to machine insulation system. More recent studies [12] show that the overvoltage factor can exceed 2 in case of unfavorable superposition of overvoltages at the inverter output or of the resonance for certain harmonics of the PWM signal.
Fig. 3. Overvoltage at the motor terminals as a function of cable length for different risetimes [13]
If this voltage exceeds the PD inception voltage, the activity of partial discharges will start causing very accelerated aging As a result of these pre-mature breakdowns the lifespan of inverter-fed machines is still unsatisfactory. [14][16]. When a very steep impulse voltage is applied to a stator winding, the voltage distribution is nonlinear, contrary to equal distribution at power frequency (i.e. 50 or 60 Hz). As a result, a much greater percentage of the voltage appear across the first turns. This non-uniformity occurs because the pulse voltage goes through the winding not instantaneously but at the speed given by = , where L is the lineic inductance and C the lineic capacitance. Consequently, first turns are energized before the others and a very high voltage appears across the turn insulation in the first few turns of the winding. [6]
Fig. 4 shows the voltage waveform for 6 different parts of the coil of the same phase. E is a voltage at the phase terminal, V1
after the first of the turns in this coil, V2 after the following ,
etc. The resulting turn-to-turn voltages confirms that the electric stress across the first few turns is significantly higher than for the rest of the coil. As a result, the thin enamel layer is particularly endangered by inverter powering and is often the weakest link leading to machines’ breakdown. [5]
Fig. 4. Transient voltage waveforms at the different parts of the coils (left) and the resulting turn-to-turn voltage calculated between these parts [15]
II. THE DESIGN OF EXPERIMENTS (DOE) METHOD
A. General information
Most commonly used test methods change only one factor, while other are kept constant (so called One Factor At Time, or OFAT). If it is needed to test the influence of several factors, the test must be repeated for each factor separately. The Design of Experiments (DoE), first introduced by R.A. Fisher in 1935 [17], uses a different approach. At the same time, all factors do have a significant role and all of them might be changed from one experimental point to the other. Interaction may exist between factors, consequently the effect of two (or more) combined factors may be larger, or smaller, than the sum of the two (or more) effects taken separately. The DoE method can take into account these interactions between the factors. Thanks to this approach, we can significantly reduce the number of the experiments and at the same time increase the analysis accuracy as well as draw more persistent conclusions from the test campaign. The DoE is thus a very efficient method to organize the experiments allowing to process optimization or model estimation. The method has already proven its potency in many different fields of electrical engineering ([18]-[21]) also for modeling the insulation lifespan ([22]-[25]). DoE is a very cost-effective and efficient approach, as it allows to strictly limit the number of needed experiments.
B. DoE model construction
The DoE model (1) describes the relationship between the system response Y and levels of factors Xi influencing it. The
effect of each of those factors and the interactions between them is denoted by the coefficients in a vector E.
E X Y
This relation needs to be linear or linearized, like in the case of all the factors studied here. It is described in section V. The coefficients in the “effect” vector E must be calculated, based on the experimental data of system responses Y. If [X] is square matrix, by the simple modification of the above equation, one gets (2).
Y X
E 1
A design, in which all combinations of factors are investigated in each replicate of the experiment, is called a full factorial design or full factorial experiment. It is the only means to completely and systematically study interactions between factors in addition to identifying significant factors [26]. The most widely used parametrical model is based on 2 levels of
each factor. In case of k factors the model requires 2k parameters
and thus 2k experimental points [27]. In order to be able to compare the influence of different factors between each other, the “direct” factor are replaced by dimensionless factor levels, normalized to the range [-1,1]. Level “+1” is assigned to the maximum level of factor, while “-1” to the minimum. For the DoE with 2 factors, X becomes a matrix of 22×22 elements, while
Y the vector of 22 elements, as shown in (3).
AB B A I E E M Y Y Y Y 1 1 1 1 1 1 1 1 1 1 1 1 1 1 1 1 4 3 2 1
As it can be seen above, the construction of the model depending on 2 factors and their interaction requires 4 experiments in order to determine the system responses Y1 to Y8.
The first column of matrix X refers to the mean value of all the system responses M. The second and third column refer to the levels of factors, respectively EA and EB. The last column is the
multiplication of second and third column and denotes the level of factors interaction IAB. Analogically, in case of the DoE with
3 factors, X is a matrix of 23×23 elements, as shown in (4).
ABC BC AC AB C B A I I I I E E E M Y Y Y Y Y Y Y Y 1 1 1 1 1 1 1 1 1 1 1 1 1 1 1 1 1 1 1 1 1 1 1 1 1 1 1 1 1 1 1 1 1 1 1 1 1 1 1 1 1 1 1 1 1 1 1 1 1 1 1 1 1 1 1 1 1 1 1 1 1 1 1 1 8 7 6 5 4 3 2 1
Similarly to 2 factors models, here the first column of X refers to the mean value of all the system responses M. Next 3 columns describe levels of factors A - C. Columns 5 to 7 describe the interaction between 2 of the factors, respectively AB, AC and BC and their level X is a simple multiplication of corresponding factors levels. Last column is the interaction of all 3 factors.
C. Model extrapolation
In its standard form, the model obtained by the DoE, as described in the previous paragraph, is valid only in the range defined by the minimum and maximum of each factor. This means that the reduced factor levels X should be in the range of [-1, 1]. The extrapolation of the model means that the reduced factor levels X need to exceed their natural validity range of natural [-1, 1]. In our case, the model is contracted for relatively high stress levels in order to assure that the needed experiments are as short as possible. It is particularly interesting to extrapolate the model towards longer lifespan. As a result, the chosen factor levels will be smaller than the model’s minimum “-1” (true for all factors, that decrease the system response, which is the case for all the factors studied in this paper). If we were to cover the whole range of operating conditions within one factorial design, the tests for very low stress levels would be far too time and energy consuming and costly, while those for very high stress level might be too short to give reliable results.
As it is necessary to control the stress parameter levels as precisely as possible, otherwise all the model experimental points would not be reliable, it might be necessary to use different test equipment for different tests thus adding additional source of results dispersion.
III. WEIBULL DISTRIBUTION AND SCATTER ANALYSIS
A. Weibull distribution
Among multiple statistical distribution functions, the normal (Gaussian) distribution is most commonly used. Due to the fact that it has a finite probability for negative values, which is physically impossible, normal distribution in not adapted to be used with electrical breakdown data. What is more, as a random variable (here: breakdown data) follows an extreme value distribution (such as Weibull distribution), so does the minimum. [28]. In this paper we used the two-parameter Weibull distribution. The cumulative density function for this distribution is shown in (5):
t t
F(, , ) 1 exp
Variable t denotes in the case of this paper a measured lifespan. The two parameters: and are, respectively, scale and shape parameter (both positive). The scale factor (called also a characteristic value represents the time for which the failure probability F is equal to 63.2%. It can be considered as an analogous to mean value of the normal distribution. is a shape parameter or slope and depends mostly on the dispersion of results (the higher is, the smaller the dispersion). Standard [29] gives detailed explanation of how to calculate those Weibull parameters, depending on the sample size.
B. Scatter of results and how to cope with it
Electrical breakdown, especially due to long aging, is a very complex phenomenon. It is influenced by many factors, some relatively easy to control, while others far more difficult or too expensive to precisely control. As a result, the results are often strongly dispersed. For very simplified models, where many technical details of the sample can be scrupulously verified, the scatter of results can be reduced. The disadvantage of those sample is that they might not be representative for the real object and the aging and breakdown mechanisms can be completely different from the final product. Generally speaking the more complex the sample is, the better it represent the final product but for the price of higher dispersion. For electrical insulation system faults in motors one can easily expect as much as ten-to-one difference between the lifespan of samples tested in the identical conditions [6].
Such a high results dispersion can significantly constrict the lifespan modeling and may bias the final conclusions. A standard DoE model enables only to predict characteristic value ( ), but cannot give any confidence bounds of such prediction. To enable the scatter prediction for the long-term experiments, it is only possible to base it on the scatter of the short-term results, that were used to obtain the DoE model. Same as in [30], the coefficient of variation (CV), called relative standard deviation (RSD), was chosen for this purpose. The coefficient of
variation is defined as the standard deviation divided by the characteristic value , defined in (6) for the Weibull distribution:
1 1 1 2 1 2 CV where 0 1
)
(
n
e
xx
ndx
The coefficient of variation is calculated for all of the DoE model experimental points. The average of all those CVs is then assumed to describe the scatter of long-term results.
IV. SAMPLES PREPARATION AND EXPERIMENT DESCRIPTION
A. Accelerated aging tests
An electric machine is typically designed to reach tens of years. Due to such a long time, the test are rarely performed under normal operating conditions, as they would be far too time- and energy-consuming. Taking into consideration all these difficulties, yet still the need to lead to product breakdown in order to better understand machine failure mode, the aging process needs to be somehow accelerated. In order to do so one or more aging parameters are modified so that the measured lifespan of the sample is shorter. Naturally the best compromise needs to be found between the reasonable diminution of tests duration and the reliable simulation of the real-life conditions. The methodology presented here enables to correctly predict the results of time-absorbing experiments yet keeps the necessary tests reasonably short.
B. Comparison of materials
The modeling and the prediction of the lifespan is only one of the concerns in the field of electrical insulation system. In the highly competitive market of electric machines, the primary products, such as magnet wires, insulating papers or varnishes are constantly modified and improved and their prices are also fluctuating. The machine manufacturers usually have a range of typically used insulating materials in the existing solutions. For different reasons it might be necessary to replace one product with the other, for example change the supplier of a magnet wire or the thickness of the insulating papers. As there can be significant differences between different batches of the same product, not to mention the differences between different suppliers, this can influence the final reliability of the machine. It is thus essential to regularly control the quality control of those primary products. As it is not possible to test the complete machine in its nominal conditions each and every time any of its components changes, a quick and reliable comparative test is needed in order to assure that the applied changes are for the better, not for worse.
C. Sample type
As stated in the introduction, the stress that needs to be withstand by the electrical insulation system of inverter-fed machines is significantly higher than with the sinusoidal power supply. The interturn insulation is particularly endangered by
fast changing pulses generated by the inverter. As the winding is rarely perfectly impregnated and the varnish layer can be missing is same places it is up to the thin enamel layer on the magnet wire to ensure the turn-to-turn insulation. Some FEM simulations [31] shows that the PDIV of the interturn insulation were the varnish has correctly penetrated in-between the wires, but with air voids present, can be as low as for the non-impregnated configuration. The same situation may arrive is case of a winding fault if the paper assuring the phase-to-ground or phase-to-phase insulation has slipped or is missing. In such a situation the last insulating layer is the enamel on the wire. For all the reasons mentioned above in this paper we concentrated on the evaluation of the enameled wire insulation.
Twister pair is the most commonly used sample to test the magnet wire quality. Its manufacturing is controlled by the standard [32], as it was primarily designed for testing the breakdown voltage. Thank to well-established manufacturing protocol, twisted pairs have quite good reproducibility. Moreover, it is advised as one of the sample types for turn-to-turn insulation tests in standard [4].
D. Corona-resistant magnet wire
Tests without partial discharge activity, in low voltage range, would be extremely time- and energy-consuming and thus it was necessary to perform the accelerated aging above the PDIV. In order to be able to obtain both the short- and long-term results it was not possible to use the conventional magnet wires, as their lifespan in the partial discharge regime the does not exceed few hours. However, as mentioned in the introduction; the wires covered with enamel with inorganic nano-fillers (e.g. SO2, ZnO, Al2O3,…), called corona-resistant, are far more resistant and can sustain the partial discharges activity for about 1000 times longer than the conventional ones. Thus, for this campaign of measurements a corona resistant wire was chosen. All information concerning the used magnet are presented in Table I.
TABLE I
PROPERTIES OF TESTED MAGNET WIRES
Parameter Magnet wire
A B C Conductor material Copper Conductor diameter 1.12 mm 0.8 mm 0.5 mm Conductor diameter tolerance 0.011 mm 0.008 mm 0.005 mm Enamel grade 2 Outer diameter of enameled wire Min. 1.185 mm Max. 1.217 mm Min. 0.856 mm Max. 0.884 mm Min. 0.545 mm Max. 0.566 mm Enamel thickness Min. 32 µm Max. 54 µm Min. 28µm Max. 46µm Min. 22 µm Max. 35µm Enamel material PEI (THEIC) (basecoat)
PAI (overcoat)
E. Description of the accelerated aging testbench
A special test bench was constructed in order to recreate the real-life stress submitted to the insulation of an inverter-fed machine. It allows to recreate inverter-type stress by delivering square waves of the desired amplitude, frequency and duty cycle. Depending on the chosen high voltage pulse generator it can deliver up to 1.75 kV (3.5 kV peak-to-peak) with the maximum switching frequency of 30 kHz, or even up to 3 kV with slightly lover frequency, max. 10 kHz. It allows to cover the whole range of switching frequencies typically used in the frequency inverters.
Accelerated aging tests usually demand a special test bench adapted to their special requirements. The most critical parameter is a long duration of test: in case of insulating materials for electrical machines those tests can last weeks, months or even years. We need to assure that all devices can function for such a long time without any stops or failures. The other, but equally important challenge, is to assure that the applied stress parameters will not change during the aging process. Assuring these two key factors may be particularly difficult as the aging processes, naturally far less rapid, will apply to all the components of a test bench: power supplies, cables, connectors, probes, detectors, heaters, fans, etc.
In order to recreate the real-life stress submitted to the insulation of an inverter-fed machine, a special test bench was constructed. It allows to deliver square waves of the desired amplitude, frequency and duty cycle, thus simulating the PWM waveform withstood by the insulation. Depending on the chosen high voltage pulse generator it can deliver up to 1.75 kV (3.5 kV peak-to-peak) with the maximum switching frequency of 30 kHz, or even up to 3 kV with slightly lover frequency, max. 10 kHz. This allows to cover the whole range of switching frequencies typically used in the frequency inverters.
Temperature is also an important factor influencing the aging process. To better control the experimental conditions, all the test were conducted inside a climate chamber to assure controlled ambient temperature during all tests. This is particularly important for the tests at very high stress level, where the partial discharge activity can significantly increase the temperature of the samples. This would result to shorter lifespan due to local overheating of the enamel. As ozone generated during PD activity can also influence the lifespan [35] the climate chamber needs to be strongly ventilated.
The automatic system of failure detection allowed to assure stable conditions thanks to the possibility of performing experiments on multiple samples without stopping the test. The lifespan was measured automatically for each sample with the accuracy of 1 s. The end of life was stated when the mean DC current flowing through the sample exceeded 100 mA. Such sample was considered as short-circuited and automatically disconnected from the powering source.
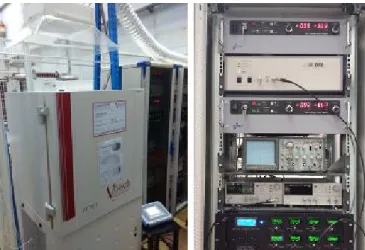
Fig. 5. The automatized test bench for the accelerated aging tests: climate chamber (left) and high voltage pulse generator with the lifespan counters
(right)
F. Description of the experimental conditions
As mentioned before the tests need to be performed in the partial discharge regime. For the purpose of model creation, the parameters were chosen so that the lifespan of samples was in the order of few hours, which is sufficiently short to reasonably shorten the tests duration. The points used to verify the predictions made thanks to model extrapolation had significantly longer lifespan, in the order of hundreds of hours. In each series up to 8 samples were tested in order to be able to perform a statistical analysis of the experimental data.
Table II presents the experimental conditions for the tests for the DoE model. The chosen parameters allowed to keep the experiments short, yet still providing the necessary interval between the results achieved for the different tests of the DoE matrix. All 3 magnet wires A-C were tested in exactly the same conditions.
TABLE II
TEST CONDITIONS FOR DOE MODEL CONSTRUCTION
Parameter Minimum level
(-1) Maximum level (+1) Voltage amplitude [kV] 2 00 (±0 01) 2 25 (±0 01) Frequency [kHz] 5 0000 (±0 0001) 10 0000 (±0 0001) Temperature [ºC] 30 0 (±0 1) 100 0 (±0 1)
*The duty cycle was set to 50% (±0 5%)
G. Flowchart of the methodology
Fig. 6 shows the flowchart explaining how the methodology presented in this article can applied.
Fig. 6. Flowchart showing the methodology of short-time modeling and long-time prediction
V. EXPERIMENTAL RESULTS
A. Model linearization
The DoE method requires that the relation between system response Y (a function of the lifespan) and the factor level (a function of the stress amplitude) is linear. The most commonly used model describing the effect of the electric stress on the lifespan of the insulation in the presence of partial discharge is an inverse power model [6][33][34] where lifespan L is proportional to field strength E to the power of –n. Thus the relation between the lifespan and voltage amplitude is linear in log-log plot [22][25]. In order to confirm this fact, the linearity of the model was tested in much larger range and for several measurement points. The results are shown in Fig. 7.
Fig. 7. The experimental verification of the linearity of the function between the lifespan and the voltage in log-log plot
(other parameters are constant: f = 10 kHz, T = 30 C)
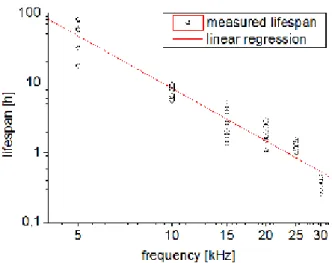
The relation between the lifespan and the switching frequency is not linear. The studies [22][25] have shown that this function has the same nature as the one for the voltage amplitude, so the inverse power law. Results are in Fig. 7Fig. 8.
Fig. 8. The experimental verification of the linearity of the function between the lifespan and the frequency in log-log plot
(other parameters are constant: V = 1.75 kV, T = 30 C)
It is intuitive to say that the relation between the lifespan and the switching frequency is inversely proportional. If one assumed that each pulse generates the same number of PD of the same energy and that the lifespan in inversely proportional to the number of PDs (i.e. a number of PDs to breakdown is constant), this would indeed mean that L ~ 1/f. In logL – logf plot this relation is still a straight line, with the slope (exponent in the inverse power law) equal to -1. In other words doubling the switching frequency would mean cutting lifespan in half. As it can be seen in Fig. 8 the slope of the lifespan line is much more steep: doubling the frequency results in the lifespan more than 5 times shorter. This can mean that PD become more detrimental as the frequency increases. If we assumed that the energy of PD at every pulse is the same (independent of frequency), it would mean that the same quantity of energy needs to be dissipated in shorter time, as the frequency (this the repetition rate of PDs) is increased. As a result, the effects of PDs would accumulate the lifespan decrease faster than 1/f.
As the influence of frequency on the partial discharge activity and the aging process is still the object of multiple research, the chosen here inverse power law seems to be the best compromise between the simplicity of the model and its accuracy. The most commonly used model describing the effect of temperature on the lifespan of the insulation is based on the Arrhenius law, as presented in equation (7), [6][33][34]:
= A
where A and B are constants and T denotes absolute temperature [K]. This equation becomes linear in log(L)-reciprocal(T) plot. (see Fig. 9). The obtained results show that the relationship between the lifespan and the stress level can be linearized for the large range of lifespan (2-3 orders of magnitude). This means that short tests may enable to predict the results of long ones.
% 4 . 24
CV
In order to verify whether the predictions of lifespan made using the short-time DoE model are correct and if the scatter prediction is effective, several long-time experiments were achieved. In those experiments, the level of at least one aging factor, typically voltage amplitude, was significantly lower the natural validity range of DoE model, i.e. [-1, +1]. The other factor in some cases was higher than the +1 maximum in order to accelerate the test. Finally, factor levels were calculated using (9) and (10).
TABLE VI
EXPERIMENTAL POINTS USED TO VERIFY THE PREDICTIONS
Test Voltage amplitude Voltage level Frequency Frequency level V XV f Xf [kV] [-] [kHz] [-] A 1 50 -5 88 10 000 1 00 B 1 50 -5 88 5 000 -1 00 C 1 36 -7 55 14 569 2 09 D 1 32 -8 06 12 487 1 64 E 1 09 -11 31 10 752 1 21 F 1 08 -11 46 12 691 1 69 G* 1 10 -11 15 8 914 0 67
*test G was not performed in the climate chamber but in a laboratory oven without the possibility of cooling; due to lack of ventilation, the temperature was not as stable as for the other tests.
All those tests, except the last one (G*), were performed in the climate chamber where the temperature was kept constant at 30°C (±2ºC). Thanks to high ventilation, the influence of the local overheating of insulation due to partial discharge activity as well as ozone concentration on the test results was minimized. The last measurement, noted as G* was on purpose not performed inside the climate chamber but in a laboratory oven without the possibility of cooling by ventilation. It was done so in order to verify whether at this relatively low stress level the temperature will be stable only thanks to heat dissipation losses. No significant increase of average temperature inside the oven was noted due to this test, however the fluctuations of temperature were higher than for climate chamber (±2ºC in the oven in comparison to ±0.1 ºC in the climate chamber). It is however highly possible that locally, on the sample surface, the temperature was slightly higher. The additional heat generated locally was not high enough to change the temperature inside the oven, but were enough to bias the lifespan results. At the same time lack of ventilation caused the increase in ozone concentration which could also influence the experimental data [35]. For each of the experimental points A to G, the predicted lifespan was based only on the short-time 2-factor model extrapolation, where system response (Y=logL) was calculated according to (8). Following the hypothesis about the constant coefficient of variation (paragraph III), the standard divination was calculated as (14).
CV
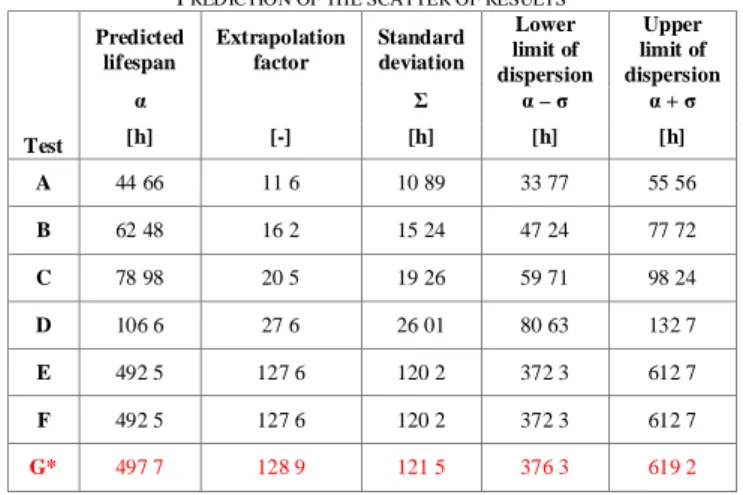
The calculated standard deviations were used to estimate the scatted of the results for the predicted lifespan values. Upper and lower limits of dispersions, here defined as + and - respectively, were also calculated. The calculated standard deviations were used to estimate the scatted of the results for the predicted lifespan values. The results are presented in Table VII. For each experimental point A to G, the extrapolation factor was presented in order to show how much longer the predicted lifespan is in comparison to the average lifespan of short-time model.
TABLE VII
PREDICTION OF THE SCATTER OF RESULTS
Test Predicted lifespan Extrapolation factor Standard deviation Lower limit of dispersion Upper limit of dispersion – + [h] [-] [h] [h] [h] A 44 66 11 6 10 89 33 77 55 56 B 62 48 16 2 15 24 47 24 77 72 C 78 98 20 5 19 26 59 71 98 24 D 106 6 27 6 26 01 80 63 132 7 E 492 5 127 6 120 2 372 3 612 7 F 492 5 127 6 120 2 372 3 612 7 G* 497 7 128 9 121 5 376 3 619 2
Finally, the results predicted by the model were compared with the experimental ones.
Fig. 12 The comparison between the model predictions and the real experimental data.
For all the seven experimental points A-G, the long-time aging tests were performed. In each test, up to eight samples were tested at the same time. All those results were then presented in Fig. 12. Axis of abscissa represents the modeled lifespan (from the learning set), thus the one calculated in Table VII, while axis of ordinates shows the measured lifespan, thus
the experimental data from the long-time measurements (test set). The diagonal, marked in red shows the DoE model line. The dash line below and above it, are the lower and upper limits of the predicted dispersion of results, based on the hypothesis of a constant CV. The experimental points used for the DoE model construction are marked in blue in the left bottom corner of the graph. These points show how far are the long-time measurements from the short-time experiments which have been used to create the DoE model. The obtained results show that the proposed method is a very efficient tool for predicting much longer lifespan. The maximum relative error is 33% (excluding series G), which is similar the results obtained is some much more short-term studies [22][25]. Taking into consideration that the analyzed stress levels are far from the range used to construct the model, with the extrapolation factor even higher than 100 for the longest tests, the accuracy of the outcome is even more impressive. The suggested methodology of including the scatter of the results has proven to be effective. The spans of the dispersion intervals of the test sets are close to the ones predicted by the model. Naturally not all the experimental points are included in the predicted triangle of dispersion, but always some experimental points are within this zone (excluding series G).
In case of the G series, the error of prediction is visibly more important. All the experimental points had the lifespans shorter than model predictions, and none of them were in the zone predicted by the scatter analysis. As for this series the experiment was not conducted inside the climate chamber but in a laboratory oven, the temperature of enamel might have been locally slightly higher due to absence of ventilation. This temperature rise, undetectable at the scale of the oven (temperature sensor measures the average temperature inside the oven), might have been the cause of the lifespan shortening. Also the higher ozone concentration, due to no ventilation, has probably contributed to shorter lifespans [35]. These results show that even in the case of such a long test (predicted lifespan >400h) the temperature must be rigorously kept constant as well as assuring a sufficient ventilation in order to assure the reliable results of accelerated aging tests.
In conclusion, the Design of Experiments (DoE) method proved to be effective even for the extrapolation of the model far from its initial range of validity. This shows that, based only on short-time results, it is possible to effectively predict both the lifespan value and scatter of results for the lifespans, tens of times longer than the duration of the needed experiments. This obviously means that the method is not only time- but also money-saving. The extrapolation permits also to approach much closer the nominal conditions of the machines exploitation.
E. Extrapolation limits
Naturally the model presented in the paper cannot be extrapolated without any limits. The aging mechanism must be at least similar for both short- and long-time results in order for the prediction to be corrects. Thus the extrapolation must be limited to the reasonable range of stress levels. We can apply simple mathematical consideration. In case of all the factors
studied here we can assume that an increase in stress level should always decrease (or at least never increase) the lifespan of the samples. For all the factors, the response of the system Y should decrease when the factor level Xi is increasing
(otherwise it would mean that an increased voltage or a higher frequency can prolong the insulation lifespan, which is not the case). Thus the partial derivatives of the model equation ( Y/ Xi) should be negative. As a result of such approach the
obtained stress limits are very low, thus cannot be taken into consideration due to aging mechanism changes, as explained before. On the other hand, they show that the method is mathematically stable for a very wide range of stress levels.
Some lifespan models (e.g. [36][37][38]) postulate the existence of a threshold level, below which no aging takes place. This effect can be neglected if we are far enough from this threshold, but if we operate close to it the DoE method might not be well adapted in such a case. In the particular case of the voltage amplitude, the PDIV level for example can be considered as a threshold. On the other hand, there are very few studies describing the influence of voltage without partial discharges activity on the lifespan of insulation systems. However, it is well known that the aging mechanism with and without partial discharges is not the same, thus the PDIV level creates the natural barrier for model extrapolation.
F. Long-term comparisons based on short-term DoE models
By applying the same technique of extrapolation as for the wire A we can compare the performance of wires A-C. Two points of different voltage amplitude and frequency were chosen to compare the DoE models predictions for all 3 wires with experimental values.
TABLE VII
EXPERIMENTAL POINTS USED TO COMPARE THE WIRES
Test Voltage amplitude Voltage level Frequency Frequency level V XV f Xf [kV] [-] [kHz] [-] I 1 32 -8 06 12 487 1 64 II 1 23 -9 25 7 153 0 03
Test voltage for each test (I-II) was significantly lower than those used for the construction of the DoE model, with corresponding voltage level XV largely exceeding the natural
validity range of DoE of [-1, 1]. Similarly to model for wire A we used the assumption of constant CV in order to predict the dispersion of the extrapolated results. Table VIII shows the average coefficients of variation for each of the 3 wires (A-C). Fig. 13 shows the comparison between the model predictions (in blue) and the experimental results (in red) for 3 magnet wires A-C tested at the above-mentioned test conditions (see Table VII). Confidence intervals are presented as a line where bottom bar denotes – , upper + and middle one
characteristic lifespan . The values for test parameters I are shown in solid lines, for test II in dotted lines.
TABLE VIII
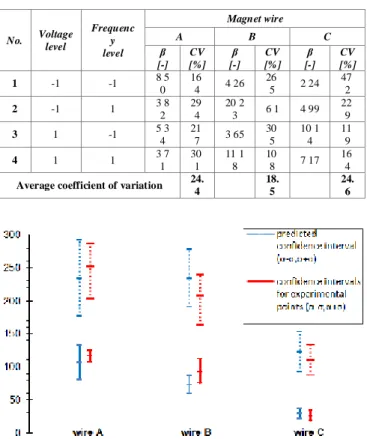
COEFFICIENTS OF VARIATION FOR WIRES A-C
No. Voltage level Frequenc y level Magnet wire A B C [-] CV [%] [-] CV [% ] [-] CV [%] 1 -1 -1 8 5 0 16 4 4 26 26 5 2 24 47 2 2 -1 1 3 8 2 29 4 20 2 3 6 1 4 99 22 9 3 1 -1 5 3 4 21 7 3 65 30 5 10 1 4 11 9 4 1 1 3 7 1 30 1 11 1 8 10 8 7 17 16 4
Average coefficient of variation 24.
4
18. 5
24. 6
Fig. 13 Comparison between the model predictions and the real experimental data for wires A-C at given stress level (see Table VII); test I – solid line; test II – dotted line
As presented in Fig. 13, the predicted model intervals always intersect with the experimental data. Relative errors of the prediction of the mean values are similar to those obtained with short-time tests within the DoE domain of validity. Both for points in test I and test II the difference between the wire A and B is not statistically significant as the model predictions overlap, i.e. the bottom confidence bound of the prediction for wire A is below the upper confidence bound for wire B. This statement is true also for the experimental values obtained for those 2 wires: we are not able to conclude than the wire A is ‘stronger’ than the wire B. However, for both test I and test II the wire C stands out as the ‘weakest’ of 3 tested wires. It is statistically significant for both model predictions and experimental values.
VI. CONCLUSIONS AND PERSPECTIVES
As already shown in several publications on this topic, the DoE proved its usefulness in the field of modeling accelerated aging of different insulating materials. However, up to now, almost only short-time models were presented for which the stress levels have been significantly higher than those that might be seen by the insulation system during normal operating conditions in order to accelerate the test.
The results presented in this paper show that DoE models can be successfully extrapolated towards much lower stress levels and that they give satisfyingly accurate predictions of much longer test results. Thanks to the original methodology proposed for the scatter of short-time results, the DoE model extrapolation was enriched with the prediction of the dispersion of long-time results. The predicted lifespans correspond well with the experimental data, especially if we take into consideration that the short DoE tests were even more than 100 times shorter than the predictions.
Finally, the DoE short-time models can be used as a comparative tool for different products available on the market. Thanks to the proposed methodology it was possible to rank the products regarding their lifespan, from the best to the worst, using only a quick test campaign. This classification was confirmed by long-time predictions and correlated well with the experimentally obtain results for those points.
The study presented here was based entirely on the enameled wires and their insulation. Future work will be directed towards wider range of insulating materials in order to be able to study the aging of the insulating systems of low voltage machines as a whole. It will enable to analyze the behavior of each element of insulating system but also the interactions between them. As presented in this paper the use of the Design of Experiments (DoE) method can be an effective tool in lifespan modeling as well as its prediction. Further work will verify if the same methodology as presented here can be applied to other than insulating material domains, such as LEDs, OLEDs or fuel cells.
ACKNOWLEDGMENT
The authors would like to thank both Nidec-Leroy Somer and the ANRT (French Agency for Research and Technology) for their financial contribution to this research.
REFERENCES
[1] Kato Engineering Inc.: Engineering Report: Form-Wound Coils, Random-Wound Coils, 2001.
[2] V. Mihaila, S. Duchesne, D. Roger, P. Y. Liegeois: Prediction of the turn-to-turn voltages in parallel connected wires configuration for motor coils fed by steep fronted pulses, 2011 Electrical Insulation Conference, Annapolis, Maryland, 2011
[3] IEC 60050-212:2010 International Electrotechnical Vocabulary – Part 212: Electrical insulating solids, liquids and gases, 2010.
[4] IEC 60034-18-41:2014 Rotating electrical machines - Part 18-41: Partial discharge free electrical insulation systems (Type I) used in rotating electrical machines fed from voltage converters - Qualification and quality control tests
[5] IEC 60034-18-42:2017 Rotating electrical machines - Part 18-42: Partial discharge resistant electrical insulation systems (Type II) used in rotating electrical machines fed from voltage converters - Qualification tests, 2017.
[6] G. C. Stone, E. A. Boulter, I. Culbert, H. Dhirani, Electrical Insulation for Rotating Machines. Design, Evaluation, Aging, Testing, and Repair. Wiley-Interscience, 2004
[7] Chapman M., Frost N., Bruetsch R.: Insulation Systems for Rotating Low-Voltage Machines, 2008 IEEE International Symposium on Electrical Insulation, 2008, pp. 257-260.
[8] IEC 60317-0-7:2017 Specifications for particular types of winding wires - Part 0-7 : general requirements - Fully insulated (FIW) zero-defect enamelled round copper wire, 2017
[9] IEC 60317-0-1:2013 Specifications for particular types of winding wires – Part 0-1: General requirements – Enamelled round copper wire, 2013 [10] NEMA MW 1000-2016, Magnet Wire, National Electrical Manufacturers
Association standard, 2016
[11] Ple a I., No ingher P. V., Schlögl S., Sumereder C., Muhr M.: Proprieties of Polymer Composites Used in High-Voltage Applications, Polymers 2016, vol. 8, issue 5, 173, 2016.
[12] Taghia B., Cougo B., Piquet H., Malec D., Belinger A., Carayon J.-P.: Advanced Analysis of Transient Overvoltage in Electromechanical Chain Fed by SiC Inverter, Electrimacs, 2017.
[13] Feldmeier G, Dan Kupersmith. Applying dV/dT filters with AFDs, Application Paper AP043001EN, September 2014
[14] Persson E.: Transient Effects in Application of PWM Inverters to Induction Motors, IEEE Transactions on Industry Applications, vol. 28, no. 5, 1992.
[15] Bidan P , Lebey T, Neacsu C.: Development of a New Off-line Test Procedure for Low Voltage Rotating Machines Fed by Adjustable Speed Drives (ASD), IEEE Transactions on Dielectrics and Electrical Insulation, vol. 10, no. 1, 2003.
[16] F. Guastavino, F. Porcile, A. Ratto, D.Cordano, G. Secondo, Electrical aging test and repetitive partial discharge inception voltage on random wire wound winding insulation, 2014 IEEE Conference on Electrical Insulation and Dielectric Phenomena (CEIDP), 19-22 Oct. 2014 [17] R.A. Fisher, The Design of Experiments, Olivier and Boyd, Edinburgh,
1935
[18] Zhu X., Yan B., Chen L., Zhang R., Quan L., Mo L.: Multi-Objective Optimization Design of a Magnetic Planetary Geared Permanent Magnet Brushless Machine by Combined Design of Experiments and Response Surface Methods, IEEE Transactions on Magnetics, vol. 50 no. 11, seq. no. 8204004, 2014.
[19] Fragomeni J. M.: An Organizational Design of Experiments. Statistical Apporach to Investigate the Effect of Extrusion Process Manufacturing on the Mechanical Behavior of an Aluminum Alloy, International Conference on Engineering and Technology Management, IEMC '98, pp. 11-14, 1998.
[20] Silva Nunes Jr. M. A., Clé de Oliveira T., Carvalho Filho J. M., Gonçalves de Abreu J. P.: Design of Experiments for Sensitivity Analysis of Voltage Sags Variables, IEEE 15th International Conference on Harmonics and Quality of Power, pp. 398-402, 2012.
[21] Zernig A , Bluder O., Spöck G.: Optimal design of experiments for semiconductor lifetime data, 9th Conference on Ph.D. Research in Microelectronics and Electronics (PRIME), pp. 285-288, 2013. [22] N. Lahoud, J. Faucher, D. Malec, P. Maussion, Electrical aging of the
insulation of low-voltage machines: model definition and test with the design of experiments, IEEE Transactions on Industrial Electronics, vol. 60, no.9, September 2013
[23] Y. Khelil, P. Maussion, T. Lebey, Experimental design for tracking the influent operating parameters on insulation reliability, 2009 IEEE International Symposium on Diagnostics for Electric Machines, Power Electronics and Drives
[24] F. Salameh, A. Picot, M. Chabert, E. Leconte, A. Ruiz-Gazen, P. Maussion, Variable importance assessment in lifespan models of insulation materials: a comparative study, 2015 IEEE 10th International Symposium on Diagnostics for Electrical Machines, Power Electronics and Drives
[25] F. Salameh, A. Picot, M. Chabert, P. Maussion, Parametric and Nonparametric Models for Lifespan Modeling of insulation Systems in Electrical Machines, IEEE Transactions on Industry Applications, vol. 53 (3), pp. 3119-3128, 2017
[26] ReliaSoft Corporation: Experiment Design & Analysis Reference, Tucson, 2018.
[27] Khuri A. I., Cornell J. A.: Response surfaces: designs and analyses, CRC press, 1996.
[28] W. Weibull, A statistical distribution function of wide applicability, J. Appl. Mech. – Trans. ASME, 18 (3): 293-297, 1951
[29] IEC 62539 IEEE 930, “Guide for the statistical analysis of electrical insulation breakdown data”, first edition 2007-07
[30] M. Szczepanski, D. Malec, P. Maussion, B. Petitgas, P. Manfé, Prediction of the lifespan of enameled wires used in low voltage inverter-fed motors by using the Design of Experiments (DoE), 2017 IEEE Industry Applications Society Annual Meeting, Cincinnati 2017
[31] L. Benmamas, Ph. Teste, G. Krebs, E. Odic1, F. Vangraefschepe, T. Hamiti: Contribution to Partial Discharge Analysis in Inverter-fed Motor Windings for Automotive Application, 2017 Electrical Insulation Conference (EIC), Baltimore, USA, 2017
[32] IEC 60851-5:2008 Winding wires – Test methods – Part 5: Electrical properties, 2008.
[33] Endicott H. S., Hatch B. D., Sohmen R. G.: Application of the Erying Model to Capacitor Aging Data, IEEE Trans. CP-12, pp. 34-40, March 1965.
[34] Montanari G. C., Simoni L.: Aging Phenomenology and Modeling, IEEE Transactions on Electricla Insulation, vol. 28 no. 5, pp. 755-776, October 1993.
[35] M. Szczepanski, D. Malec, P. Maussion, B. Petitgas, P. Manfé, Ozone concentration impact on the lifespan of enameled wires (conventional and corona-resistant) for low voltage rotating machines fed by inverters 2017 IEEE 35th Electrical Insulation Conference, Baltimore
[36] Simoni L , Mazzanti G , Montanari G. C. Lefebre L.: A general multi-stress life model for insulating materials with or without evidence for thresholds, IEEE Transactions on Electrical Insulation, vol. 28 no.3, pp. 349-364, June 1993.
[37] Montanari G. C., Mazzanti G., Fabiani D., Albertini M., Perego G.: Investigation of DC threshold of polyetylenes as a tool insulation characterization, Conference on Electrical Insulation and Dielectric Phenomena, vol. 2, pp. 559-563, 1999.
[38] Starr W. T., Steffen H.G.: Searching for threshold in voltage endurance, ICPADM, pp. 285-294, Xian, 1985.
[39] M. Szczepanski, D. Malec, P. Maussion, B. Petitgas, P. Manfé, Use of Design of Experiments (DoE) predictive models as a method of comparison of enameled wires used in low voltage inverter-fed motors, 2018 IEEE Industry Applications Society Annual Meeting, 2018
![Fig. 1. Cross-section of a slot: form winding (left) and random winding (right) [1]](https://thumb-eu.123doks.com/thumbv2/123doknet/2941829.79244/2.892.457.820.747.893/fig-cross-section-slot-winding-random-winding-right.webp)
![Fig. 3. Overvoltage at the motor terminals as a function of cable length for different risetimes [13]](https://thumb-eu.123doks.com/thumbv2/123doknet/2941829.79244/4.892.95.415.402.605/overvoltage-motor-terminals-function-cable-length-different-risetimes.webp)