an author's https://oatao.univ-toulouse.fr/26571
https://doi.org/10.23919/EuCAP48036.2020.9135692
Marhabaie, Sina and Takhedmit, Hakim and Poulichet, Patrick and Grzeskowiak, Marjorie and Fall, Abdoulaye A bird-cage coil for MRI studies of unsatureted granular materials. (2020) In: the 14th European Conference on Antennas and Propagation (EUCAP 2020), 15 March 2020 - 20 March 2020 (Copenhague, Denmark).
A Bird-Cage Coil for MRI Studies of Unsaturated
Granular Materials
Sina Marhbaie
∗Hakim Takhedmit
†, Patrick Poulichet
‡, Marjorie Grzeskowiak
§, Abdoulaye Fall
∗∗Laboratoire Navier (UMR 8205 CNRS, IFSTTAR, Ecole des Ponts ParisTech), Universit´e de Paris-Est, Champs-sur-Marne, France
sina.marhabaie@u-pem.fr, abdoulaye.fall@ifsttar.fr
†Universit´e de Paris-Est Marne-la-Valle, UPEMLV, ESYCOM, Marne-la-Vallee, France, hakim.takhedmit@u-pem.fr ‡Universit´e de Paris-Est Marne-la-Valle, UPEMLV, ESYCOM (FRE 2028), ESIEE-Paris, CNAM, Marne-la-Vallee, France
p.poulichet@esiee.fr
§ISAE-SUPAERO, Universit´e de Toulouse, Toulouse, France, grzeskow@univ-mlv.fr
Abstract—Magnetic Resonance Imaging (MRI) is a powerful and non-invasive technique that can be used to reveal useful information about different types of materials. During an MRI experiment a magnetic resonance signal is induced (according to Faraday’s law of induction) in a device called “probe”. MRI probes are simply near field antennas designed in a specific way in order to produce a homogeneous magnetic field at a specific frequency in the region of interest. MRI is a strong technique to study unsaturated granular materials. However, it suffers from a significant drawback, that is inherent small signal-to-noise ratio. To overcome this problem the probe used for a specific MRI experiment must be optimised. In this work a bird-cage probe operating at 21.3 MHz, optimised to study unsaturated granular materials under shear stress as well as some experimental results will be presented.
Index Terms—Magnetic Resonance Imaging, MRI, bird-cage coil, field homogeneity mapping.
I. INTRODUCTION
Nowadays, granular materials are almost omnipresent. They play an important role in chemical, pharmaceutical and agri-cultural industries as well in food and energy production [1]– [6]. In order to be able to control any industrial processes dealing with this type of materials, their specifications must be understood. In particular, the behavior of the liquid phase in wet granules is important. So far a lot of studies have been performed on saturated grain-fluid mixtures as well as dry granular materials [7]–[9], however different aspects of unsaturated granular assemblies still need to be addressed. The final aim of this work is to address microstructure of unsaturated granular materials with different liquid contents and under different flow regimes, using Magnetic Resonance Imaging (MRI).
MRI probes are the workhorses of all MRI experiments. They play an essential role in the quality of an image obtained by MRI. In clinical MRI lots of different probes with different size, shape and sensitivity exist, which enable the physician to optimise the experiment setup according to the patient’s anatomy. By choosing an appropriate probe for each experiment, the physicians can obtain images with better quality within a shorter experiment time. Unsaturated granular
materials contain only a few percent of liquid, that is a few percent of water, oil, or other materials that contain hydrogen atoms. Therefore, the magnetic resonance signal obtained from these materials in a typical experiment is very low. In such conditions, the same experiment has to be repeated several times in order to obtain acceptable signal-to-noise ratio (SNR). Needless to say, this requires a long experiment time. By op-timising the probe to the constraints imposed on this problem, we try to increase the SNR of our experiments, so that we can obtain good images within a reasonable experiment time.
II. MRIUNDER SHEAR STRESS
In order to be able to perform an MRI experiment in a sheared unsaturated granular material, a specific holder is required. An example of such a sample holder, called shear device is shown in Fig. 1. In this device the granular materials are loaded inside the sample cell. When the top rotating cylinder starts to rotate, it exerts a shear force parallel to the surface of the rotating cylinder. This causes a shear stress to the material under study. The whole setup is then placed in an MRI scanner enabling us to perform MRI experiments on materials under shear flow in order to measure simultaneously the velocity field, the solid concentration field, the liquid distribution and the local rheology of unsaturated granular materials. The scanner used in this study was 0.5 Tesla scanner (Magnex Scientific), working at 21.3 MHz with a Bruker console. In our former setup, the shear device was placed inside a large bird-cage coil shown in Fig. 1(c). Although the B1 homogeneity (the homogeneity of the alternating magnetic
field produced by the coil) of such a setup is very good due to the fact that the sample is far away from the rungs (legs) of the coil, the low sensitivity of such a setup significantly limits its applicability to unsaturated material. Simply because the signal is too small compared to the noise level.
After a preliminary study, a bird-cage coil was opted for further improvement of our setup [10]. Fig. 2 shows our modified setup, which has been built during this work. In the modified setup, instead of placing the whole shear device inside the probe, only the sample cell is placed in the active
(a) (b) (c)
Fig. 1. (a) The device we used to hold the sample, and to apply a shear stress on the material (shear device). (b) Schematic view from the interior of the shear device. (c) Shear device inside the former bird-cage probe. In the former setup the probe was outside of the shear device, and as a result the rungs of the coil were far away from sample.
region of the probe. Since the sample is much closer to the probe in the modified setup, the sensitivity of the modified setup is expected to be higher than in the previous setup.
III. SIMULATIONS ANDTHEORETICALCALCULATIONS
Bird-cage coils have been introduced long time ago. So far a lot theoretical and experimental works have been carried out on this subject. These coils can produce a homogeneous B1
field in a large volume. Therefore, they are extensively used in clinical MRI as whole body excitation coils. They are usually modeled as a network of identical low-pass, high-pass or band-pass filters that are all coupled. Calculating the exact value of the resonance frequency of a bird-cage coil is not a straight forward task. In this work, a good estimate of the required capacitor value was obtained by using a user friendly mobile phone application ”BBuilser” [11], and more accurate results was obtained by the HFSS package from ANSYS Inc. Using HFSS the dimensions of the rungs, and the capacitor values have been changed to obtain a resonance frequency around 21.3 MHz. HFSS is also able to calculate the B1 field, and
can produce a B1map of a coil. A typical model constructed
for HFSS simulations, and a typical calculated field maps (H1
map) are shown in Fig. 3.
IV. REALISATION OF THEPROBE
A. Coil Body Realisation
After calculating the required dimensions, a comb-shaped piece of copper were cut (out of a rectangular copper sheet with a thickness of 0.8 mm) by using a standard CNC (Computer Numerical Control) machine. By rolling this comb-shaped piece of copper the upper part of the coil were realised. The construction of the probe were completed by rolling a long copper tape (with a thickness of 0.8 mm) to form the bottom ring, and by soldering a 220 pF ceramic capacitor to each rung.
B. Realisation of the RF Shield
A piece of plastic sheet was rolled to form a cylinder which serves as a support. Then four rectangular copper sheets (with a thickness of 0.3 mm) were rolled, and glued by using a strong double sided scotch tape to the interior wall of the cylinder. Each sheet covers a quarter of the total interior surface of the cylinder. Each pair of individual sections were then bridged by soldering thirty 1nF capacitors, which are shown in yellow in Fig. 3(a). By choosing a large value for the bridging capacitors (1 nF), the shield acts like a continuous metallic cylinder at 21.3 MHz. However it performs as an open loop at low frequencies. Such a sectioned design prevents circulation of low-frequency eddy currents [12] that can be otherwise induced due to mutual coupling of the RF shield and the gradient coils of the scanner.
C. Tuning and Matching
The coil was coarse tuned by choosing an appropriate value for the rung capacitors. Fine tune is achieved by soldering a variable capacitor in parallel with the rung capacitor that is connected to the line. The position of the tune capacitor is shown in green in Fig. 3(a). The coil is matched to the line impedance by a variable capacitor soldered in series to the line. The match capacitor is depicted in violet in Fig. 3(a).
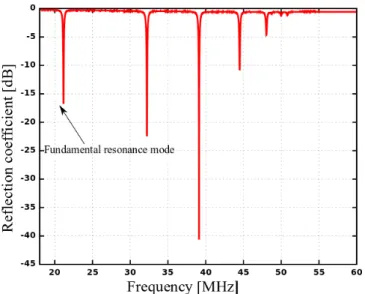
Fig. 4 depicts the reflection coefficient S11 of the probe.
Theoretically, a bird-cage coil with 16 rungs should have 9 resonances with different frequencies [12]. For a low-pass coil the fundamental resonance mode, which is the mode that produces a homogeneous B1field, correspond to the resonance
with the lowest frequency. By contrast, for a high pass bird-cage coil the fundamental resonance mode corresponds to the resonance with the highest frequency. Therefore, for our coil the fundamental resonance occurs around 21.3 MHz.
(a) (b) (c)
Fig. 2. (a) New probe built in this work, which has been installed right on the sample cell. The new probe is much more closer to the sample compared to the previous setup. (b) Front view of the RF shield. (c) Top view of the RF shield. In the modified setup the rungs of the coil were close to the sample and far away from the shield, and consequently the sensitivity has increased.
(a) (b)
Fig. 3. (a) A typical model of our low-pass bird-cage coil used in HFSS for simulations. Those parts that were made from copper are shown in red; the rung capacitors are shown in grey, the tune capacitor is shown in green, the match capacitor is shown in violet, the excitation port is shown in black, and the bridging capacitors of the RF shield are shown in yellow. Note that only 3 sections out of the 4 sections of the RF shield are shown. (b) A typical simulated H1map. The circular plane is located somewhere around the center of the total height of the coil, far away from the upper and bottom rings.
V. RESULTS ANDDISCUSSION
A. Nutation Curves
Fig. 5 shows the nutation curves of the previous and the modified probes. These curves were obtained by increasing the the duration of the excitation pulse in increments of 20µs, starting from 20µs. As can be seen the length of the 90◦ pulse for the modified probe is much shorter than the previous setup, 60µs for the modified probe compared to 160µs for the previous probe. This means that for the same sample the signal (measured in Watt) of the modified probe is (16060)2 = 7.1 times larger than the signal of the previous probe.
B. Measuring B1 Homogeneity
For MRI applications the homogeneity of the alternating magnetic field produced by the probe, B1, is very important.
Ideally B1must be homogeneous in the whole region of
inter-est. There are different techniques to measure B1homogeneity,
among which MRI can give a high resolution map for the whole region of interest. A lot of MRI pulse sequences have been developed for this purpose [13]. MRI techniques do not directly measure B1, but they measure the nutation angle
θ = γτ B1, where γ is a constant called gyromagnetic ratio
Fig. 4. Reflection coefficient, S11, of the tuned and matched coil. As can
be seen more than one resonances exist. For a low-pass bird-cage coil, the fundamental resonance corresponds to the lowest frequency. The resonance that occur at frequencies higher than 21.3 MHz do not produce a homogeneous B1field.
(a)
(b)
Fig. 5. Nutation curves of the new probe (a), and the previous probe (b). The length of the 90◦pulse is 60µs for the new probe compared to 160µs for the
previous probe. Although the noise level in (b) is much less than in (a) the setup in (a) in more sensitive for our experiment. In (b) we have more SNR simply because we have used a much larger sample. For a correct comparison the same sample has to be used for both probes.
pulse sequence we have used and the theory behind it has been described before [14]. For our experiments, this pulse sequence have been written and implemented in the Paravision program (version 4.0). The experimental data were analyzed by a home-written Python code to produce H1 maps that are
shown in Fig. 6.
In Fig. 6, the amplitude of the H1 field, for each pixel is
represented by its corresponding colour shown in the colour bar. The MRI pulse sequence we used brings about a 3D map which is represented in 8 separated 2D maps in Fig. 6. These experimental maps conform with what is expected from a bird-cage coil. That is the H1is more homogeneous in the central
parts, and as we approach the end rings it will be perturbed. The current passing through the end rings contributes to the total H1 field for each slice. For those slices which are far
away from the end rings, this contribution is negligible, and a homogeneous H1 field is expected. For slices which are close
to the end rings, this contribution is not negligible anymore, and as a result the H1 field is perturbed.
VI. CONCLUSION
The fabrication of a bird-cage coil optimised for MRI stud-ies of unsaturated granular materials has been presented. The homogeneity of the produced H1 field has been confirmed by
electromagnetic simulations as well as by experimental MRI methods. This works aims toward addressing microstructure of unsaturated granular materials with different liquid contents and under different flow regimes, using MRI, which remains to be realised in future works.
ACKNOWLEDGMENT
The authors are indebted to Mr David Hautemayou, Mr Christophe Courrier, Mr Stephane Protat, Mr Patrice Vallade, Mr Jaime E. Gil, Mr Pascal Moucheront, and Mr Benjamin Maillet for their technical support during this work. This work was supported by the National Agency of Research and within the project JCJC RheoGranosat (Grant No. ANR-16-CE08-0005-01).
REFERENCES
[1] N. Fraysse, H. Thom´e, and L. Petit. ”Humidity effects on the stability of a sandpile.” The European Physical Journal B-Condensed Matter and Complex Systems 11, no. 4 (1999): 615-619.
[2] T. Mikami, K. Hidehiro, and H. Masayuki. ”Numerical simulation of cohesive powder behavior in a fluidized bed.” Chemical Engineering Science 53, no. 10 (1998): 1927-1940.
[3] T. C. Halsey and A. J. Levine. ”How sandcastles fall.” Physical Review Letters 80, no. 14 (1998): 3141.
[4] J. N. Israelachvili: Intermolecular and Surface Forces (With Applications to Colloidal and Biological Systems). Academic Press, London, 1991, 2nd ed.
[5] L. Bocquet, E. Charlaix, S. Ciliberto, and J. Crassous. ”Moisture-induced ageing in granular media and the kinetics of capillary condensation.” Nature 396, no. 6713 (1998): 735.
[6] D. J. Hornbaker, R. Albert, I. Albert, A.-L. Barab´asi, and P. Schiffer. ”What keeps sandcastles standing?.” Nature 387, no. 6635 (1997): 765. [7] MiDi, G. D. R. ”On dense granular flows.” The European Physical
Journal E. 14, no. 4 (2004): 341-365.
[8] A. Fall, G. Ovarlez, D. Hautemayou, C. M´ezi`ere, J-N. Roux, and Franc¸ois Chevoir. ”Dry granular flows: Rheological measurements of the µ(I)-rheology.” Journal of rheology 59, no. 4 (2015): 1065-1080.
Fig. 6. Experimental H1 maps obtained by the sequence described in [14]. The amplitude of the H1 field, in A/m units, for each pixel is represented by
the corresponding colour shown in the colour bar. The MRI experiment brings about a 3D H1 map which is represented in 8 separated 2D maps. Each map
corresponds to a 2.5 cm thick slice (in total they cover a height of 20.0 cm). From (a) to (h) the height of corresponding slice increase from a level slightly lower than the bottom ring to a level slightly higher than the upper ring.
[9] B. Andreotti, Y. Forterre, and O. Pouliquen, Granular media: between fluid and solid. Cambridge University Press, 2013.
[10] A. Waguaf, L. Fadel, V. Vigneras, F. Demontoux, A. Fall, H. Takhed-mit, and M. Grzeskowiak. ”Nuclear Magnetic Resonance volumetric antenna.” 13th European Conference on Antennas and Propagation (EuCAP), pp. 1-5. IEEE, 2019.
[11] C.-L. Chin, C. M. Collins, S. Li, B. J. Dardzinski, and M. B. Smith. ”BirdcageBuilder: design of specified-geometry birdcage coils with desired current pattern and resonant frequency.” Concepts in Magnetic Resonance: An Educational Journal 15, no. 2 (2002): 156-163. [12] J. Mispelter, M. Lupu, and A. Briguet. ”NMR probeheads for biophysical
and biomedical experiments: theoretical principles & practical guide-lines.”, Imperial College Press, London.
[13] R. Pohmann, and K. Scheffler, ”A theoretical and experimental compar-ison of different techniques for B1mapping at very high fields.” NMR
in Biomedicine 26, no. 3 (2013): 265-275.
[14] G. R. Morrell, Morrell, Glen R. ”A phase-sensitive method of flip angle mapping.” Magnetic Resonance in Medicine: An Official Journal of the International Society for Magnetic Resonance in Medicine 60, no. 4 (2008): 889-894.


![Fig. 6. Experimental H 1 maps obtained by the sequence described in [14]. The amplitude of the H 1 field, in A/m units, for each pixel is represented by](https://thumb-eu.123doks.com/thumbv2/123doknet/2939368.78963/6.892.76.835.85.423/experimental-obtained-sequence-described-amplitude-field-units-represented.webp)