O
pen
A
rchive
T
OULOUSE
A
rchive
O
uverte (
OATAO
)
OATAO is an open access repository that collects the work of Toulouse researchers and makes it freely available over the web where possible.
This is an author-deposited version published in : http://oatao.univ-toulouse.fr/
Eprints ID : 5959
To link to this article : DOI: 10.1111/j.1530-9290.2010.00222.x URL : http://dx.doi.org/10.1111/j.1530-9290.2010.00222.x
To cite this version : Sablayrolles, Caroline and Gabrielle, Benoit and Montréjaud-Vignoles, Mireille Life cycle assentiment of biosolids land application and evaluation of the factors impacting human toxicity through plants uptake. Journal of Industrial Ecology, vol. 14 (n° 2). pp. 231-241. ISSN 1088-1980
Any correspondence concerning this service should be sent to the repository administrator: [email protected]
Life cycle assessment of biosolids land application and evaluation of the
factors impacting human toxicity through plants uptake
Caroline Sablayrollesa*, Benoît Gabrielleb and Mireille Montrejaud-Vignolesa a
INRA, UMR 1010 F-31077 Toulouse, France a
Université de Toulouse ; INPT, ENSIACET ; LCA (Laboratoire de Chimie Agro-Industrielle) F-31077 Toulouse, France
b
INRA, AgroParisTech, UMR 1091 Environment and Arable Crops, 78850 12 Thiverval-Grignon, France
Summary
Due to the increasing environmental concerns in the wastewater treatment sector, the environmental impacts of organic waste disposal procedures require careful evaluation. However, the impacts related to the return of organic matter to agricultural soils are difficult to assess. The aim of this study is to assess the environmental impacts of land application of two types of biosolids (dried and composted, respectively) from the same wastewater treatment plant in France, and to improve the quantification of human toxicity.
A Life Cycle Assessment (LCA) was carried out on a case study based on validated data from an actual wastewater treatment plant. Numerous impacts were included in this analysis, but a particular emphasis was laid on human toxicity via plant ingestion. For six out of the height impact categories included in the analysis, the dried biosolids system was more harmful to the environment than the composting route, especially regarding the consumption of primary energy. Only human toxicity via water, soil and air compartments and ozone depletion impacts were higher with the composted biosolids.
Keywords: Impact factor, human toxicity, wastewater treatment, organic waste, compost
1. Introduction
The handling of biosolids is one of the most significant challenges in wastewater management (Metcalf and Eddy 1991). In Europe, 8 000 000 tons of dry matter (DM) biosolids are generated annually, 40% of which is recycled in agriculture (OTV, 1997) (Ademe 2001). The potential benefits of applying biosolids to land are well documented (Moss et al. 2002) (Epstein 2003) (Singh et al. 2008). Biosolids have strong fertilizing value and may partly or completely cover crop requirements in nitrogen, phosphorus, potassium and other nutrients. Moreover, the organic matter content of composted biosolids contributes to the improvement of soil chemical and physical properties. It may impact soil properties such as cationic capacity exchange, soil bulk density or field-capacity water content, and thus produce favourable conditions for the development of crops (Wei and Lu 2005) (Casado-Vela et al. 2006).
Nevertheless, agricultural use is increasingly regarded as an insecure handling route, because biosolids also contains trace metal elements (Basta et al. 2005) (Smith 2008), trace organic compounds (Overcash et al. 2005; Cai et al. 2007; Erikson et al. 2008; Clarkle et al. 2008) and pathogens (Gerba and Smith 2005; Godfree and Farrell, 2005) that can be transmitted to plants, livestock and humans (Spinosa and Veslind, 2001) (Singh et al., 2008).
Furthermore, in accordance with the Directive 99/31 from the European Union, organic waste may no longer be landfilled as of 2005. Biosolids recycling on agricultural soils must be monitored, and laws were created to regulate these practices (Arrêté 8 January 1998) (US EPA 1993).
In this context, determining what types of biosolids are more sustainable for land application proves extremely valuable. Sustainable management means to improve resource use efficiency, preserve resources and reduce the emissions of pollutants. Life Cycle Assessment (LCA) (Guinée et al. 2000; ISO 14040 2006; ISO 14044 2006) has proved a suitable tool for sustainability assessment, providing quantitative and comprehensive information on the resource consumption and environmental emissions of the systems investigated. In recent years, LCA studies were carried out on the environmental evaluation of biosolids disposal procedures. Land application scenario came out as one of the worst systems in some cases (EPFL 2001) (Lundin et al. 2004) (Hong et. al 2008), and as one of the best in others (Arthur et al. 1999) (Suh and Rousseaux 2002). The divergences between these studies stem from model hypotheses (scope of the study, number of impact categories, types of pollutants taken into account) and from methodological hypotheses (substitution rules for by-products, integration of long term emissions, integration of positive effects). It should also be noted that the recycling of composted organic matter was never included in these analyses. Also, the transfer of toxic elements from biosolids to soils and plants was rarely addressed. Better assessment of his contamination route and of the associated impacts on human and ecosystem health is therefore warranted.
Consequently, the aim of this study was to examine the environmental impacts of dried and composted biosolids for agricultural use by evaluating their effects on human toxicity. We used a novel methodology combining field experimental data, LCA and a multimedia fate model to assess toxicity impacts. There is actually no consensus in France or the European Union on the definition of impact factors of the range of trace metals and organic compounds potentially present in biosolids on human toxicity via the air, water, soil, and plant compartments.
2. Material and methods
2.1. Life Cycle Assessment methodology and objectives
Life Cycle Assessment (LCA) is a methodology based on a global approach of the production system (“cradle-to-grave”) and on a multicriteria approach of the environmental impacts. The principle is to quantify the resources consumed and the emissions to the environment at all stages of the life cycle of the product (Guinée et al., 2002). The fluxes are subsequently interpreted in terms of impacts on the environment, for a range of categories (global warming, eutrophication of ecosystems, etc…). To ensure a credible evaluation and comparison, methodological rules have to be followed, which are developed within the framework of the ISO 14040 standards (ISO 14040 2006; ISO 14044 2006). LCA is divided into four stages: (1) Goal and scope definition, (2) Life cycle Inventory, (3) Life cycle inventory assessment, (4) Results and interpretation (Fava et al. 1991).
2.2. Functional unit
The functional unit is the comparison unit in a life cycle inventory (ISO 14040 2006; ISO 14044 2006). In this study, we defined it as the land application of one ton of dehydrated sludge dry matter (DM) with the same agronomic potential. Thus, all inventory flows are given per ton of, dehydrated sludge dry matter.
2.3. System boundaries
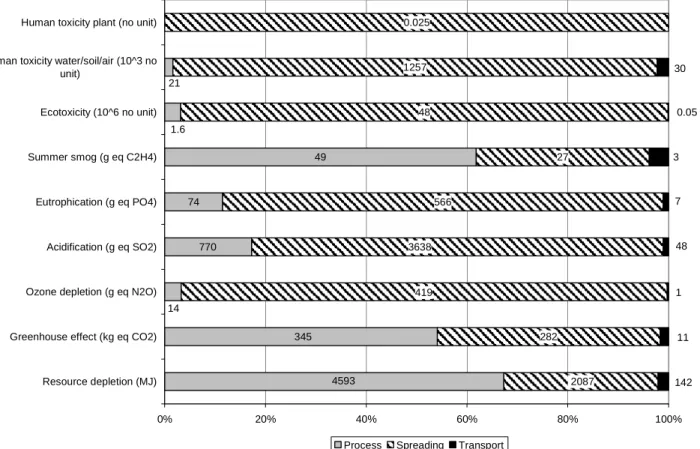
LCA was carried out for two land application systems of biosolids at a wastewater treatment plant of 800 000 equivalent-inhabitants in France, involving either dried or composted biosolids. The system includes the basic processes that differentiate the two systems for obtaining the two types of biosolids. Conversely, those processes which are common between the two routes are not included in the LCA (Figure 2). Construction, dismantlement and installations were also excluded from the analysis.
2.4. Life cycle inventory (LCI)
Data were collected in the form of a list of input and output flows from which the mass and energy balances for the various steps of the system under consideration were derived. All assumptions made during this phase, are to be mentioned especially in the case of missing data.
In order to even out the agronomic value between the two biosolids, mineral nitrogen and phosphorous fertilisers were added to the compost system to obtain the same nutrient levels in both systems.
All data concerning the sewage treatment plant, compost and biosolids production, and spreading were collected on site from the following companies or institutions:
- Veolia Water: data involved in the dry and composted biosolids processing pathways, i.e., biosolids outputs, chemical inputs, energy needed at every stage of the processes (as electricity and fuel), gas and particle emissions (table 1).
- SEDE Environnement: equipment used within the wastewater treatment plant and land application of biosolids: vehicle types (i.e., loaders, trucks, tractors, etc.), fuel consumption, capacity, distance between wastewater treatment plant and land spreading area, and application rates) (table 1).
- INRA: greenhouse gas emissions after land application of biosolids, compost or fertilisers (Mallard et al., 2006).The experimental data concerning plant uptake of trace metals (Cd, Cr, Cu, Pb, Mn, Hg, and Ni) and trace organic compounds (polycyclic aromatic hydrocarbons (PAHs), polychlorinated biphenyls (PCBs), diethylhexylphthalate (DEHP), nonylphenol ethoxylates (NP)) after land application of biosolids and composted biosolids are presented in table 2.
2.5. Life cycle impact assessment (LCIA)
Life Cycle Impact Assessment (LCIA) calculation includes two steps: classification and characterization. The characterization step transforms inventory data into impact indicators which are then quantified by the contribution of each input to a specific environmental damage. The following impacts were considered as most relevant here: resource depletion, acidification, eutrophication, greenhouse effect, ozone depletion, summer smog, ecotoxicity, and human toxicity (Table 3). The resource depletion impact evaluates the influence of the studied system on world resources of fossil energy and ores, which are finite. We used the global warming potentials provided by International Panel on Climate Change (IPCC, 1996) to calculate the enhancement of the greenhouse effect caused by the two disposal routes. The coefficients used to characterize impacts other than toxicity were taken from (Reinhardt, 2000).
While human toxicity effects via the air, water and soil compartments are usually analyzed through different impact assessment methods, we used here the integrated impact factors output by the nested, multimedia fate model USES (for « Uniform System of the Evaluation of Substances »; Huijbregts et al. 2000).
In this study, a new toxic impact category was calculated: human toxicity via plants ingestion (plants grown on the amended soil). A model based on our estimates of impact factors was developed through a soil-biosolids-plant study (Sablayrolles, 2004).
The magnitude of the potential impact of individual substances was determined by multiplying the aggregated emission for each individual substance with an equivalency factor (formula 1). (1) ISi = ixe m e e n x x e x RF E , , 1 1 , ×
∑ ∑
= = = =ISi is the impact score for impact category “Human toxicity via plant” per functional unit (kg); RFi,x,e the risk factor of impact category i for substance x due to an emission to compartment e (plant compartment) (dimensionless); Ex,e the emission of substance x to compartment e per functional unit; m is the number of compartment; n is the number of substances.
Risk factors are substance-specific, quantitative representation of potential impacts per unit emission of a substance. Risk factors for the impact category human toxicity were calculated by formula 2. (2) RFx,e =
∑
= n r rx e s x r HLD ED 1 , , , ,RFx,e is the human risk factor of a substance x due to emission to compartment e ; EDr,x,e the exposure daily dose via exposure route r (oral) of substance x for humans after emissions to compartment e (kg.day-1); HLDr,x is the human limit dose value for exposure route r (oral) for substance x (kg.day-1).
Exposure daily dose was calculated accordingly to formulae 3. (3) EDr,x,e =
∑
= × n r 1 r e, r e, x, DC PCPCx,e,r is the concentration of a substance x in compartment e (plant) (kg.kg-1 plant fresh
matter); DCe,r is the daily consumption of the compartment e (plant) for exposure route r (oral) (kg plant fresh matter per day)
Human limit dose (kg.day-1) was calculated accordingly to formulae 4.
(4) HLDr,x = LD BW n r r x ×
∑
=1 ,LDx,r is the limit dose for exposure route r (oral) for substance x (kg.day-1.kg-1 body weight);
BW is the average body weight (kg).
Ex,e isthe emission of substance x to compartment e per functional unit and correspond to the
plant uptake (g.t-1 dry matter of biosolids or compost) (formulae 5). (5) Ex,e =
∑
PCx,e×PYexPCx,e is the concentration of a substance x in a compartment e (plant) in g.kg-1 fresh matter of
plant (data from Sablayrolles, 2004); PYe is the plant yield for the compartment e (kg fresh matter of plant FM per ton dry matter of biosolids or compost).
3. Results and discussion
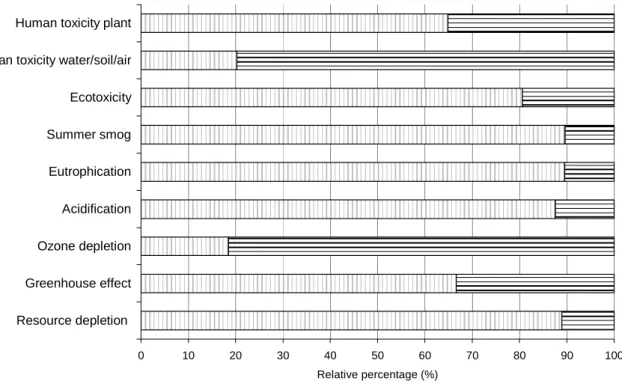
The life cycle system was divided into three parts detailed in table 1: (1) “process step” corresponding to polymer or green wastes transport, mixing, drying or composting, and truck loading, (2) transport step comprising transportation of biosolids, composted biosolids and fertilizers to agricultural field, (3) spreading step corresponding to the use of the spreading truck (tractor, spreader and excavator) and emissions due to land application of biosolids or composted biosolids.
Results are illustrated in Figures 2 and 3 which represent the percentage of impact for each system. 100% represents the impact of the total life cycle. The absolute values were also presented. These figures analysis show that “process step” is the main cause of resources depletion thus, increasing the greenhouse effect and summer smog events.
Acidification evaluates the potential impact of substances which generate acid rain or cause acidification of soils after atmospheric deposition of acid compounds. Eutrophication analyses the potential impacts caused by leakage of nitrogen and phosphorus into neighbouring aquatic ecosystems. The “spreading” stage is the main source of acidification and eutrophication when substances containing ammonia are emitted from biosolids, compost and fertilisers from land application.
Furthermore, it is interesting to note that the “transport step” is not the main contributor in the greenhouse effect, contrary to the conclusions published by Andersen (1999). The latter study does not take into account the indirect emissions, for example the production of electricity or mineral fertilisers.
The method used to analyze human toxicity is divided into four characterisation impacts: human toxicity from air, water, soil, and plants. Human toxicity via plants represents a potential transfer of trace metals and trace organic compounds present in organic wastes towards the edible parts of tomatoes and carrots. It is necessary to mention that the wastewater treatment plant respects all French and European standards concerning biosolids and compost quality for recycling by application on agricultural soils. Figures 2 and 3 show that the spreading is the most toxic process, making up about 90% of the impact due to heavy metals. The most toxic substances are polycyclic aromatic hydrocarbons (PAHs) and lead. LCA studies are generally used for system comparison in each impact category. In our case, strategic environmental comparisons involve two different methods to recycle biosolids in agriculture, using either dried biosolids or composted biosolids. Figure 5 presents relative percentages (equation 3) as a function of impact categories:
(3) Relative percentage (%) = E E E j i i + x 100
E is the total value of I (dried biosolids) and of j (composted biosolids).
However, merely comparing the categories with one another does not allow us to accurately deduce that one procedure is systematically better than the other. If all or almost all the impact categories of one procedure result in less environmental damages than the other, the choice would be more obvious. In our case, for 6 out of the 8 impact categories, the dried biosolids scenario was more harmful to the environment than the composted biosolids. Thus, our results indicate that preference should be given to the composting route. However, other criteria should be taken into account to further the comparison between the two routes such as an economic cost/benefit analysis or employment impacts.
4. Conclusion
The environmental impacts of two types of biosolids (dried and composted, from the same wastewater treatment plant) were studied from the dehydration step to biomass production in the field. The quantification of human toxicity via biomass ingestion was calculated thanks to impact factors model in uptake studies. Dried biosolids had the highest consumption of non-renewable primary energy due to the energy requirements of water evaporation from the sludge. Overall, they were more harmful to the environment than the composted biosolids for 6 out of the 8 (abiotic resources depletion, global warming, acidification, eutrophication, ozone depletion, summer smog, ecotoxicity, and human toxicity) impact categories of the life cycle assessment. These results are currently being extended to life cycle costing analysis.
References
Ademe. 2001. Les boues d'épuration municipales et leur utilisation en agriculture. [Sewage sludges and agricultural spreading]. Edited by D. documentaire. Angers.
ARRÊTÉ DU 8 JANVIER. 1998. Prescriptions techniques applicables aux épandages de boues sur sols agricoles pris en application du décret n°97-1133 du 8 décembre 1997 relatif à l'épandage des boues issues du traitement des eaux usées. [Technical prescriptions for sewage sludge land application on agricultural soils].
Basta, N.T., J.A. Ryan and R.L.Chaney. 2005. Trace element chemistry in residual-treated soil: key concepts and metal bioavailability. Journal of Environmental Quality 34:49– 63.
Cai, Q.-Y., C.-H. Mo, Q.-T. Wu, Q.-Y. Zeng and A. Katsoyiannis. 2007. Occurrence of organic contaminants in sewage sludges from eleven wastewater treatment plants,
China. Chemosphere 68(9):1751-1762.
Casado-Vela, J., S. Selles, J.Navarro, M.A. Bustamante, J.Matraix, C.Guerrero and I. Gomez. 2006. Evaluation of composted sewage sludge as nutritional source for horticultural
soils. Waste Management 26:946-952.
Clarke, B., N. Porter, R. Symons, P. Marriott, P. Ades, G. Stevenson and J. Blackbeard. 2008.
Polybrominated diphenyl ethers and polybrominated biphenyls in Australian sewage sludge. Chemosphere. In Press.
Eriksson, E., N. Christensen, J. E. Schmidt and A. Ledin. 2008. Potential priority pollutants in sewage sludge. Desalination 226(1-3):371-388.
EPFL. 2001. Projet Ecoboues - Ecobilan de filières de traitement des boues résiduaires urbaines. [EcoSludge Project - Life Cycle assessment of wastewater sludge treatment scenarios]. Rapport final, Suisse, 121 p.
Epstein, E. 2003. Land Application of Sewage Sludge and Biosolids. Lewis Publishers, Boca Raton, FL.
Gerba, C., J. E. Smith. 2005. Sources of pathogenic microorganisms and their fate during land application of wastes. Journal of Environmental Quality 34:42–48.
Guinee, J., M. Gorree, R. Heijungs, G. Huppes, R. Kleijin, A. Koning, L. Oers, A. Sleeswijk, S. Suh, H.A. Udo de haes, D.E. Bruijn, R. Van duin and M.A.J. Huijbregts. 2002. Handbook on Life Cycle Assessment Operational Guide to the ISO Standards. Kluwer Academic Publisher, Dordrecht, The Netherlands. University, Leiden, The Netherlands, 2000.
Fava, J., R. Dennison, B. Jones, M. A. Curran, B. Vigon, S. Selke and J. Barnum. 1991. A technical Framework for Life Cycle Assessment, SETAC and SETAC Foundation for Environmental Education, Washington DC.
Hong, J., J. Hong, M. Otaki and O. Jolliet. 2008. Environmental and economic life cycle assessment for sewage sludge treatment processes in Japan. Waste Management. In Press.
Houillon, G. and O. Jolliet. 2005. Life cycle assessment of processes for the treatment of wastewater urban sludge: energy and global warming analysis. Journal of Cleaner Production 13:287-299.
Huijbregts, M.A.J., U. Thissen, J.B. Guinée, T. Jager, D. Kalf, D. Van de meent, A.M.J. Ragas, A. Wegener Sleeswijk and L. Reijnders. 2000. Priority assessment of toxic substances in life cycle assessment. Part I: Calculation of toxicity potentials for 181 substances with the nested multi-media fate, exposure and effects model USES-LCA. Chemosphere 41:541-573.
IPCC, OECD, IEA, 1996. Reference Manual. Revised 1996. IPCC Guidelines for national 21
greenhouse gas inventories, Vol.3.
http://www.ipcc22nggip.iges.or.jp/public/gl/invs1.htm.
ISO 14040, Environmental management - Life cycle assessment - Principles and framework. ISO 14044, Environmental management - Life cycle assessment - Requirements and
guidelines.
Kester, G.B., R.B. Brobst, A. Carperter, R.L. Chaney, A.L Rubin, R. A. Schoof and D. S. Taylor. 2005. Risk characterization, assessment and management of organic pollutants in beneficially used residual products. Journal of Environmental Quality 34:80–90. Lundin, M., M. Olofsson, G.J. Pettersson and H. Zetterlund.2004. Environmental and
economic assessment of sewage sludge handling options. Resources, Conservation and Recycling 41:255-278.
Mallard, P., B. Gabrielle, E. Vial, D. Rogeau, M. Vignoles, C. Sablayrolles, M. Carrère, S. Renou, S., N. Pierre, O.Muller and Y. Coppin. Impacts environnementaux associés au traitement biologique et à l'utilisation agricole des déchets organiques. Bilan des connaissances en vue de l'évaluation environnementale globale des filières. Ingénieries, 2006, 48, 3-11.
Metcalf, Eddy I, editors. Wastewater engineering: treatment, disposal and reuse. 3rd ed. NewYork, USA: McGraw-Hill; 1991.
Moss, L. H., E. Epstein and T. L. Logan. 2002. Evaluating risks and benefits of soil amendments used in agriculture. Final Report Project 99-PUM-1, Water Environment Research Foundation, Alexandria, VA.
OTV. 1997. Traiter et valoriser les boues. [Treat and reutilize the sludge]. Infinités Communication, Rennemoule, France.
Overcash, M.R., R.C. Sims, J.L. Sims, and J.K.C. Nieman. 2005. Beneficial reuse and sustainability: the fate of organic compounds in land-applied waste. Journal of Environmental Quality 34:29–41.
Ramírez, W.A., X. Domene, O. Ortiz and J.M. Alcañiz. 2008. Toxic effects of digested, composted and thermally-dried sewage sludge on three plants. Bioresource Technology 99(15):7168-7175.
Reinhardt, G.A., 2000. Bio-energy for Europe. Which ones fit best? Final report, EC contract CT98-3832, IFEU, Heidelberg.
Sablayrolles, C., 2004. Etude fondamentale des transferts des composés traces organiques aux plantes. Cas des systèmes amendés par les boues d’épuration. Thesis, 31, INP, Toulouse.
Singh, R.P. and M. Agrawal. 2008. Potential benefits and risks of land application of sewage sludge. Waste Management 28(2):347-358.
Smith, S.R. 2008. A critical review of the bioavailability and impacts of heavy metals in
municipal solid waste composts compared to sewage sludge. Environment
International. In press.
Spinosa, L. and P.A. Veslind. Sludge into biosolids: processing, disposal, utilization. London, UK: IWA Publisher; 2001.
Suh, T.J. and P. Rousseaux. 2002. An LCA of altenative wastewater sludge treatment scenarios. Resources, Conservation and Recycling 35(3):191-200.
Truphène-Maisonnave, V. 2000. Caractérisation des éléments traces métalliques dans les amendements et les complexes amendements-sols et étude des transferts. Thesis, 31, INP, Toulouse
US EPA (US Environmental Protection Agency). 1993. Part 503 - standards for the use or disposal of sewage sludge. Fed Regist 1993; 58:9387-404.
Wei, Y. and Y. Liu. 2005. Effects of sewage sludge compost application on crops and cropland in a 3-year field study. Chemosphere 59(9):1257-1265
About the Author
Caroline Sablayrollesis a young associate professor at the National Institute of Agronomic research (INRA, Agro-Industrial Chemistry laboratory, UMR 1010, University of Toulouse) in Toulouse, FRANCE.
Mireille Montréjaud-Vignoles is a professor at the National Institute of Agronomic research (INRA, Agro-Industrial Chemistry laboratory, UMR 1010, University of Toulouse) in Toulouse, FRANCE.
Benoît Gabrielle is a professor at the Departement of Agronomy, Forestry, Water and Environmental Science and Technology of AgroParisTech, and associated with the Environment and Arable Crops Joint resarch unit (UMR 1091, National Institute of Agronomic research, AgroParisTech), in Thiverval-Grignon, FRANCE.
*Corresponding author:
Caroline Sablayrolles, ENSIACET, Laboratoire de Chimie Agro-Industrielle, 118 Route de Narbonne F-31077 Toulouse, France, Tel. : +33 5 62 88 57 63 ; Fax : +33 5 62 88 57 30
Table 1. Inventory data of the two systems Composted biosolids Dried biosolids Sources PROCESS STEP
Electricity for mixing (kWh/FU) 33.22 69.03 Veolia Water
Green by-product (t/FU) 3.50 - SEDE Environnement
Green by-product transport (km) 200 - SEDE Environnement
Green by-product transport consumption (L gasoline/FU) 2.38 - SEDE Environnement Dehydrated sludge transport consumption to platform (L gasoline/FU) 8.91 - SEDE Environnement Electricity for drying or composting (kWh/FU) 305.13 335.51 Veolia Water
Gas for drying or composting (kWh/FU) - 10 776.18 Veolia Water
Polymer consumption (t/FU) - 0.17 Veolia Water
Polymer transport (km) - 1000 SEDE Environnement
Polymer transport consumption (L gasoline/FU) - 1.98 SEDE Environnement
Biosolids transport to storage (L gasoline/FU) - 0.46 Veolia Water
Electricity for peripherics apparatus(kWh/FU) 195.57 1042.20 Veolia Water
TRANSPORT STEP
Transport to field (km) 60 80 SEDE Environnement
Transport to field: consumption (L gasoline/FU) 3.03 4.53 SEDE Environnement
SPREADING STEP
Spreader characteristics (m3) 22 14 SEDE Environnement
Spreader consumption (L gasoline/FU) 0.84 1.35 SEDE Environnement
Tractor characteristics (HP) 200 250 SEDE Environnement
Tractor consumption (L gasoline/FU) 2.31 3.56 SEDE Environnement
P fertiliser (kg DM/FU) 7.5 - (Sablayrolles, 2004)
N fertiliser (kg DM/FU) 22.5 - (Sablayrolles, 2004)
Application rate (t eq. dehydrated sludge DM/ha) 45 99 SEDE Environnement
Table 2. Data collection in order to calculate human toxicity impact factors via the plants
compost dried Sources
Pollutants concentrations in plants after harvest Carrots (µg/kg plant DM) ΣPAHs = 68.28
Σ PCBs = 65.02
ΣPAHs = 73.32
ΣPCBs = 25.77
(Sablayrolles, 2004)
Tomatoes (mg/kg plant DM) DEHP =10.867 NP =0.198 DEHP = 3.888 NP =0.054 Cd = 2.5 Cr = 1.0 Cu = 8.0 Ni = 2.5 Pb = 1.0 Zn = 8.0 (Sablayrolles, 2004) (Truphène-Maisonnave, 2004)
Dry matter content
Carrots (% DM) 17 17 (Sablayrolles, 2004)
Tomatoes (% DM) 5.4 5.4 (Sablayrolles, 2004)
Plant yield
Carrots (kg DM plant/FU) 767.5 372.6 (Sablayrolles, 2004)
Tomatoes (kg DM plant/FU) 695.2 310.9 (Sablayrolles, 2004)
Average daily consumption in France
Carrots (kg/person/day) 0.024 0.024 French Ministry of
Agriculture
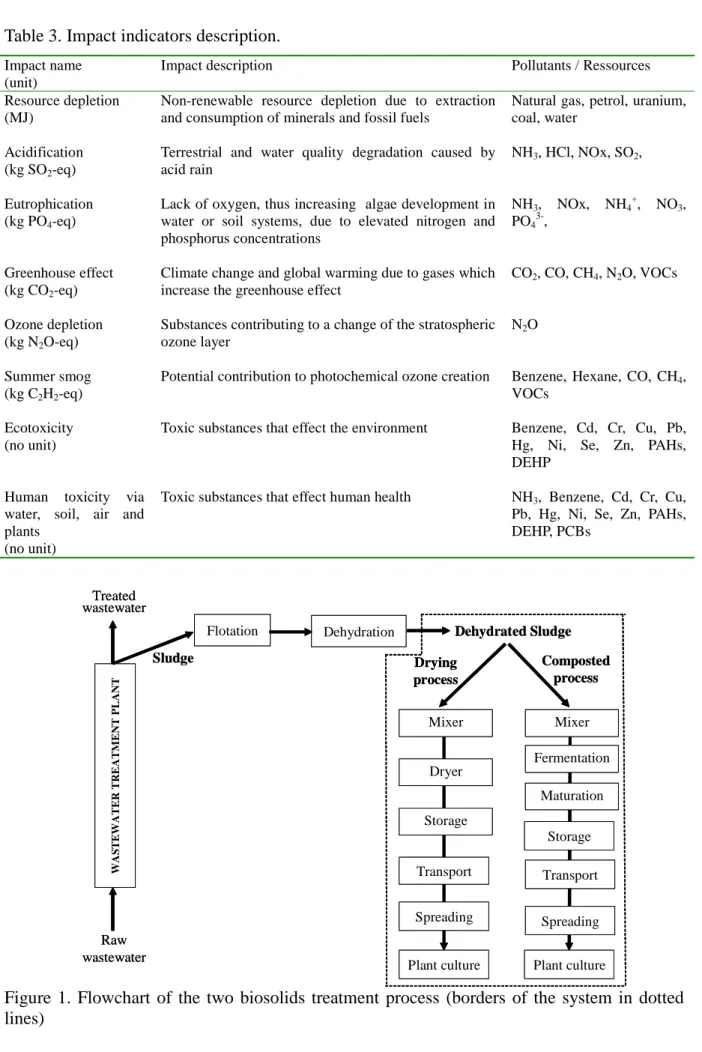
Table 3. Impact indicators description. Impact name
(unit)
Impact description Pollutants / Ressources
Resource depletion (MJ)
Non-renewable resource depletion due to extraction and consumption of minerals and fossil fuels
Natural gas, petrol, uranium, coal, water
Acidification (kg SO2-eq)
Terrestrial and water quality degradation caused by acid rain
NH3, HCl, NOx, SO2,
Eutrophication (kg PO4-eq)
Lack of oxygen, thus increasing algae development in water or soil systems, due to elevated nitrogen and phosphorus concentrations
NH3, NOx, NH4+, NO3,
PO43-,
Greenhouse effect (kg CO2-eq)
Climate change and global warming due to gases which increase the greenhouse effect
CO2, CO, CH4, N2O, VOCs
Ozone depletion (kg N2O-eq)
Substances contributing to a change of the stratospheric ozone layer
N2O
Summer smog (kg C2H2-eq)
Potential contribution to photochemical ozone creation Benzene, Hexane, CO, CH4,
VOCs Ecotoxicity
(no unit)
Toxic substances that effect the environment Benzene, Cd, Cr, Cu, Pb, Hg, Ni, Se, Zn, PAHs, DEHP
Human toxicity via water, soil, air and plants
(no unit)
Toxic substances that effect human health NH3, Benzene, Cd, Cr, Cu,
Pb, Hg, Ni, Se, Zn, PAHs, DEHP, PCBs
Figure 1. Flowchart of the two biosolids treatment process (borders of the system in dotted lines) W A S T E W A T E R T R E A T M E N T P L A N T Transport Raw wastewater Treated wastewater Sludge Dehydration
Flotation Dehydrated Sludge
Mixer Dryer Storage Spreading Transport Mixer Fermentation Maturation Spreading Storage Drying process Composted process
Plant culture Plant culture
W A S T E W A T E R T R E A T M E N T P L A N T Transport Raw wastewater Treated wastewater Sludge Dehydration
Flotation Dehydrated Sludge
Mixer Dryer Storage Spreading Transport Mixer Fermentation Maturation Spreading Storage Drying process Composted process
54375 38 3145 286 681 59 28235 5255 1232 4 50 204 280 0.045 211 26 6 200 15 1 67 10 4 1 0% 10% 20% 30% 40% 50% 60% 70% 80% 90% 100% Resource depletion (MJ) Greenhouse effect (kg eq CO2) Ozone depletion (g eq N2O) Acidification (g eq SO2) Eutrophication (g eq PO4) Summer smog (g eq C2H4) Ecotoxicity (10^6 no unit) Human toxicity water/soil/air (10^3 no
unit)
Human toxicity plant (no unit)
Process Spreading Transport
Figure 2. Contribution of the various stages of dried biosolids scenario in the various impact categories 49 566 27 21 1.6 74 770 345 4593 14 1257 48 3638 282 2087 419 0.025 30 0.05 3 7 48 1 142 11 0% 20% 40% 60% 80% 100% Resource depletion (MJ) Greenhouse effect (kg eq CO2) Ozone depletion (g eq N2O) Acidification (g eq SO2) Eutrophication (g eq PO4) Summer smog (g eq C2H4) Ecotoxicity (10^6 no unit) Human toxicity water/soil/air (10^3 no
unit)
Human toxicity plant (no unit)
Process Spreading Transport
Figure 3. Contribution of the various stages of composted biosolids scenario in the various impact categories
0 10 20 30 40 50 60 70 80 90 100 Resource depletion Greenhouse effect Ozone depletion Acidification Eutrophication Summer smog Ecotoxicity Human toxicity water/soil/air Human toxicity plant
Relative percentage (%) Dried sludge Composted sludge