Université de Montréal
Identifying PGC-1α-dependent hepatokines in a non-alcoholic fatty liver disease murine model.
Par
Philipa Levesque-Damphousse
Programmes de Biologie Moléculaire Faculté de Médecine
Mémoire présentée à la Faculté des études supérieures en vue de l’obtention du grade de maîtrise en Biologie Moléculaire.
Décembre 2019
Résumé
La stéatose hépatique non alcoolique (SHNA) est maintenant une des principales causes de cancer du foie. Cependant, les mécanismes physiopathologiques contribuant à son développement ou à la progression de la maladie sont peu connus. Il a été démontré que le niveau d’expression du coactivateur transcriptionnel PGC-1α est inversement proportionnel avec la sévérité de la stéatose hépatique le stress oxydatif et la résistance à l’insuline dans les foies de souris. Chez l’humain, on observe aussi une diminution de PGC-1α dans les foies de patients atteints de SHNA. De plus, il a été démontré que les souris avec une réduction de 50% des niveaux hépatique de PGC-1α mène à une sensibilité à l’insuline et à une tolérance au glucose altérée dans les tissus périphériques. Ces découvertes suggèrent qu’en plus d’être associés au développement de la SHNA, les niveaux hépatiques de PGC-1α altèrent l’expression de facteurs sécrétoires du foie afin d’influencer la régulation métabolique de tout le corps. Nous proposons qu’une réduction de l’expression de PGC-1α dans le foie influence les protéines sécrétées par le foie en situation de stress métabolique, révélant l’importance de PGC-1α dans la réponse adaptative du foie. L’analyse du sécrétome hépatique effectuée par spectrométrie de masse sur le milieu conditionné d’hépatocytes primaires a identifié SERPINA3N, une protéine sécrétée, dont les niveaux corrèlent avec les niveaux hépatiques de PGC-1α et sont influencés par la diète obésogène. Dans ce projet, les niveaux sanguins de cette protéine ont été quantifiés par western blot chez des souris mâles et femelles, sauvages ou hétérozygotes pour PGC-1α dans le foie et nourris avec une diète control ou riche en gras et en fructose. Nos résultats démontrent que les niveaux circulatoires de SERPINA3N augmentent avec la diète et corrèlent avec les niveaux hépatiques de PGC-1α de manière dépendante à la diète et le sexe. De plus, les niveaux sanguins de SERPINA3N diminuent avec la progression de la maladie. L’expression hépatique de SERPINA3N est grandement influencée par les niveaux de PGC-1α, mais indépendamment du facteur transcriptionnel NF-κB. Nous avons montré que les glucocorticoïdes augmentent les niveaux protéiques et circulatoires de SERPINA3N dans les hépatocytes primaires. De plus, cette augmentation par les glucocorticoïdes est influencée par
récepteur des glucocorticoïdes sur l’expression hépatique et la sécrétion de SERPINA3N. Pour conclure, l’identification de protéines circulatoires régulées par PGC-1α nous aidera à mieux comprendre comment la perte d’expression de PGC-1α dans le foie affecte le métabolisme de tout le corps dans le contexte de la SHNA.
Mots-clés : SHNA, PGC-1α, sécrétome hépatique, protéines circulatoires, SERPINA3N, sexe, progression, glucocorticoïdes, diète.
Abstract
Non-alcoholic fatty liver disease (NAFLD) is becoming a serious public health problem and is now one of the leading causes of liver cancer. Although NAFLD is known to be associated with obesity, insulin resistance, metabolic syndrome and type II diabetes, the mechanisms contributing to its development are not fully understood. It is shown that hepatic PGC-1α levels correlate negatively with NAFLD development, oxidative liver damage and hepatic insulin resistance in murine models. In humans, decrease PGC-1α expression in NAFLD and NASH patients. Moreover, liver-specific PGC-1α reduction in mice also disrupts glucose tolerance and insulin sensitivity in muscle and adipose tissue, likely due to altered secretion of hepatic hormones.These findings suggest that in addition to contributing to NAFLD development, the hepatic disruption of PGC-1α alters the liver secretome, thereby influencing the whole-body energy metabolism. We hypothesize that decreased expression of PGC-1α in the liver alters the expression of hepatokines under metabolic challenges, revealing a potential novel role for PGC-1α in the adaptive response of the liver. The hepatocyte-specific secretome was analyzed by mass spectrometry (iTRAQ) in conditioned media from primary hepatocytes. We identified SERPINA3N, a secreted protein whose secreted levels correlated with hepatic PGC-1α levels in a diet-dependent manner. This hepatokine was measured in serum from male, female, wildtype and liver-specific PGC-1α heterozygote mice fed chow or high-fat, high-fructose diet using western blot. SERPINA3N circulating levels increased with the western diet and correlated with hepatic PGC-1α levels in a diet and sex-dependent manner. Its serum levels decreased with the progression of the disease. The hepatic SERPINA3N expression was greatly influenced by PGC-1α levels independently of NF-κB transcription factor. We showed that glucocorticoids increased SERPINA3N protein and secreted levels in primary hepatocytes. This increase was influenced by PGC-1α levels, revealing a novel interaction of PGC-1α and the glucocorticoid receptor on SERPINA3N expression and secretion. In conclusion, this project reveals a novel impact of hepatic PGC-1α levels on the liver secretome during NAFLD development. This work will provide insights on the role of hepatic PGC-1α levels on the regulation of hepatokines and how it influences the whole-body energy homeostasis in a
Keywords: NAFLD, PGC-1α, liver secretome, hepatokines, glucocorticoids, circulating, sex, diet, progression.
Table of contents
Résumé ... ii
Abstract ... iv
Table of contents ... vi
List of tables ... viii
List of figures ... ix
List of abbreviations ... x
Acknowledgments ...xiii
Introduction ... 1
The liver... 2
Structural organization of the liver ... 2
Metabolic functions of the liver ... 2
Endocrine function of the liver ... 3
Non-alcoholic fatty liver disease ... 4
Characteristics of NAFLD ... 4 Prevalence ... 4 Diagnosis methods ... 6 Treatments ... 7 Pathogenesis ... 8 Genetic predispositions ... 10
Peroxisome proliferator-activated receptor gamma coactivator-1 ... 11
PGC-1 family members ... 11
Tissue-specific functions of PGC-1α ... 11
PGC-1α and metabolic diseases ... 13
PGC-1α loss-of-function murine models ... 15
PGC-1α impacts the cell secretome ... 16
Material and methods ... 20
Animal models ... 21
Mouse housing and diets ... 21
Primary hepatocytes isolation ... 21
Cell culture and treatments ... 22
Conditioned media ... 22
Protein isolation and immunoblotting ... 23
Histology ... 23
Hepatic lipids quantification ... 23
RNA isolation and RT-qPCR ... 23
Serum depletion ... 24
Statistical analysis ... 24
Results ... 25
NAFLD mouse model validation and simple steatosis characterization. ... 26
The hepatic expression of genes involved in NAFLD development. ... 29
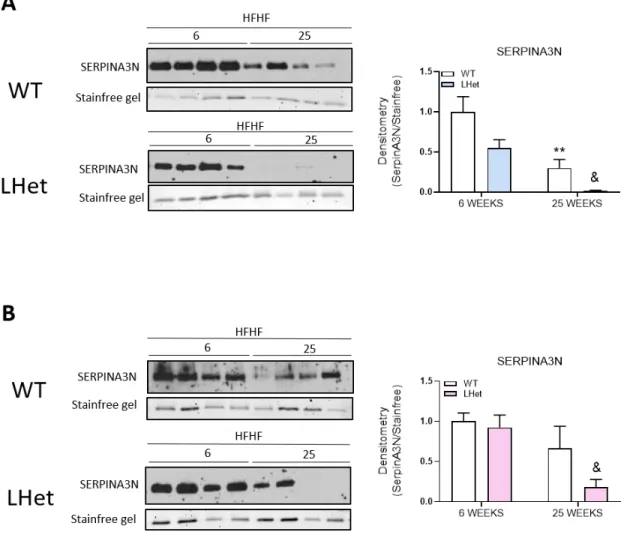
SERPINA3N circulating levels in male and female mice serum. ... 33
SERPINA3N circulating levels decrease with NAFLD progression. ... 37
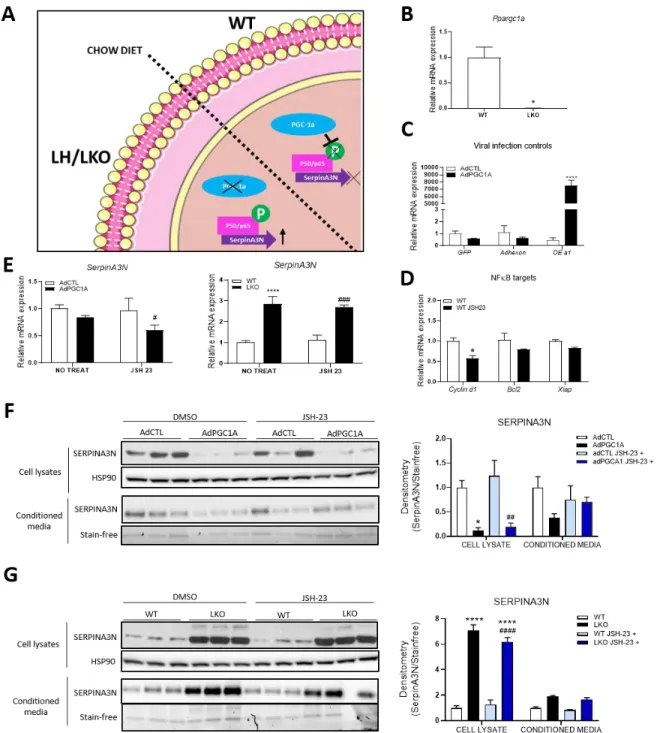
The hepatic regulation of Serpina3n gene expression. ... 40
Hepatic serpina3n expression is independent of NF-κB activity. ... 40
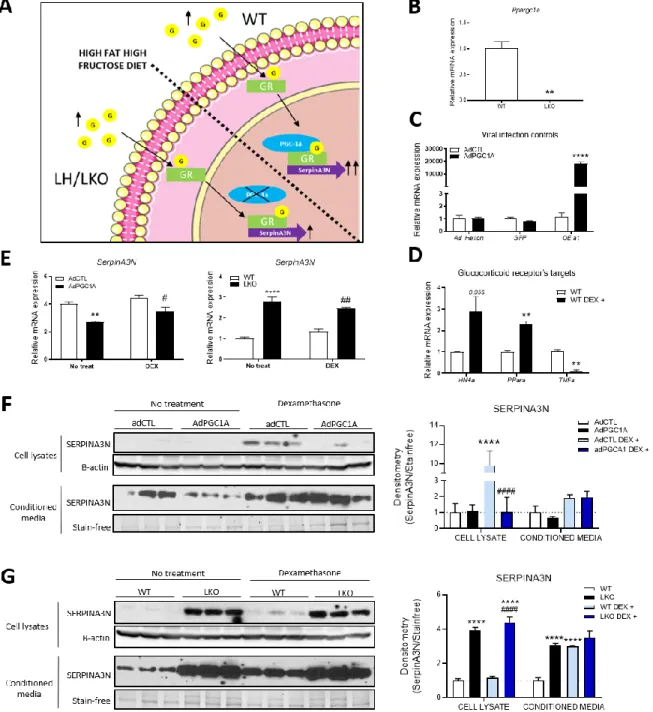
Effect of glucocorticoids and hepatic PGC-1α on SERPINA3N proteins levels. ... 44
Discussion... 47
Annexe ... 57
List of tables
Table 1. - Antibodies for immunoblot. ... 62 Table 2. - Primers used for quantitative real-time PCR: listed in 5'-3' direction. ... 63
List of figures
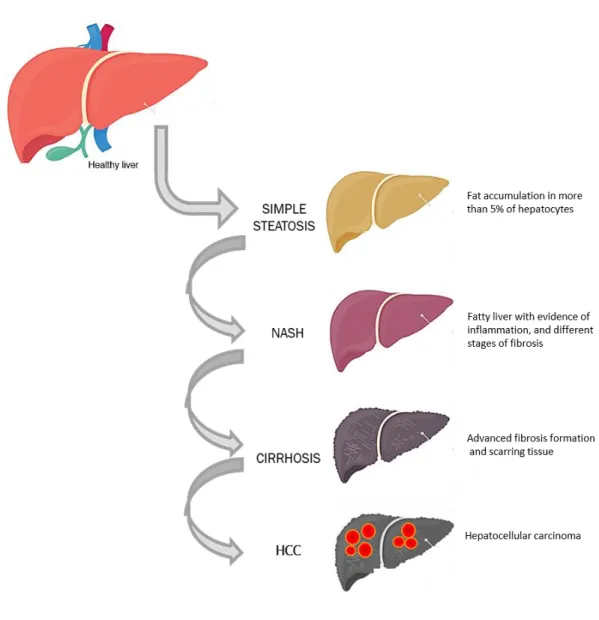
Figure 1.- The spectrum of liver pathologies in non-alcoholic fatty liver disease. ... 5
Figure 2. - SERPINA3N secreted levels in conditioned media. ... 18
Figure 3. - Histological characterization of male and female mice livers. ... 28
Figure 4. - Impact of diet on hepatic expression of genes involved in NAFLD development. ... 31
Figure 5. - Impact of hepatic disruption of PGC-1α and diet on gene expression at 6 weeks. .... 32
Figure 6. - Diet and hepatic PGC-1α levels influence SERPINA3N serum levels in male mice. .... 35
Figure 7. - Unchanged serum levels of SERPINA3N in female mice after 6 weeks. ... 36
Figure 8. - SERPINA3N circulating levels decrease with NAFLD progression... 39
Figure 9. - SERPINA3N expression is influenced by PGC-1α levels independently of NF-κB. ... 43
Figure 10. - SERPINA3N expression influenced by PGC-1α through the glucocorticoid receptor. ... 46
Figure 11. – SERPINA3N secretion in murine model of PGC-1α -related NAFLD progression. .... 55
Figure 12. – PGC-1α regulation of hepatic Serpina3n expression in basal and western diet conditions. ... 56
Supplementary figure 1. - Expression of NF-κB targets in TNF-α-mediated activation of NF-κB and inhibition by JSH-23 inhibitor... 58
Supplementary figure 2. - Dexamethasone concentration and incubation time optimization ... 59
Supplementary figure 3. - Hepatic gene expression in WT, LHet and LKO mice fed chow or HFHF diet. ... 60
Supplementary figure 4. - Plasmid construct for adeno-associated virus (AAV) expressing serpina3n. ... 61
List of abbreviations
AAV: adeno-associated virusACTA2: actin-alpha 2
ALT: alanine aminotransferase APOA4: Apolipoprotein A4 APOB: Apolipoprotein B APOC2: Apolipoprotein C2 APOC3: Apolipoprotein C3 AST: aspartate aminotransferase
B220: B cell isoform of 220kDa of CD45R protein. BIP: binding immunoglobulin protein
BMI: body mass index
CCL2: chemokine (C-C motif) ligand 2 CCL3: chemokine (C-C motif) ligand 3 CD4: cluster of differentiation 4
CD45R: cluster of differentiation 45 receptor CD68: cluster of differentiation 68
CHOP: C/EBP homologous protein COL1A1: collagen type 1 alpha 1 CT: computerized tomography ECM: extracellular matrix ECT: electron transport chain ER: endoplasmic reticulum
ERRα: estrogen-related receptor alpha FAO: fatty acid β-oxidation
FDA: federal drug administration FFA: free fatty acids
FOXO1: Forkhead box protein O1 G-6-Pase: Glucose-6-phosphatase GCKR: glucokinase regulatory protein GR: glucocorticoids receptor
H&E: hematoxylin and eosin HFHF: high-fat, high-fructose
HNF4α: hepatocyte nuclear factor 4 alpha IL-1β: interleukin-1 beta
IL-6: interleukin-6
ITRAQ: isobaric tags for relative and absolute quantification LHet: liver-specific heterozygote of PGC-1α
LKO: liver-specific knock-out of PGC-1α LPS: lipopolysaccharides
MRI: magnetic resonance imaging mTOR: mammalian target of rapamycin
MTTP: Microsomal triglyceride transfer protein NAFL: non-alcoholic fatty liver
NAFLD: non-alcoholic fatty liver disease NASH: non-alcoholic steatohepatitis NF-κB: nuclear factor-kappa B
NR1D1: nuclear receptor subfamily 1 group D member 1 NRF-1: nuclear respiratory factor 1
NRF-2: nuclear respiratory factor 2
NUR77: nuclear receptor 77, nerve growth factor IB PEPCK: Phosphoenolpyruvate carboxykinase
PGC-1α: peroxisome proliferator-activated receptor gamma coactivator-1 alpha protein PGC-1β: peroxisome proliferator-activated receptor gamma coactivator-1 beta
PNPLA3: patatin-like phospholipase domain-containing 3 PPARα: peroxisome proliferator-activated receptor alpha
PPARγ: peroxisome proliferator-activated receptor gamma PRC: PGC-related coactivator
PRX5: peroxiredoxin 5 ROS: reactive oxygen species
SHNA: stéatose hépatique non alcoolique SNP: single nucleotide polymorphism SOD2: superoxide dismutase 2
STAT3: signal transducer and activator of transcription 3 TFAM: transcription factor A, mitochondrial
TFB: transcription factor B
TGFβ1: transforming growth factor beta 1 TLR4: toll like receptor 4
TM6SF2: transmembrane 6 superfamily 2 TMT: tandem mass tag
TNF-Α: tumor necrosis factor alpha TR: thyroid hormone receptor UCP1: uncoupling protein 1 VLDL: very low-density lipoprotein WAT: white adipose tissue
WT: wildtype
XBP1 SP: X-box binding protein 1spliced XBP1: X-box binding protein 1
Acknowledgments
I would first like to thank my research director, Jennifer Estall for her support, guidance and trust and allowing me to complete my master’s thesis in her lab. During my two years in Dr Estall lab, I learned a lot of things scientifically, professionally and personally. This rewarding experience shaped me into a better scientist.
Thanks to my fellow lab members for all their support and love. To Aurèle for being a great mentor. To Nathalie for being a lab leader model. To Mélissa, my coffee partner, for your help in literally everything and your moral support. Finally, thanks to Emilie, Cindy, Hannah, Aysim and Stewart for your kindness, your support, the Celine Dion marathon (Emilie), the chocolates, candies, cakes and ice cream outing. The best team! Thanks to Celine Schott, the almost member of Estall lab, and all IRCM friends.
Thanks to Denis Faubert, Josée Champagne, Sylvain Tessier and Marguerite Boulos from the proteomic platform for their generous help and patience. Thanks to Jonathan Boulais for the incredible help with the proteomic data.
The liver
Structural organization of the liver
The liver is the largest visceral organ and gland of the human body capable of multiple functions in metabolism, detoxification and regulation of the body’s nutrients (1). The liver is supplied in blood from two different sources. The hepatic artery brings oxygenated blood from peripheral tissues, while the hepatic portal vein brings deoxygenated blood from the gastrointestinal tract (2). The blood then passes through sinusoids to reach the hepatocytes to regulate nutrient levels, detoxify the body from chemicals and metabolize drugs (3). The multiple functions of the liver are important in maintaining the body homeostasis and supporting peripheral tissues. Regulation by the liver consists in balancing nutrients levels in circulation in the blood by metabolizing, storing, and producing metabolites such as glucose (4). These multiple functions are possible due to the complex structure and organization of the liver. The main tissue of the liver, the parenchyma, is composed of multiple cell types; hepatocytes, cholangiocytes, sinusoidal endothelial cells, macrophages, lymphocyte, dendritic cells and stellate cells.
Metabolic functions of the liver
The liver is involved in metabolism and regulation of the levels of sugars, amino acids and fats in the bloodstream. We can group the metabolic functions of the liver under three categories: carbohydrate, protein, and lipid metabolism. Carbohydrate metabolism consists of storing excess blood glucose into glycogen in the fed state; and producing new glucose from amino acids (gluconeogenesis) or breaking down the glycogen into glucose (glycogenolysis) to be released in the circulation under the fasting state (5). Protein metabolism consists of catabolizing proteins into amino acids by a process called proteolysis in the small intestines and then transporting these amino acids to the liver to be either transformed into glucose or ketones or degraded into nitrogen substrates. The amino acid glutamine is transported from peripheral tissues to the liver, to be degraded into glutamate and ammonia. Since high levels of ammonia is toxic for the organism, the cells need to eliminate this nitrogen substrate. Hepatocytes are able to transform ammonia into urea via the urea cycle (6). The resulting urea
is then released In the blood and eliminated from the organism in urine (5). The last main function of the liver is lipid metabolism, which consists of lipolysis and lipogenesis. Lipolysis is the breaking of the dietary triglycerides into fatty acids. Fatty acids can then be oxidized, yielding acetyl-CoA, a substrate for cellular energy production better known as the Kreb’s cycle. Lipogenesis is the production of triglycerides, cholesterol and lipoproteins from fatty acid substrates, in context of excess glucose and glycogen storage. These are produced using acetyl-CoA derived from pyruvate, a product of glycolysis during carbohydrate metabolism (7). The liver is crucial in modulating and adapting to changing nutrient substrates such as lipids, sugars and amino acids in response to the physiological state of the organism (fasting, starvation, ketogenic diets, nutrient excess) (7).
Endocrine function of the liver
Considered an endocrine gland, the liver contributes to the synthesis and secretion of multiple circulating proteins and metabolites, essential for peripheral tissue function, organ crosstalk and whole-body energy homeostasis. The liver is well known to secrete bile, which is stored in the gallbladder and contains bile acids important for the digestion of fats in the small intestine (4). Through the hepatic vein, the liver releases glucose, cholesterol, urea and plasma proteins such as albumin and clotting factors into the bloodstream (7, 8). Many hepatokines and hormones secreted by the liver contribute to organ cross-talk and peripheral tissues growth and development (7, 9).This highlights the importance of the liver on the whole-body metabolism through these secreted factors.
The liver is a complex organ of the human body with multiple functions crucial to maintain homeostasis. The liver is in constant adaptation to our dietary habits, revealing a strong association between liver health and malnutrition. When the liver is no longer able to adapt to the high energy demands and metabolic challenges, there is disruption of hepatic metabolic functions. This hepatic disruption leads to development of metabolic disorders such as non-alcoholic fatty liver disease (10). Non-non-alcoholic fatty liver disease (NAFLD) is closely associated
to obesity, type 2 diabetes (T2D) and insulin resistance (11). It is the hepatic manifestation of obesity and the metabolic syndrome (12).
Non-alcoholic fatty liver disease
Characteristics of NAFLD
Non-alcoholic fatty liver disease (NAFLD) has become a serious public health problem and is now considered as the major cause of liver disease (13). NAFLD is a spectrum of liver diseases starting with non-alcoholic fatty liver (NAFL), also known as simple steatosis. This stage is characterized by triglyceride accumulation in more than 5% of the hepatocytes. Scientists estimate that around 30% of fatty liver cases will develop into non-alcoholic steatohepatitis (NASH), a NAFLD stage characterized by steatosis with evidence of inflammation and various levels of fibrosis. Different levels of fibrosis are observed during the progression of NAFLD, and can eventually progress to cirrhosis, the formation of scarring tissue (14). Hepatocellular carcinoma (HCC) can then emerge from the cirrhotic livers. However, more studies show evidence of NASH-related HCC development in absence of cirrhosis (15, 16). In addition, NASH is now known as one of the main causes for liver transplantation and HCC (Figure 1) (17). The distinctive pathophysiology of the different stages, the patient variability and the environmental factors contributing to NAFLD makes this disease complex and difficult to study. NAFLD is closely associated with obesity, insulin resistance, metabolic syndrome and type 2 diabetes, yet the mechanisms contributing to its development are still not fully understood.
Prevalence
The prevalence of NAFLD is parallel to the global epidemy of obesity, type 2 diabetes and the metabolic syndrome, affecting 25% of the global population (17). In Canada, it is estimated that 50% of Canadians are overweighed and approximately 25% of Canadians are obese (18, 19). Moreover, scientists estimate that 75% of obese subjects will develop a fatty liver. Canadian children are also at risk, estimating that 10% may develop NAFLD in correlation with increasing rates of obesity at reported at young age (20). The increased prevalence of NAFLD is higher in type 2 diabetics and as mentioned obesity. However, multiple studies report lean subjects with
NAFLD, suggesting that besides environmental factors such as diet and lifestyle, genetic predisposition also contributes to the development of liver disease (21).
Figure 1.- The spectrum of liver pathologies in non-alcoholic fatty liver disease.
The first stage of disease is simple steatosis, affecting approximately 25% of the worldwide population. 30% of patients with simple steatosis progress to NASH, characterized by inflammation and fibrosis formation in addition to fat accumulation. 20% of NASH patients develop cirrhosis. Finally, many patients with fatty livers will develop hepatocellular carcinoma
Diagnosis methods
One of the main difficulties in treating and preventing the development of non-alcoholic fatty liver disease is the lack of early diagnosis methods. The struggle to detect the early stages of NAFLD is due to the absence of non-invasive and accurate methods. In addition, it is even more difficult to detect this disease since early stages are asymptomatic. Even though NAFLD research has incredibly advanced over the last decades, the gold standard method remains liver biopsy, an invasive and risky methods (22). Since NAFLD patients do not present symptoms, the diagnosis is often accidental after blood tests, medical exams or during surgery when the doctor notices the liver is fatty. Non-alcoholic fatty liver disease is then diagnosed by exclusion when there are no evident causes of alcohol drinking, hepatitis infection or steatogenic medication (23).
Measurements of liver enzymes in the blood, such as aspartate aminotransferase (AST) and alanine aminotransferase (ALT) are used as indicators of liver damage; however, these are more indicative of the late and irreversible stages of liver disease. Measurements of circulating liver enzymes can be combined with imaging technologies such as ultrasound, MRI, CT scan and FibroScan. The FibroScan uses transient elastography, which is an ultrasound to measure liver stiffness as a surrogate marker of fibrotic and cirrhotic livers (24). The fatty liver index (FLI) is a recent method combining both imaging technologies and liver histology, which consists of measuring BMI, waist circumference, circulating liver enzymes and hepatic triglyceride content (17). However, not all obese individuals develop fatty liver disease and this tool is not designed to differentiate the early stages of NAFLD. As listed above, a multitude of diagnosis methods are available, but the sensitivity and specificity of these techniques are limited. The imaging technologies are non-invasive tools but remain a high cost method and are not applicable for large-scale NAFLD screening. Therefore, there is an urgent need to find non-invasive methods to potentially screen the whole population and diagnose the early stages of NAFLD to prevent the progression of the disease by drug-free treatments such as exercise and diets (24).
Treatments
As of today, there are no approved drugs by the Food and Drug Administration (FDA) to treat NAFLD and NASH (25). Current treatments focus on comorbidities associated with NAFLD, such as type 2 diabetes, insulin resistance, metabolic syndrome and obesity with the hope of slowing down progression. Finding treatments to improve health and reduce mortality of patients is key to prevent NAFLD progression (26). Current drugs in development to treat specifically NAFLD are target hallmarks of the disease, such as hepatic inflammation, oxidative damage, insulin resistance and dyslipidemia (25). However, administration of drugs to patients depend on comorbidities and the severity of the disease. Some stages of NAFLD are reversible, such as simple steatosis, early stages of NASH and some levels of fibrosis (27). However, whether advanced stages such as cirrhosis is reversible is still a debate, since no efficient treatment has proven to reverse completely and restore the liver health (28, 29). Current first-line treatments for NAFLD include:
Weight loss
NAFLD is strongly associated with obesity, therefore it is important to submit obese patients to strict, healthy diets and increased physical activity. It was reported that weight loss can decrease cardiovascular and diabetes risk and that more than 10% weight loss can almost resolve NAFLD and improve fibrosis. In morbidly obese patients, the best option appears to be bariatric surgery (30).
Insulin sensitising drugs
Metformin administration to animal models is found to decrease hepatic steatosis and improve inflammation (26). Metformin improves the insulin sensitivity and restores ALT and AST levels in NAFLD patients, but the impact at the histological level of NAFLD and NASH livers are not convincing (31). More human trials on the efficacy of Metformin to treat NAFLD are needed, since the current observations result from small cohorts (26, 32).
Antioxidants
Oxidative stress and lipid peroxidation are important hallmarks of NAFLD and NASH (25). Pilot studies have showed the efficacy of vitamin E and C in reducing hepatic inflammation, significantly improving the fibrosis score and restored the ALT and AST blood levels in children with NASH (26, 33, 34).
Lipid controlling drugs
Statins are widely-used drugs that reduce hepatic production of cholesterol and low-density lipoproteins, preventing cardiovascular disease and heart attacks (35). In NAFLD, statins are administered to patients with hyperlipidemia and to reduce the hepatic fat content (25). However, statins can have important secondary effects, such as myopathy and increased risk for type 2 diabetes (35).
Pathogenesis
The biological mechanisms contributing to the development and progression of non-alcoholic fatty liver disease are still unclear. NAFLD is a complex and multifactorial disease due to the spectrum of liver pathologies. The different NAFLD stages are well characterized, but the mechanisms contributing to these manifestations throughout the disease progression are still theories. Indeed, a ‘’two-hit hypothesis’’ was proposed over two decades ago, explaining the pathogenesis of NAFLD (36). The first hit is fat accumulation in hepatocytes, with evidence of systemic and hepatic insulin resistance (37). The insulin resistance results from unhealthy diets, sedentary lifestyle combined with environmental and genetic factors. This insulin resistance and hepatic lipid accumulation leads to alterations of metabolic functions in the liver, adipose tissue and muscle (38). This is concomitant with a defect in the hepatic lipid clearance, such as efflux of cholesterol-related lipids or inefficiency in fatty acid β-oxidation (39). The second hit can come from multiple mechanisms, all potentially contributing to the progression from NAFLD to non-alcoholic steatohepatitis (NASH). Liver metabolism that is disrupted by excessive lipid content and insulin resistance becomes vulnerable to other insults. These second insults consist of oxidative stress, increased inflammatory signaling, fibrosis development and/or
genetic susceptibility. Disruption of these biological pathways greatly impacts liver metabolism and homeostasis, worsening of the disease (38). Here follows, the main biological pathways involved in the pathogenesis of NAFLD.
Lipid metabolism
As mentioned, sedentary lifestyle and unhealthy diets such as high sugars and high fat diets can induce insulin resistance. Insulin normally inhibits adipose tissue lipolysis and promotes fatty acid storage into triglycerides. The insulin resistance observed in NAFLD induces free fatty acid (FFA) release into the blood from the adipose tissue lipolysis. This increase FFA in the blood is taken by the liver, where the hepatic insulin resistance induces hepatic de novo lipogenesis and hypertriglyceridemia and disruption of the triglycerides secretion through cholesterol-related lipoproteins (40).
Mitochondrial dysfunction
In the early phases of hepatic fat accumulation, mitochondrial activity is increased as an adaptive response to the fatty acid influx. This compensation results in enhanced transformation of free fatty acids into triglycerides stocks to prevent lipotoxicity (41). However, long-term and excessive fat influx can overload the mitochondria and leads to disruption of fatty acid β-oxidation (FAO) and the electron transport chain (ETC). (42). Multiple studies show evidence of mitochondrial dysfunction and decreased expression of fatty acid β-oxidation and electron chain transport pathways in diabetic and NAFLD patients (42-44).
Oxidative stress
Long-term excessive lipid accumulation leads to alterations in mitochondrial activity and structure. Imbalances in the mitochondrial respiratory chain activity can cause accumulation of reactive oxygen species (ROS) (45). This ROS accumulation induces oxidative stress, leading to lipid peroxidation and mitochondrial DNA damage. In some cases, genetic factors contribute to decrease expression of ROS detoxification enzymes, leading to more oxidative damage. This
hepatic impairment known as a hallmark of NASH, is now considered as the central process in the development and progression of NAFLD (41).
Inflammation
Bacterial lipopolysaccharides can enter the circulation due to a leaky gut (related to diet). These reach the liver and bind to the toll-like receptor 4 (TLR4) at the surface of hepatocytes and can also activate Kupffer cells, the hepatic immune cells, causing secretion of pro-inflammatory cytokines (38). In addition to these extrahepatic sources of inflammation, production of toxic or inflammatory metabolites can occur due to inappropriate hepatic fat accumulation. This also induces the release of inflammatory cytokines, such as TNF-α and IL-6 from hepatocytes and resident immune cells, leading to activation of inflammation signaling via NF-κB and STAT3 transcription factors in hepatocytes (38, 46).
Genetic predispositions
Family and twin studies suggest that NAFLD development can be inheritable (47). Moreover, epidemiologic studies found an ethnic susceptibility to NAFLD and NASH. Based on these observations, multiple genome-wide associated studies were designed to identify genetic factors including single nucleotide polymorphisms (SNP). The strongest single nucleotide polymorphism to correlate with NAFLD is the PNPLA3 I148M variant, which encodes patatin-like phospholipase domain containing 3 protein, involved in triglyceride remodeling. Furthermore, the transmembrane 6 superfamily member 2 (TM6SF2) E167K variant is also associated with NAFLD, as well as NASH and fibrosis development (48). This gene encodes a protein involved in triglyceride secretion through very low-density lipoproteins (VLDL). The glucokinase regulator (GCKR) P446L variant is also one of the most known genetic factors for NAFLD, NASH and fibrosis. This protein regulates de novo lipogenesis and glucose uptake.
As NAFLD development in humans is often associated with mitochondrial dysfunction, multiple studies have investigated the association between genetic variants of the peroxisome proliferator-activated receptor y coactivator-1a gene (PPARGC1A) and NAFLD. Briefly,
PPARGC1A encodes the PGC-1α protein, a transcriptional coactivator that induces genetic
pathways involved in hepatic gluconeogenesis, mitochondrial function and detoxication of reactive oxygen species (49). It is reported that the PGC-1α Gly482Ser variant (PPARGC1A rs8192678 1444G>A) is associated with diabetes, obesity and NAFLD (50, 51).
Peroxisome proliferator-activated receptor gamma coactivator-1
PGC-1 family members
The peroxisome proliferator-activated receptor gamma coactivators-1 is a family of three members, PGC-1α, PGC-1β and the PGC-1-related coactivator (PRC) (52). The PGC-1 proteins are known as transcriptional coactivators, binding and coactivating transcription factors or nuclear receptors for regulation of gene expression (53). PRC is expressed ubiquitously, while PGC-1α and PGC-1β are expressed mainly in tissues with high energy demands such as the brain, kidney, muscle, liver, brown adipose tissue and pancreas (52). PGC-1α and PGC-1β are well known to coactivate nuclear respiratory factor 1 (NRF-1) and 2 (NRF-2), peroxisome proliferator-activated receptor alpha (PPARα) and gamma (PPARγ), estrogen-related receptor alpha (ERRα) and thyroid hormone receptor (TR). These transcription factors are involved among others, in regulating energy metabolism and mitochondrial genes (54). Even though PGC-1α and PGC-1β are structurally similar, regulate many of the same biological pathways, and are expressed in many of the same tissues, they can have distinct functions (52, 54, 55). Some studies suggest PGC-1β is involved in the basal mitochondrial activity, while PGC-1α is involved in the adaptive response and increasing mitochondrial biogenesis when needed (55). Moreover, PGC-1α is involved in adaptive thermogenesis in the brown adipose tissue, hepatic gluconeogenesis, lipid catabolism and muscle development, while PGC-1β is reported to regulate hepatic lipid synthesis and lipoprotein production (54, 56, 57).
Tissue-specific functions of PGC-1α
body PGC-1α knock-out mouse presented abnormalities in the brain, with decreased expression of genes involved mitochondrial activity and ROS detoxification (59). It is reported that PGC-1α gene levels decrease in the brains of Alzheimer and Parkinson’s patients (60-62). In the muscle, PGC-1α is best known to be induced by exercise and is involved in development of specific type of muscle fibers. As muscle cells contain a great number of mitochondria that are dynamically regulated, PGC-1α-mediated regulation of mitochondrial biogenesis is crucial (63). PGC-1α also promotes angiogenesis around skeletal muscle cells, to facilitate mitochondrial oxygen exchange (64). In adipose tissue, PGC-1α is involved in the transformation of white adipose cells into brown adipocytes. This mechanism consists in PGC-1α coactivating the transcription factor PPARγ, leading to an increase in Ucp1 expression, a thermogenesis activator (65). In the liver, PGC-1α is normally expressed at low levels but is induced by glucagon during the fasting state. It is involved in an array of biological pathways, but is mainly involved in hepatic glucose metabolism, mitochondrial biogenesis, oxidative and lipid metabolism (58, 60, 66). Since this project focuses on non-alcoholic fatty liver disease, here are described the main biological pathway in which PGC-1α is involved in the liver.
Gluconeogenesis
Hepatic expression of PGC-1α is induced by CREB and cAMP during fasting-mediated glucagon signaling, leading to coactivation of hepatic nuclear factor-4a (HNF4α), glucocorticoid receptor (GR) and forkhead box o1 (FoxO1). These transcription factors are responsible for regulating expression of phosphoenolpyruvate carboxykinase (Pepck) and glucose-6-phosphatase (G6pc), involved in gluconeogenesis under the fasting state (53, 67).
Mitochondrial biogenesis and oxidative metabolism
As mentioned above, PGC-1α is involved in mitochondrial biogenesis and coactivates nuclear respiratory factors (NRF-1 and 2), transcription factor A, mitochondrial (TFAM) and transcription factor B (TFB). These proteins regulate mitochondrial genes involved in mitochondrial fusion/fission process and mitochondrial DNA transcription (60, 68). During the fasting state, the liver accumulates lipids due to an influx of free fatty acids from adipose tissue
lipolysis. This hepatic lipid accumulation leads to activation of fatty acid β-oxidation, the TCA cycle and the electron transport chain pathway to process sugars and lipids to produce energy (69). Increased mitochondrial metabolism is induced by PGC-1α, well known to promote the expression of genes involved in mitochondrial function in high energy demands such as fasting (68, 69).
Lipid metabolism
Moreover, a few studies investigated the impact of PGC-1α levels on lipoprotein transport. Overexpression of PGC-1α in rats increase the mitochondrial fatty acid β-oxidation which followed a decrease in triglycerides storage and transport (69). This is accompanied with decreasing levels of apolipoprotein B (ApoB) and microsomal triglyceride transfer protein (Mttp), proteins involved in triglyceride secretion (69). In contrast, it is shown that overexpression of PGC-1α using adenoviral injection in mice leads to increase expression of apolipoprotein A4 (ApoA4), apoliprotein C2 (ApoC2) and apolipoprotein C3 (ApoC3) and increases the circulating very low-density lipoprotein complex in the blood (70). These results show that PGC-1α not only influences the lipid catabolism, but also the lipid transport.
ROS detoxification
Finally, increase expression of PGC-1α promotes the fatty acid β-oxidation. However, the increase in β-oxidation, followed by energy production leads to increasing amounts of reactive oxygen species (ROS) that can be toxic to the cell. Interestingly, it is reported that PGC-1α regulates the gene expression of ROS detoxification enzymes such as Sod2 and Gpx1, while still inducing fatty acid β-oxidation (71). These multiple tissue-specific functions highlight the importance and the complexity of PGC-1α regulation in the whole-body energy metabolism.
PGC-1α and metabolic diseases
Genetic disruption of PGC-1α can have serious repercussions on whole body. An array of studies reports a link between PGC-1α deficiency in different tissues and metabolic diseases
with T2D and NAFLD development as mentioned above. The SNP PPARGC1A Gly482Ser induces a glycine to serine substitution that impacts the PGC-1α function and conformation (50, 57). The PGC-1α 482Ser allele has higher risks to develop type 2 diabetes (T2D) and insulin resistance compared to the subjects with the 482Gly allele as observed in the Danish and Japanese population (50, 51). Based on these observations, a study from our lab showed that the Ser482 of PGC-1α has a shorter half-life than the glycine variant (58). Epigenetic modifications of PPARGC1A gene are associated with NAFLD hallmarks (47). DNA methylation of
PPARGC1A correlate with insulin resistance and negatively correlate with the mRNA levels of PPARGC1A, suggesting a decrease in transcription. In human patients, increased DNA
methylation of PPARGC1A gene is associated with NAFLD development (47). Taking all these data, this suggest that reduced hepatic PGC-1α expression may be associated NAFLD and type 2 diabetes development.
Indeed, PGC-1α protein levels are decreased in tissues of diabetic patients and subjects with familial history of diabetes (43). Other studies show that decreased PGC-1α protein levels in diabetic muscle correlate with a decrease in the oxidative phosphorylation genes (44). This decrease in oxidative phosphorylation and mitochondrial-related pathways are also observed in livers of NAFLD patients (72). Many studies investigate the link between mitochondrial dysfunction, PGC-1α expression and NAFLD development. Interestingly, the decrease in mitochondrial-related genes reported in NAFLD subjects, such as the fatty acid β-oxidation and the electron transport chain programs, is concomitant with decreased mRNA and proteins levels of PGC-1α (42, 73). Moreover, PGC-1α mRNA levels are decreased in livers of NAFLD patients and further decreased in livers of obese subjects with NAFLD or NASH (74, 75). These observations suggest that PGC-1α may be important in the adaptive response to metabolic challenges, in promoting the fatty acid β-oxidation and lipid metabolism. Disruption of hepatic PGC-1α levels may increase the susceptibility to develop metabolic diseases such as NAFLD (76).
PGC-1α loss-of-function murine models
Multiple studies have investigated whether PGC-1α is involved or has a causative role in the development of metabolic diseases. A loss-of-function model of PGC-1α was generated, the PGC-1α-/- null mice, to study the importance of PGC-1α function in metabolic adaptation and
mitochondrial function as mentioned (59). These PGC-1α-/- null mice have decreased muscle
performance and exercise capacity, decreased hepatic glucose production; however, there is evidence of improved insulin sensitivity compared to wildtype mice (66, 77). The complete loss of PGC-1α also affects body temperature regulation of these mice (78). Moreover, short-term starvation induced hepatic steatosis with decrease in mitochondrial activity and increase in lipogenesis (59). However, this mouse model has its limitations and caveat. The PGC-1α-/- null
mice are protected from the diet-induced insulin resistance and obesity since they are lean. This is likely due to the mice hyperactivity and increased energy expenditure (77). This hyperactivity is the result of lesions observed in the brain, more precisely in the stratium region involved in the motor coordination (78). This mouse model not only shows how PGC-1α is important and plays different functions in different tissues, but also how a whole-body knock-out of PGC-1α mice may not be the most informative model. A tissue-specific approach is suggested to better study the tissue-specific function of PGC-1α (78, 79).
To study the impact of PGC-1α levels in liver metabolism, a liver-specific PGC-1α heterozygous mice (LHet) exists. This is achieved by crossing mice harbouring a floxed PGC-1α allele (PGC-1αfl/+) with a transgenic mouse expressing Cre-recombinase under the albumin promoter. This
generated a mouse with only one allele expressing PGC-1α with the other allele disrupted only in hepatocytes (80). The liver-specific reduction of PGC-1α by 50% reflects best the human
data, since only decrease hepatic PGC-1α levels and not complete absence is observed in NAFLD. After 24 hours of fasting, LHet mice develop steatohepatitis, with increased hepatic triglycerides and cholesterol levels (59). Moreover, these mice developed early hallmarks of NAFLD, such as decreased expression of fatty acid β-oxidation genes and altered insulin sensitivity in liver (80). These findings provide novel potentially causative role for hepatic
PGC-A study from our lab shows that levels of PGC-1α in the liver negatively correlates with NPGC-AFLD severity in mice (58). This is consistent with human studies reporting a decrease in PGC-1α levels in livers of NAFLD and NASH patients (75). Previous work in our lab investigated the long-term impact of reduced PGC-1α on the fatty liver disease progression mediated by prolonged diet-induced obesity (58). When fed a long-term obesogenic diet, mice have accelerated NAFLD progression with evidence of increased oxidative stress, inflammation and weight gain. This study reveals PGC-1α as an important actor in the ROS detoxification process. They show that PGC-1α is expressed more in females than male mice because in females, it is essential for the estrogen-dependent antioxidant gene expression. These findings explain why liver heterozygote for PGC-1α female mice have higher ALT levels, more oxidative liver damage and lipid content than wildtype female littermates. Female mice are more sensitive to the hepatic loss of PGC-1α because of its role in the estrogen-mediate ROS detoxification. These findings show how PGC-1α is crucial in modulating the metabolic adaptation in a context of NAFLD development (58).
PGC-1α impacts the cell secretome
Decreased hepatic PGC-1α levels reported to improve the whole-body glucose metabolism and insulin sensitivity in mice compared to control littermates (81). Interestingly, when PGC-1α reduction is liver-specific, mice have increased glucose uptake in the white adipose tissue (WAT) and the muscle. Thus, the authors analyzed the liver secretome to find a secreted factor involved in the peripheral glucose metabolism. They noticed increased expression and circulating levels of the fibroblast growth factor-21 (FGF-21), a known secreted hormone from the liver involved in improving the peripheral insulin sensitivity. Levels of FGF-21 are increased in a dose-dependent manner in livers of liver-specific PGC-1α knock-out (LKO) and LHet mice, potentially explaining why these mice have better glucose tolerance. These results provide a novel role for PGC-1α in regulating the liver secretome and thereby influencing the whole-body energy metabolism.
This novel role for PGC-1α in regulating organ secretome correlates with another study demonstrating how PGC-1α levels influences the expression of multiple secreted proteins in different cell lines (82). Using loss-of-function of PGC-1α using knock-out cells and gain-of-function adenoviral overexpression, the expression of known secreted proteins were measured in brown adipocytes, fibroblast, myocytes and hepatocellular carcinoma cell lines. In general, overexpression of PGC-1α in cell lines decreased the expression of secreted factors, while knock-out of PGC-1α increased their expression compared to wildtype littermates (82). This study concludes that PGC-1α levels highly influence the cell secretome by altering expression of secreted and extracellular matrix (ECM) proteins.
Preliminary results
Previous work from a former student in our lab investigated how low hepatic PGC-1α levels combined with western diet-mediated NAFLD in mice altered the liver secretome (83). Mice with specific 50% reduction of PGC-1α (liver-specific heterozygote LHet) and hepatic-specific knock-out of PGC-1α (liver-hepatic-specific knock-out LKO) using the cre/lox recombinase technology under the control of the albumin promoter (80, 81). This ensured that the genetic disruption of PGC-1α is hepatocyte-specific and contamination of signals from other cell types was minimized. Primary hepatocytes isolated from wildtype (WT), LHet and LKO mice fed chow or high-fat, high-fructose (HFHF) diet for six weeks were maintained in cellular culture. After 16 hours of incubation in vitro, the cells maintained their metabolic profiles and the cell culture conditions were optimal to reflect the physiological liver cell secretome. The conditioned media containing all secreted factors was collected and analyzed by mass spectrometry using isobaric tags for relative and absolute quantification (iTRAQ). This hepatocyte-specific secretome analysis reduced the contamination of abundant blood proteins and ensured these secreted factors were liver specific (83). This work identified hepatokines whose expression were altered by hepatic PGC-1α levels, the high-fat, high-fructose diet or the combination of both conditions.
both conditions (Figure 2) (83). SERPINA3N secreted levels increased in wildtype mice fed high-fat, high-fructose diet (HF-WT) compared to chow fed mice (CH-WT). SERPINA3N secreted levels were also basally increased in LHet and LKO mice fed chow diet compared to wildtype littermates. However, LHet and LKO mice fed HFHF diet had decreased SERPINA3N levels compared to wildtype fed HFHF diet; thus, mice lacking PGC-1α lacked the adaptive upregulation of SERPINA3N that occurs in wild-type mice in response to western diet. Thus, we chose SERPINA3N for further investigation based on the robust changes of its expression between experimental conditions, and it was significantly influenced by the interaction of the HFHF diet and the genotype. SERPINA3N is a serine protease inhibitor and an acute phase protein induced by multiple cytokines. It is involved in wound healing, secreted in glucocorticoid-mediated muscle atrophy and highly expressed in various cancers (84-88). Based on these preliminary in vitro results and the robustness of SERPINA3N changes and how the interaction of diet and decreased PGC-1α levels influences SERPINA3N secreted levels, we further investigated on this protein. The link between SERPINA3N circulating levels and hepatic PGC-1α in a context of NAFLD is still yet to discover.
Figure 2. - SERPINA3N secreted levels in conditioned media.
(A) SERPINA3N levels in conditioned media measured with isobaric tags for relative and absolute quantification by mass spectrometry (ITRAQ-LC-MS/MS). CD: Chow diet, HF: High-fat, high-fructose diet, WT: wildtype, LHet: liver-specific PGC-1α heterozygote, LKO: liver-specific PGC-1α knock-out. **** P<0.0001, **P<0.01, $$ P<0.01, #### P<0.0001, ## P<0.01, &&&&
Research objectives
Based on previous findings showing that low hepatic PGC-1α levels are associated with NAFLD development and influences the peripheral metabolism through alteration of the liver secretome, we are interested in investigating how hepatic PGC-1α is involved in NAFLD development through modulation of hepatokine expression. This project will allow to better understand how hepatic PGC-1α levels impacts the whole-body metabolism and determine whether SERPINA3N circulating levels are responsible for this impact. Moreover, since SERPINA3N is not well-known in metabolic disease, this may help to reveal if PGC-1α-mediated SERPINA3N secretion is protective or contributing to NAFLD progression. But first, we need to determine if hepatic PGC-1α levels is can induce significant changes in SERPINA3N circulating levels in mice serum, as observed in the preliminary in vitro results.
Based on these results, we hypothesize that circulating SERPINA3N levels in mouse serum will correlate with hepatic PGC-1α levels and be influenced by the western diet.
In the present study, we provided evidence that hepatic PGC-1α influences the secreted levels of SERPINA3N differently in response to metabolic challenges, revealing a potentially novel function for the transcriptional co-activator in the adaptive and acute phase response. We reported that circulating SERPINA3N levels in mouse serum reflected the hepatocyte-specific secretome previously observed in vitro, and that its levels correlated with hepatic PGC-1α expression in a diet and sex-dependent manner in vivo. Moreover, Serpina3n hepatic expression was greatly influenced by PGC-1α levels. SERPINA3N secretion was independent of NF-κB and in contrast, induced by glucocorticoids. This glucocorticoids-mediated regulation of SERPINA3N was influenced by PGC-1α levels, revealing a novel interaction between glucocorticoids and PGC-1α in hepatic protein regulation. This study reveals SERPINA3N as a potential blood indicator of low hepatic PGC-1α in context of NAFLD susceptibility and PGC-1α possibly involved in regulating the acute phase response to high-fat, high fructose feeding.
Animal models
Previously generated conditional floxed Ppargc1a knockout (KO) mice (B6.129-Ppargc1a
tm2.1Brsp/J or Pparg1caf/f) bred with Tg(Alb-cre)21Mgn/J (Alb-cre+/0) mice expressing Cre
recombinase under hepatocyte-specific albumin promoter were used (Estall, JL, 2009). From this mouse model, we generated Alb-cre+/0 control mice (Ppargc1a+/+), floxed control
(Ppargc1af/+ Alb-cre0/0), liver-specific heterozygote mice (LHet: Ppargc1af/+Alb-cre+/0) and
liver-specific knockout mice (LKO: Ppargc1af/fAlb-cre+/0).
Mouse housing and diets
Male and female mice were fed regular chow (18% fat, 24% proteins and 58% carbohydrates, #2918, Teklad Global diet 2018, Envigo) or high fat, high sucrose diet (45% fat, 20% protein and 35% carbohydrates, D12451I; Research diets Inc, New Brunswick, NJ) supplemented with 30% D-fructose in drinking water (HFHF) for 6 weeks (n=7 per condition) or 25 weeks (n=4 per condition) starting from 10 weeks of age. Animals were allowed ad libitum access to food and were maintained at 22°C (12-hour light to 12-hour dark cycle). Mice were weighed at 9 weeks of age to normalize weight distributions between groups before starting the diets. Sub-mandibular bleeds were performed every two weeks (week 0, 2, 4 and 6) after start of diets. All blood samples coagulated at 4°C for 1 hour before centrifugation at 3000 rpm for 5 minutes at 4°C. Serum was collected and conserved at -80°C. All experiments were performed in accordance with the Institut de Recherches Cliniques de Montreal (IRCM) Animal Facility Institutional Animal Care and Use Committee regulations.
Primary hepatocytes isolation
Primary mouse hepatocytes were isolated by a 2-step liberase perfusion (Liberase TL; Roche, Indianapolis, IN) and 50% Percoll gradient purification. Cells were plated in monolayers and cultured in Dulbecco’s modified Eagle’s low glucose medium (5.5 mM glucose) supplemented with 2 mM sodium pyruvate, 0.1 μM dexamethasone, 1% penicillin/streptomycin and 1 nM insulin for up to 48 hours. The non-adherent cells were removed by changing the media after 2
hours in media with no bovine serum albumin (BSA) (maintenance media) containing low glucose (5.5 mM), 2.5 mM insulin and 100 nM dexamethasone. Before treatments, all cells were starved in starvation media containing low glucose (5.5 mM), without dexamethasone, BSA or insulin.
Cell culture and treatments
Primary hepatocytes (n=3) were infected with adenovirus expressing either control vector encoding for the green fluorescent protein (GFP) (1 uL/mL) or PGC-1α (3 uL/mL) as previously explained (Estall, JL, 2009). To assess the impact of glucocorticoid on Serpina3n expression, primary hepatocytes were treated with 1 uM of dexamethasone for 8 hours or vehicle (starvation media). For assessment of the NF-κB activity, we used JSH-23, an inhibitor of the p65 subunit, blocking its translocation to the nucleus. Primary hepatocytes were treated with 10 uM of JSH-23 or the corresponding volume of DMSO (vehicle) as control for a duration of 6 hours. For all treatments, the concentration of reagents and time of incubation were chosen from previous optimized experiments (Supplementary figure 1 and 2).
Conditioned media
Conditioned media from primary hepatocytes was harvested, centrifuged full speed for 20 minutes to remove debris. Clean conditioned media was then concentrated using Amicon Ultra-2 mL kit (Centrifugal Filters, #UFCUltra-2003Ultra-24 Millipore). Conditioned media (Ultra-2 mL) was added to filter device with filtrate collection tube and centrifuged at 4000 x g for 3 minutes. The concentrated conditioned media was recovered by centrifuging upside down the filter device in concentrate collection tube at 1000 x g for 2 minutes. For optimal concentration, samples were than evaporated in SpeedVac evaporation concentrator for 90 minutes or until pellet formation. Samples were resolubilized with radioimmunoprecipitation assay (RIPA) buffer containing protease and phosphatase inhibitors.
Protein isolation and immunoblotting
Hepatic and serum proteins were solubilized in RIPA buffer with protease (100X) and phosphatase inhibitors. Samples are added to 10% sodium dodecyl sulfate polyacrylamide gel electrophoresis (SDS-page electrophoresis) or TGX Stain-free FastCast Acrylamide gels (10%, Bio-Rad, #1610183) for protein separation, then transfered on nitrocellulose membranes and probed with primary and secondary antibodies. Quantification of images was performed using ImageJ software and ImageLab (Bio-rad) (Supplementary Table 1 for antibodies).
Histology
Liver tissues were fixed with 10% neutral buffered formaldehyde for 24 h prior to being embedded in paraffin and sectioned onto 5 um slides. The histology slides were then stained with hematoxylin and eosin (H&E).
Hepatic lipids quantification
Frozen liver tissue was solubilized in 2:1 chloroform:methanol, dried overnight and purified lipids resuspended in 60% butanol: 40% TritonX114: methanol (2:1). Total triglycerides were measured colorimetrically with the Total triglyceride reagent kit (Sigma-Aldrich, St-Louis, MO). The glycerol values were subtracted from the triglyceride value to obtain the acyl-glycerol content.
RNA isolation and RT-qPCR
RNA was isolated from frozen liver tissue or cultured cells using TRIzol reagent. DNase treatment was performed on 1 μg of RNA with DNase I to be then reverse transcribed using a High Capacity Reverse Transcription kit (Applied Biosystems, Carlsbad, CA). Following generation of complementary DNA (cDNA), expression of mRNAs was quantified using the Life Technologies Viaa7 real-time PCR system using SYBR green PCR master mix and the ΔΔCT threshold cycle method of normalization. Gene expression levels were normalized to
hypoxanthine-guanine phosphoribosyltransferase (Hprt) messenger RNA (mRNA) and expressed relative to control (Supplementary Table 2 for primer sequences).
Serum depletion
Serum samples were depleted of the 7 most abundant serum proteins (Albumin, a1-Antitrypsin, Transferrin, Fibrinogen, IgG, IgM, Haptoglobin) using the Seppro Mouse Spin Columns kit (#SEP110, Sigma-Aldrich). 150 ug of serum proteins were depleted using 50 mM Triethylammonium bicarbonate (TEAB) (#T7408, Sigma-Aldrich) with 150 mM NaCl as buffer to elute proteins and wash columns as described in the kit protocol. The elution fraction was evaporated using the SpeedVac evaporation concentrator until pellet formation. Protein concentrates were reconstituted in radioimmunoprecipitation assay (RIPA) buffer containing protease and phosphatase inhibitors for SDS-page electrophoresis.
Statistical analysis
Data were analyzed using Graphpad Prism 8.0.1 (San Diego, CA) software. Two-way ANOVA was used for mean comparisons followed by Tukey post-hoc tests corrected for multiple comparisons. We used multiple t-tests corrected for multiple comparison using the Holm-Sidak method. Threshold for statistical significance was P<0,05. Data are expressed as mean ± SEM.
NAFLD mouse model validation and simple steatosis characterization.
Low hepatic levels of 1α correlate with NAFLD severity and decreased expression of PGC-1α in the liver influences whole-body metabolism by altering the expression of hepatic secreted factors (81). Our preliminary data in vitro experiment revealed that secreted SERPINA3N levels correlated with PGC-1α levels and that this was influenced by a 6-week HFHF diet in cultured cells. We wanted to determine if hepatic disruption of PGC-1α levels induces significant changes in SERPINA3N circulating levels in mouse serum in vivo and if diet still influences the secreted levels of this hepatokine in blood.
To test this, we used the cre/lox technology driven by the hepatocyte-specific albumin promoter to generate liver-specific heterozygote and liver-specific PGC-1α knock-out mice (80, 81). Our mouse cohort was composed of albumin-cre expressing mice as wildtype controls (WT), liver-specific heterozygote of PGC-1α (LHet) and liver-specific PGC-1α knock-out mice (LKO). Both male and female mice were fed chow diet or high-fat, high-fructose (HFHF) diet for six weeks. First, we measured Ppargc1a, the gene encoding the PGC-1α protein, to assure the efficiency of the knock down in liver (Figure 3A). Hepatic Ppargc1a mRNA levels were not affected by the diet in both males and females. As previously shown, Ppargc1a basal mRNA levels in the liver was higher in females compared to males (58). As expected, hepatic Ppargc1a mRNA levels decreased by approximately 50% in LHet and were undetected in LKO to the same extent in both sexes.
Next, we characterized the liver phenotype of our mice in order to identify at which stage of the NAFLD spectrum these mice had developed after 6 weeks of HFHF diet. We first measured hepatic acylglycerol content. Livers from male mice fed HFHF diet had a mild but significant increase in hepatic lipid content compared to chow diet fed wildtype mice and this increase was independent of the loss of PGC-1α (Figure 3B). Livers of females fed HFHF diet also showed a mild but significant accumulation of hepatic acylglycerol as observed in males. In addition, liver-heterozygote (LH) females fed HFHF diet showed significantly higher hepatic lipid content compared to wildtype and liver knock-out littermates, as previously observed in published
results (58). We next stained liver sections with hematoxylin and eosin (H&E) (Figure 3C and D). We observed no visible difference in lipid content between genotypes in mice fed chow diet. Livers from wildtype male mice fed HFHF diet presented with microvesicular steatosis (white arrows) with slight evidence of cell ballooning and inflammatory cells infiltration (black arrows), but this was not observed in wildtype female livers. Livers from LHet and LKO male and female mice fed HFHF diet presented with macrovesicular and microvesicular steatosis (white arrows) across the liver sections, with more pronounced phenotype in males (89). We also noticed cell ballooning and the beginning of lobular inflammation with inflammatory cells lining on the wall of few blood vessels.
Altogether, these observations revealed that male mice appeared more affected by the diet, based on hepatic histopathological phenotype after 6 weeks. Even if females accumulated as much hepatic acylglycerol as males, their livers presented less histopathological NAFLD characteristics, suggesting that females may be protected from the effects of obesogenic diet and that the higher levels of PGC-1α may be responsible for this protection. This correlate with human data showing that men are more affected and develop NAFLD earlier than women (90). The steatosis development was more remarkable in males with decreased hepatic PGC-1α levels compared to wildtype males and females.
Figure 3. - Histological characterization of male and female mice livers.
(A) Measurement of hepatic Ppargc1a gene expression by qPCR, n=7 (B) Intrahepatic total acylglycerol content at 6 weeks, n=7. (C) Hematoxylin and eosin (H&E) staining of liver sections from male mice, n=3 and (D) female mice, n=3. WT: wildtype, LHet: liver-specific PGC-1α heterozygote, LKO: liver-specific PGC-1α knock-out and HFHF: high-fat, high-fructose diet. Macro and microvesicular steatosis = white arrows, immune cell infiltration = black arrows. ****P<0.0001, ***P<0.001, **P<0.01, *P<0.05. Histology magnification = 10X.
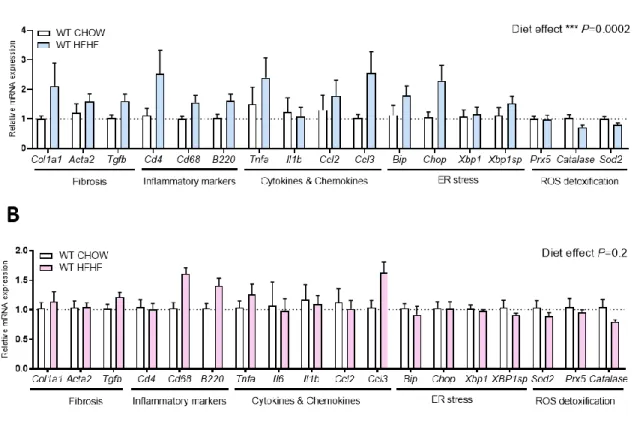
The hepatic expression of genes involved in NAFLD development.
We measured mRNA expression levels from different pathways previously identified as hallmarks of NAFLD progression in order to determine if the fat accumulation previously observed in the livers induced activation of pathways involved in NAFLD progression. We looked at five different pathways reported to be involved in the pathogenesis of NAFLD development: fibrosis formation, immune cell infiltration markers, inflammatory cytokines and chemokines, endoplasmic reticulum (ER) stress and ROS detoxification (38). For each of these five pathways, we measured key genes such as Col1a1, Acta2 and Tgfβ1 for fibrosis formation,Cd4, Cd8 and B220 for immune cell infiltration markers, Tnfα, Il-1b, Il-6, Ccl2 and Ccl3 for
inflammatory cytokines and chemokines, Bip, Chop, Xbp1 and Xbp1 spliced for ER stress and finally Prx5, Cat and Sod2 for the ROS detoxification pathway.
Investigating the impact of diet first, we compared hepatic gene expression of wildtype mice fed CHOW or HFHF diet for 6 weeks. In male mice, we noticed a significant general diet impact on fibrosis, inflammation, cytokines and chemokines and ER stress markers, however we observed no significant changes in individual gene expression (Figure 4A). In females, we noticed a trend toward increase in Cd68 and B220 inflammatory cell infiltration markers and in
Ccl3 cytokine gene expression. However, no genes changed significantly in response to HFHF
diet (Figure 4B). Moreover, gene expression of antioxidant enzymes were not affected by the HFHF diet at 6 weeks in both males and females (58). We did not observe any changes in expression of any of these genes in LHet or LKO, male and female mice fed CHOW compared to their wildtype littermates (Supplementary figure 3).
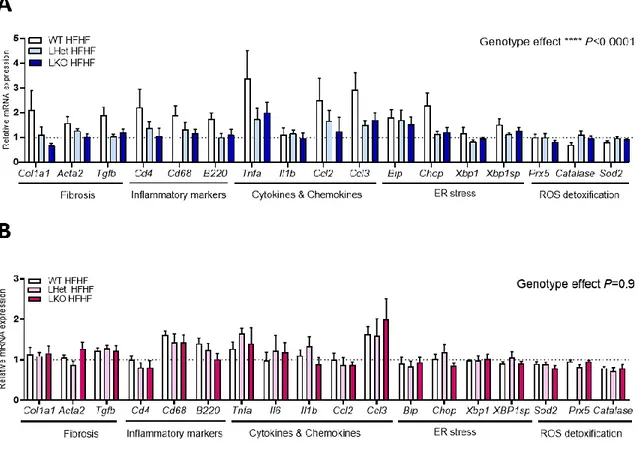
We next investigated the impact of the liver-specific disruption of PGC-1α and diet on hepatic gene expression, since it was reported that low PGC-1α levels in the liver combined with a western diet contributes to accelerated NAFLD progression (58). In males fed HFHF diet, we noticed a significant genotype impact on fibrosis, cell infiltration markers, inflammatory cytokines and ER stress markers (Figure 5A). Livers from LHet and LKO mice had a trend toward
expression was similar to the gene expression observed in livers from CHOW fed control mice (see doted line). In females, the hepatic gene expression is not affected by the genetic disruption of PGC-1α. We only noticed a non-significant diet impact on cell infiltration markers,
Cd68 and B220, inflammation marker Tnf-α and Ccl3, regardless of genotype. (Figure 5B).
These results revealed that the hepatic gene expression of wildtype male mice was influenced by the HFHF diet. Interestingly, livers of LHet and LKO male mice fed HFHF diet had opposite expression of key genes of fibrosis, inflammatory cytokines and ER stress pathways than what observed in livers of wildtype mice. The expression of these genes decreased to basal levels. This suggests that male livers with decreased expression of PGC-1α may not adapt properly to the hepatic metabolic challenge induced by western diet after 6 weeks. In contrast, livers from wildtype females had no significant changes in key genes of the fibrosis, immune cell infiltration, inflammatory cytokines, ER stress and antioxidation pathways in response to hepatic disruption of PGC-1α and diet. This suggests that female mice may be more resistant to hepatic loss of PGC-1α and diet-induced steatosis at 6 weeks.
Finally, based on the hepatic lipid content, the histological characterization and measurements of genes involved in NAFLD development and progression, we were able to define which part of the NAFLD spectrum of liver pathologies these mice have developed. There was no evidence of significant activation of inflammation and fibrosis formation at the gene level, but livers of male mice showed more histopathological NAFLD characteristics compared to females, even if both showed similar acylglycerol accumulation. This suggests that both males and females were starting to develop early NAFLD, the fatty liver after 6 weeks of HFHF diet.
Figure 4. - Impact of diet on hepatic expression of genes involved in NAFLD development. (A) Hepatic gene expression by qPCR in wildtype males fed chow or high-fat, high-fructose diet for 6 weeks. (B) Hepatic gene expression by qPCR in wildtype females fed chow or high-fat, high-fructose diet for 6 weeks. WT: wildtype, LHet: liver-specific PGC-1α heterozygote and LKO: liver-specific PGC-1α knock-out. Normalized to housekeeping gene HPRT. Diet overall impact on pathways, males= ***P=0.0002, females = P=0.02. Mice per condition, n=7.
Figure 5. - Impact of hepatic disruption of PGC-1α and diet on gene expression at 6 weeks. (A) Hepatic gene expression by qPCR in WT, LHet and LKO male mice fed high-fat, high-fructose diet for 6 weeks. (B) Hepatic gene expression by qPCR in WT, LH and LKO female mice fed high-fat, high-fructose diet for 6 weeks. WT: wildtype, LHet: liver-specific PGC-1α heterozygote and LKO: liver-specific PGC-1α knock-out. Normalized to housekeeping gene HPRT. PGC-1α overall impact on pathways males = ****P<0.0001, females = P=0.9. Mice per condition, n=7.