• Aucun résultat trouvé

From models to data: understanding biodiversity patterns from environmental DNA data

N/A
N/A
Protected

Academic year: 2021

Partager "From models to data: understanding biodiversity patterns from environmental DNA data"

Copied!
260
0
0

Texte intégral

Loading

Figure

Figure	 1.	 The	 response	 of	 ecosystems	 to	 human-induced	 stress	 is	 commonly	 studied	 using	 a	 network	 representation	 of	 ecological	 communities,	 envisioned	 as	 stable	 entities	 held	 together	 by	interactions.	Depending	on	network	connectivity	and	modularity,	the	response	may	be	linear	 (left)	 or	 exhibit	 a	 tipping	 point	 (right).	 Data-driven	 knowledge	 of	 community	 assembly	 processes	is	much	needed	to	inform	such	models.	Adapted	from	Scheffer	et	al.	(2012).
Figure	 3.	 MacArthur	 &	 Wilson	 (1967)	 were	 the	 first	 to	 combine	 dispersal	 limitation	 and	 demographic	drift	into	a	simple	model,	that	aims	at	explaining	the	number	of	species	found	on	 islands.	They	assumed	that	the	number	of	species	results	from	a	dynamic	equilibrium	between	 stochastic	immigration	and	extinction,	which	are	dependent	on	distance	to	the	mainland	and	on	 island	size,	respectively.	Adapted	from	Hubbell	(2001).
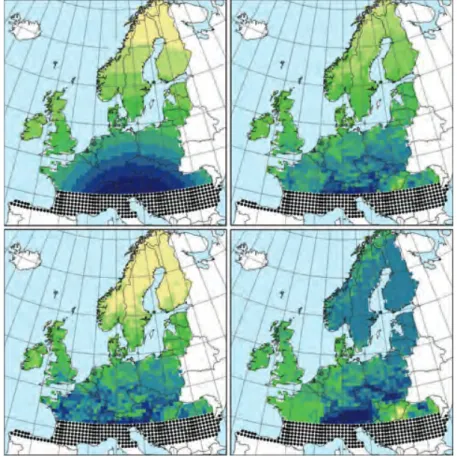
Figure	 4.	 Community	 assembly	 processes	 depend	 on	 the	 spatial	 and	 temporal	 scales	 considered:	 current	 geographical	 patterns	 of	 tree	 diversity	 in	 Europe	 might	 reflect	 on-going	 dispersal	from	ice	age	tree	refugia,	which	started	14,000	years	ago.	Top	right,	bottom	left	and	 bottom	right:	geographical	distribution	of	tree	diversity	(increasing	from	yellow	to	blue)	for	all	 60	European	tree	species,	the	45	temperate	species	and	the	15	boreal	species,	respectively.	Top	 left:	 accessibility	 through	 dispersal	 from	 ice	 age	 tree	 refugia	 (black	 dots).	 Adapted	 from	 Svenning	&	Skov	(2007).
Fig. 5.7. Preston-type plot of relative species abundance for tree species >10 cm dbh in the 50 ha BCI plot, compared with  expecta-tions from the lognormal, and from the zero-sum multinomial of the unified neutral theory, for θ = 50 and m = 0"10
+7

Références

Documents relatifs

and their related diversity metrics to the data curation strategy, we used the variance of each diversity 283. estimate, obtained across the 256 community matrices and for

Core S&T results: Some of the main components that the project delivered for the management of semantic annotations of environmental models include: Resource

We show that by using the ontology structure to tune the (ontologically related) similarity score between node pairs a i and a j , we can control the annotation signature to

Conclusion Although few Canadian family medicine residency programs reported an established ultrasound curriculum, most program directors believe that POCUS training should be

Using a role-playing game as an interface for this dialogue, we have progressively built a model to integrate both the knowledge of the local actors regarding their practices and