Neighbourhood Income and Neonatal, Postneonatal and Sudden
Infant Death Syndrome (SIDS) Mortality in Canada, 1991-2005
Nicolas L. Gilbert,
MSc,1,2Nathalie Auger,
MD, MSc,2,3Russell Wilkins,
MUrb,4,5Michael S. Kramer,
MD6ABSTRACT
BACKGROUND: Rates of infant mortality declined in Canada in the 1990s and 2000s, but the extent to which all socio-economic levels benefitted from this progress is unknown.
OBJECTIVES: This study investigated differences and time trends in neonatal, postneonatal and sudden infant death syndrome (SIDS) mortality across neighbourhood income quintiles among live births in Canada from 1991 through 2005.
METHODS: The Canadian linked live birth and infant death file was used, excluding births from Ontario, Yukon, Northwest Territories and Nunavut. Mortality rates for neonatal, postneonatal and sudden infant death syndrome (SIDS) were calculated by neighbourhood income quintile and period (1991-1995, 1996-2000, 2001-2005). Hazard ratios (HR) for neighbourhood income quintile and period were computed, adjusting for province of residence, maternal age, parity, infant sex and multiple birth.
RESULTS: In urban areas, for the entire study period (1991-2005), the poorest neighbourhood income quintile had a higher hazard of neonatal death (adjusted HR 1.24, 95% CI 1.15-1.34), postneonatal death (adjusted HR 1.58, 95% CI 1.41-1.76) and SIDS (adjusted HR 1.83, 95% CI 1.49-2.26) compared to the richest quintile. Postneonatal and SIDS mortality rates declined by 37% and 57%, respectively, between 1991-1995 and 2001-2005 whereas no significant change was observed in neonatal mortality. The decrease in postneonatal and SIDS mortality rates occurred across all income quintiles.
CONCLUSION: This study shows that despite a decrease in infant mortality and SIDS across all neighbourhood income quintiles over time in Canada, socio-economic inequalities persist. This finding highlights the need for effective infant health promotion strategies in vulnerable populations. KEY WORDS: Infant mortality; social class; sudden infant death
La traduction du résumé se trouve à la fin de l’article. Can J Public Health 2013;104(3):e187-e192.
I
nfant mortality declined in Canada from 6.5 per 1,000 live births in 1991 to 5.1 in 20001and 5.0 in 2007.2However, the extent to which all socio-economic levels benefitted from this decline is unknown.Low socio-economic status is associated with a higher risk of adverse perinatal health outcomes, particularly infant mortality.3,4 In Canada, findings vary by province and depend on the particu-lar indicator used. In Nova Scotia, low family income is associated with a higher risk of postneonatal, but not neonatal mortality.5In Québec, low maternal education and low neighbourhood income are associated with higher risks of both neonatal and postneonatal mortality, and the association between maternal education and infant mortality remains statistically significant after adjustment for covariates (including neighbourhood income quintile), while the association between neighbourhood income and infant mor-tality is no longer significant after adjustment for covariates (including maternal education).6In British Columbia, low neigh-bourhood income is associated with a higher risk of postneonatal mortality in urban but not rural areas, although the association is no longer statistically significant after adjustment for covariates.7 Thus the nature and extent of the association between indicators such as neighbourhood income and infant mortality in Canada remain unclear, and time trends in infant mortality within socio-economic strata have not been investigated.
Among causes of death, country-level data are of particular inter-est for sudden infant death syndrome (SIDS) because of widespread education efforts undertaken through the “back to sleep” campaign in Canada.8Although SIDS rates declined in Canada between 1985 and 2005,9,10trends over time by socio-economic strata have not been examined. In Québec urban areas between 1991 and 2000, poorer neighbourhoods had a higher risk of SIDS relative to richer neighbourhoods, but the low number of SIDS deaths led to statis-tically non-significant associations, and time trends were not exam-ined.4
Author Affiliations
1. Maternal and Infant Health Section, Public Health Agency of Canada, Ottawa, ON 2. Department of Social and Preventive Medicine, Université de Montréal, Montréal, QC 3. Institut national de santé publique du Québec, Montréal, QC
4. Health Analysis Division, Statistics Canada, Ottawa, ON
5. Department of Epidemiology and Community Medicine, University of Ottawa, Ottawa, ON
6. Departments of Pediatrics and of Epidemiology, Biostatistics and Occupational Health, McGill University, Montréal, QC
Correspondence: Nicolas Gilbert, Maternal and Infant Health Section, Public Health Agency of Canada, 785 Carling Avenue 6804A, Ottawa, ON K1A 0K9, Tel: 613-960-0434, E-mail: nicolas.gilbert@phac-aspc.gc.ca
Acknowledgements: The authors are grateful to Statistics Canada and to provincial and territorial vital statistics registrars for providing access to the births and deaths files, and to Juan Andrés León and Michael Tjepkema for reviewing and commenting on an earlier version of this article.
The objective of this study was to investigate differences and time trends in neonatal, postneonatal and SIDS mortality across neigh-bourhood income quintiles in Canada.
METHOD
We used data from the Canadian linked live birth and infant death file created by Statistics Canada through probabilistic linkage of birth and death registrations.11Births from 1991 through 2005 were included, except those from Ontario because of previously docu-mented concerns related to the completeness of birth registra-tions,12and those from the three territories (Yukon, Northwest Territories and Nunavut) because of a high proportion (27%) of missing postal codes. Births with non-residential postal codes were also excluded.
Maternal residential address at birth was linked to neighbour-hood-level income quintile (based on family income adjusted for family size and area of residence, as in previous studies6,7for the Canadian census closest to the birth year (1991, 1996, 2001 or 2006) using Statistics Canada’s Postal Code Conversion File Plus.13 Adjustment of income for family size and area of residence gives a better indicator of income adequacy in relation to need, since a family of four requires more resources than a family of two, and housing costs vary widely across Canada.
Neighbourhoods were defined at the lowest level for which cen-sus population characteristics were released: enumeration areas for the 1991 and 1996 censuses, and dissemination areas for the 2001 and 2006 censuses. Because neighbourhood income is a less valid marker of socio-economic status in small towns and rural areas (since rich and poor people are more likely to share postal codes), analyses were conducted separately for urban areas and for small towns and rural areas. Urban areas were defined as census metro-politan areas or census agglomerations (population 10,000 or more), while small towns and rural areas included all other areas.14 Study outcomes included neonatal death (0-27 days), post-neonatal death (28-364 days), and SIDS (0-364 days), defined as codes 798.0 and R95 of the ninth and tenth revisions, respective-ly, of the International Classification of Diseases (9 and ICD-10). Starting in 2000, ICD-10 was used for coding the underlying cause of death in Canada.
Neonatal and SIDS mortality rates were computed using live births in the denominator, while the denominator for postneo-natal mortality rates was the number of infants at risk (infants who
had survived 28 days or more). Rates were calculated for the entire population and study period, by 5-year periods (1991-1995, 1996-2000, 2001-2005) and by quintiles of neighbourhood income (based on Census data). Changes in rates between 1991-1995 and 2001-2005 were expressed as differences in deaths per 1,000 live births or infants at risk and as percentages of the 1991-1995 rate.
Hazards ratios (HR) and 95% confidence intervals (CI) were deter-mined by Cox proportional hazards models using days survived as the time axis. Infants were followed for 364 days from the time of birth, at which point follow-up ended. Unadjusted HRs and HRs adjusted (aHR) for province of residence, maternal age (<20, 20-29, 30-34, and ≥35 years), parity (1, 2, 3, or ≥4 live births, including the current birth), infant sex, and multiple birth (yes, no) were esti-mated by neighbourhood income quintile and period of birth. No adjustment was undertaken for gestational age, a potential inter-mediate on the pathway between socio-economic status and infant death.15Robust sandwich estimators were used to adjust standard errors for clustering of births in dissemination areas.16We used Cox models as they allow us to easily test the possibility that HRs vary with age of infants at time of death, which would be the case if hazards were non-proportional (i.e., if the assumption of propor-tional hazards was rejected). The proporpropor-tionality of hazards was verified by log (-log survival) plots. HRs that are proportional are interpreted in a similar manner as relative risks averaged over the follow-up period.17
Analyses were carried out using SAS 9.1.
RESULTS
Of 3,258,394 live births in the nine study provinces from 1991 to 2005, 3,173,694 (97.4%) were retained in our analyses. The remain-ing 2.6% were excluded because of missremain-ing, invalid or non-residential postal codes. Among the included births, there were 11,765 neonatal, 5,379 postneonatal, and 1,668 SIDS deaths, cor-responding to mortality rates of 3.7 per 1,000 live births, 1.7 per 1,000 neonatal survivors, and 0.52 per 1,000 live births, respec-tively, over the entire study period. Among SIDS deaths, 93.0% occurred in the postneonatal period.
Higher rates of neonatal, postneonatal and SIDS deaths were observed in the two poorest neighbourhood income quintiles com-pared with the two richest quintiles (Table 1). Infants whose moth-ers resided in small towns and rural areas were also at higher risk of death compared to infants whose mothers resided in urban areas.
Table 1. Infant Mortality in Canada (Excluding Ontario and Territories), 1991-2005
Live Births Neonatal Mortality Postneonatal Mortality SIDS
Rate per Unadjusted Hazard Rate per Unadjusted Hazard Rate per Unadjusted Hazard
1,000 Ratio (95% CI) 1,000 Ratio (95% CI) 1,000 Ratio (95% CI)
Live Neonatal Live
Births Survivors Births
Total 3,173,694 3.71 1.70 0.53
Neighbourhood income quintile
1 (poorest) 753,143 4.14 1.22 (1.16-1.30) 2.54 1.95 (1.79-2.14) 0.86 2.53 (2.16-2.96)
2 650,605 3.72 1.10 (1.03-1.17) 1.64 1.26 (1.14-1.39) 0.53 1.56 (1.31-1.86)
3 621,244 3.69 1.09 (1.02-1.16) 1.46 1.13 (1.02-1.25) 0.44 1.29 (1.07-1.55)
4 607,563 3.46 1.02 (0.96-1.09) 1.33 1.02 (0.92-1.14) 0.35 1.02 (0.84-1.25)
5 (richest) 541,139 3.38 Reference 1.30 Reference 0.34 Reference
Area of residence
Urban 2,414,309 3.56 Reference 1.53 Reference 0.47 Reference
Rural and small town 759,385 4.17 1.17 (1.12-1.22) 2.25 1.48 (1.39-1.56) 0.69 1.46 (1.32-1.62)
Year of birth
1991-1995 1,144,957 3.84 Reference 2.10 Reference 0.75 Reference
1996-2000 1,031,217 3.59 0.93 (0.89-0.97) 1.62 0.77 (0.72-0.82) 0.46 0.61 (0.55-0.68)
In urban areas, differences in mortality rates across neighbour-hood income quintiles were more pronounced. Relative to the rich-est quintile, the poorrich-est had aHRs of 1.24, 1.58, and 1.83 for neonatal mortality, postneonatal mortality and SIDS, respectively (Table 2).* Except for neonatal mortality, sim-ilar but weaker associations were found in small towns and rural areas, where the association between neighbourhood income and SIDS was statistically non-significant after adjustment for covariates (Table 3).* There was little evidence that hazards were non-proportional, suggesting that the magnitude of the association between neighbourhood income and SIDS varied little with age at time of death.
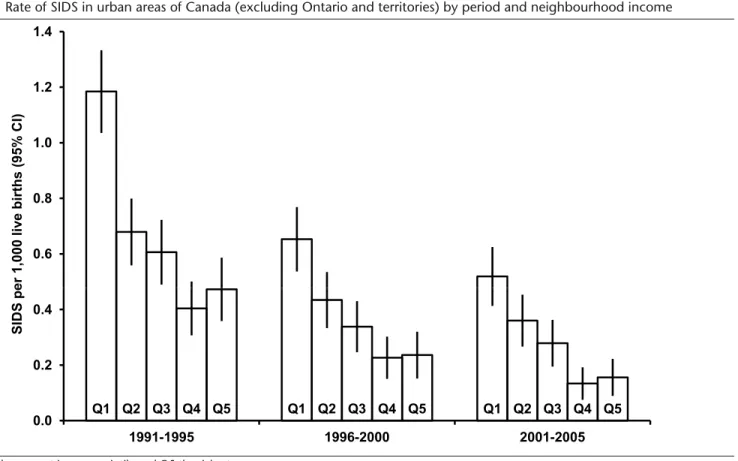
Between 1991-1995 and 2001-2005, rates of neonatal mortality, postneonatal mortality and SIDS in urban areas (all neighbourhood income quintiles combined) declined by 3%, 38% and 57%, respectively.
Changes over time in neonatal, postneonatal and SIDS mortality by neighbourhood income quin-tiles are shown in Figures 1-3. The decrease in rates of postneonatal mortality and SIDS occurred across all income quintiles. Most of the decrease for SIDS took place between 1991-1995 and 1996-2000, while the decrease for post-neonatal mortality continued from 1996-2000 to 2001-2005. Over the entire study period, post-neonatal mortality rates declined by 35% in the poorest quintile and 39% in the richest quintile. For SIDS, the poorest quintile experi-enced a 56% decline and the rich-est quintile a 67% decline, but the absolute decrease in rates was greatest in the poorest quintile.
DISCUSSION
We found that socio-economic inequalities in infant mortality,
meas-T
able 2.
Infant Mortality in Urban Areas of Canada (Excluding Ontario and T
erritories), 1991-2005 Live Births Neonatal Mortality Postneonatal Mortality SIDS Rate Unadjusted Hazard Adjusted Hazard Rate Unadjusted Hazard Adjusted Hazard Rate Unadjusted Hazard Adjusted Hazard per Ratio (95% CI) Ratio* (95% CI) per Ratio (95% CI) Ratio* (95% CI) per Ratio (95% CI) Ratio* (95% CI) 1,000 1,000 1,000 Live Neonatal Live Births Sur vivors Births Total 2,414,309 3.56 1.53 0.47
Neighbourhood income quintile
1 (poorest) 569,279 4.04 1.25 (1.16-1.34) 1.24 (1.15-1.34) 2.24 1.96 (1.76-2.19) 1.58 (1.41-1.76) 0.80 2.76 (2.26-3.37) 1.83 (1.49-2.26) 2 501,546 3.65 1.13 (1.04-1.22) 1.14 (1.05-1.24) 1.55 1.36 (1.21-1.53) 1.20 (1.07-1.35) 0.50 1.71 (1.38-2.12) 1.32 (1.06-1.65) 3 476,071 3.50 1.08 (1.00-1.17) 1.09 (1.01-1.18) 1.34 1.18 (1.04-1.33) 1.07 (0.94-1.20) 0.42 1.43 (1.13-1.80) 1.17 (0.92-1.48) 4 465,752 3.22 0.99 (0.92-1.08) 1.01 (0.93-1.09) 1.15 1.01 (0.89-1.14) 0.96 (0.84-1.08) 0.26 0.89 (0.69-1.15) 0.80 (0.62-1.04) 5 (richest) 401,661 3.24 Reference Reference 1.14 Reference Reference 0.29 Reference Reference Year of birth 1991-1995 861,835 3.69 Reference Reference 1.92 Reference Reference 0.70 Reference Reference 1996-2000 781,476 3.42 0.93 (0.88-0.98) 0.90 (0.85-0.95) 1.41 0.73 (0.68-0.79) 0.74 (0.69-0.80) 0.40 0.57 (0.49-0.65) 0.58 (0.50-0.67) 2001-2005 770,998 3.56 0.97 (0.92-1.02) 0.92 (0.87-0.97) 1.20 0.62 (0.58-0.68) 0.65 (0.60-0.70) 0.30 0.43 (0.37-0.50) 0.46 (0.40-0.54) *
Adjusted for neighbourhood income quintile, province of residence at birth, year of birth (5-year inter
val), parity
, sex, and
multiple birth.
T
able 3.
Infant Mortality in Rural Areas of Canada (Excluding Ontario and T
erritories), 1991-2005 Live Births Neonatal Mortality Postneonatal Mortality SIDS Rate Unadjusted Hazard Adjusted Hazard Rate Unadjusted Hazard Adjusted Hazard Rate Unadjusted Hazard Adjusted Hazard per Ratio (95% CI) Ratio* (95% CI) per Ratio (95% CI) Ratio* (95% CI) per Ratio (95% CI) Ratio† (95% CI) 1,000 1,000 1,000 Live Neonatal Live Births Sur vivors Births Total 759,385 4.17 2.25 0.69
Neighbourhood income quintile
1 (poorest) 183,864 4.45 1.17 (1.05-1.31) 1.14 (1.02-1.28) 3.47 1.98 (1.68-2.33) 1.54 (1.31-1.82) 1.05 2.16 (1.66-2.79) 1.54 (1.19-2.00) 2 149,059 3.93 1.03 (0.92-1.16) 1.03 (0.92-1.16) 1.92 1.09 (0.91-1.31) 1.02 (0.85-1.23) 0.65 1.34 (0.98-1.82) 1.19 (0.87-1.64) 3 145,173 4.31 1.14 (1.01-1.27) 1.15 (1.02-1.29) 1.87 1.06 (0.89-1.28) 1.02 (0.85-1.23) 0.52 1.07 (0.78-1.48) 1.00 (0.72-1.37) 4 141,811 4.27 1.12 (1.00-1.26) 1.13 (1.01-1.27) 1.92 1.09 (0.91-1.31) 1.08 (0.90-1.29) 0.64 1.32 (0.96-1.80) 1.28 (0.93-1.75) 5 (richest) 139,478 3.80 Reference Reference 1.76 Reference Reference 0.49 Reference Reference Year of birth 1991-1995 283,122 4.32 Reference Reference 2.63 Reference Reference 0.93 Reference Reference 1996-2000 249,741 4.10 0.95 (0.87-1.03) 0.92 (0.85-1.00) 2.26 0.86 (0.77-0.96) 0.87 (0.77-0.98) 0.67 0.72 (0.59-0.88) 0.74 (0.61-0.90) 2001-2005 226,522 4.06 0.94 (0.86-1.02) 0.90 (0.82-0.98) 1.78 0.68 (0.60-0.77) 0.70 (0.61-0.79) 0.42 0.46 (0.36-0.58) 0.46 (0.36-0.59) *
Adjusted for neighbourhood income quintile, province of residence at birth, year of birth (5-year inter
val), parity
, sex, and
multiple birth.
†
Adjusted for neighbourhood income quintile, province of residence at birth, year of birth (5-year inter
val), parity
, and sex.
* For more complete data for Tables 2 and 3, please see Supplemental Appendix A and Supplemental Appendix B, respectively.
ured using neighbourhood income, have narrowed in Canada over a 15-year period but have not disappeared. However, all income quintiles experienced a decline in infant mortality. Unlike previous studies,6,7the
association between neighbourhood income and infant mortality in our study remained statistically significant after adjustment for covariates, most likely due to the greater statistical power of our larger dataset.
Figure 1. Neonatal mortality in urban areas of Canada (excluding Ontario and territories) by period and neighbourhood income quintile
Q1 represents the poorest income quintile and Q5 the richest.
Figure 2. Postneonatal mortality in urban areas of Canada (excluding Ontario and territories) by period and neighbourhood income quintile
Q1 represents the poorest income quintile and Q5 the richest.
2 3 4 5 a ths per 1,000 liv e births (95 % CI) Q1 Q2 Q3 Q4 Q5 Q1 Q2 Q3 Q4 Q5 Q1 Q2 Q3 Q4 Q5 0 1 1991-1995 1996-2000 2001-2005 Neonatal de a 1 0 1.5 2.0 2.5 3.0 a ths per 1,000 infants at risk (95 % CI) Q1 Q2 Q3 Q4 Q5 Q1 Q2 Q3 Q4 Q5 Q1 Q2 Q3 Q4 Q5 0.0 0.5 1.0 1991-1995 1996-2000 2001-2005 Postneonatal de a
Reasons why low socio-economic status is associated with infant mortality need further investigation, but higher prevalence of risk factors associated with infant death is likely involved. In Canada, mothers who do not complete high school have significantly high-er rates of smoking and alcohol use during pregnancy and lowhigh-er rates of breastfeeding than women with higher levels of education.9 In addition, lower maternal education is associated with higher risks of preterm18 and small-for-gestational-age birth.19 These inequalities in outcomes were stable or increased over time.18,19
In the poorest neighbourhood income quintile, aHRs were high-er for SIDS than for neonatal and ovhigh-erall postneonatal death, indi-cating that socio-economic gradients in relative risks are more important for SIDS than for other types of infant death. The high hazard ratio of SIDS for lower socio-economic strata is consistent with observations from the United Kingdom, where both unem-ployment and area deprivation were associated with a higher risk of SIDS.20,21In Canada, the proportion of mothers placing their infants on their back to sleep (the safest position for SIDS preven-tion)22increases with higher maternal education.23Maternal smok-ing dursmok-ing pregnancy and absence of breastfeedsmok-ing vary by socio-economic status and are also known to be risk factors for SIDS.24,25
As shown in a previous study,10changes in the coding of cause of death are unlikely to have substantially affected SIDS counts.
This study has limitations. We did not have individual-level data on income, education and employment, or other potentially rele-vant characteristics such as smoking. Neighbourhood income was assigned using postal codes and non-differential misclassification errors in the attribution of neighbourhoods may have attenuated the results, especially in small town and rural areas.26 Neighbour-hoods were assigned at time of birth, which may not reflect true
res-idential exposures if mothers had moved either during or after preg-nancy. We could not adjust for clustering of births within mothers. Finally, neighbourhood income quintile is only one measure of socio-economic status; we do not know if trends would have been different for other markers of area socio-economic status.
In conclusion, our study shows that despite a decrease in rates of infant mortality and SIDS across all socio-economic strata over time, socio-economic inequalities in those rates have persisted in Canada. This finding highlights the need for effective infant health promotion strategies in vulnerable populations.
REFERENCES
1. Health Canada. Canadian Perinatal Health Report 2003. 2003.
2. Public Health Agency of Canada. Perinatal Health Indicators for Canada 2011. 2012. 3. Arntzen A, Samuelsen SO, Bakketeig LS, Stoltenberg C. Socioeconomic status and risk of infant death. A population-based study of trends in Norway, 1967-1998. Int J Epidemiol 2004;33(2):279-88.
4. Oakley L, Maconochie N, Doyle P, Dattani N, Moser K. Multivariate analysis of infant death in England and Wales in 2005-06, with focus on socio-economic status and deprivation. Health Stat Q 2009;42:22-39.
5. Joseph KS, Liston RM, Dodds L, Dahlgren L, Allen AC. Socioeconomic status and perinatal outcomes in a setting with universal access to essential health care services. CMAJ 2007;177:583-90.
6. Luo ZC, Wilkins R, Kramer MS. Effect of neighbourhood income and maternal education on birth outcomes: A population-based study.
CMAJ 2006;174:1415-20.
7. Luo ZC, Kierans WJ, Wilkins R, Liston RM, Mohamed J, Kramer MS. Dispari-ties in birth outcomes by neighborhood income: Temporal trends in rural and urban areas, British Columbia. Epidemiol 2004;15:679-86.
8. Injury Prevention Committee, Canadian Paediatric Society. Reducing the risk of sudden infant death. Paediatr Child Health 1996;1:63-67.
9. Rusen ID, Liu S, Sauve R, Joseph KS, Kramer MS. Sudden infant death syn-drome in Canada: Trends in rates and risk factors, 1985-1998. Chronic Dis Can 2004;25:1-6.
10. Gilbert NL, Fell DB, Joseph KS, Liu S, León JA, Sauve R. Temporal trends in sudden infant death syndrome in Canada from 1991 to 2005: Contribution of changes in cause of death assignment practices and in maternal and infant characteristics. Paediatr Perinat Epidemiol 2012;26:124-30.
Figure 3. Rate of SIDS in urban areas of Canada (excluding Ontario and territories) by period and neighbourhood income
Q1 represents the poorest income quintile and Q5 the richest.
0.6 0.8 1.0 1.2 1.4 e r 1,000 liv e births (95% CI) Q1 Q2 Q3 Q4 Q5 Q1 Q2 Q3 Q4 Q5 Q1 Q2 Q3 Q4 Q5 0.0 0.2 0.4 1991-1995 1996-2000 2001-2005 SIDS p e
11. Fair M, Cyr M, Allen A, Wen SW, Guyon G, MacDonald RC. An assessment of the validity of a computer system for probabilistic record linkage of birth and infant death records in Canada. The Fetal and Infant Health Study Group.
Chronic Dis Can 2000;21:8-13.
12. Public Health Agency of Canada. Canadian Perinatal Health Report. 2008 Edi-tion. 2008.
13. Wilkins R, Khan S. PCCF+ Version 5J User’s Guide. Automated geographic coding based on the Statistics Canada Postal Code Conversion files, includ-ing postal codes through May 2011. Report 82F0086-XDB. Ottawa: Statistics Canada, 2011.
14. du Plessis V, Beshiri R, Bollman RD, Clemenson H. Definition of Rural. Rural and Small Town Canada Analysis Bulletin. Vol. 3, No. 3. Report 21-006-XIE. Ottawa: Statistics Canada, 2001.
15. Wilcox AJ, Weinberg CR, Basso O. On the pitfalls of adjusting for gestation-al age at birth. Am J Epidemiol 2011;174(9):1062-68.
16. Lin DY, Wei LJ. The robust inference for the Cox proportional hazards model.
J Am Stat Assoc 1989;84:1074-78.
17. Allison PD. Survival Analysis Using SAS®: A Practical Guide, Second Edition. Cary, NC: SAS Institute Inc., 2010.
18. Auger N, Roncarolo F, Harper S. Increasing educational inequality in preterm birth in Quebec, Canada, 1981-2006. J Epidemiol Community Health 2011;65:1091-96.
19. Auger N, Park AL, Harper S, Daniel M, Roncarolo F, Platt RW. Educational inequalities in preterm and term small-for-gestational-age birth over time.
Ann Epidemiol 2012;22:160-67.
20. Leach CE, Blair PS, Fleming PJ, Smith IJ, Platt MW, Berry PJ, et al. Epidemiol-ogy of SIDS and explained sudden infant deaths. Pediatrics 1999;104:e43. 21. Wood AM, Pasupathy D, Pell JP, Fleming M, Smith GC. Trends in
socio-economic inequalities in risk of sudden infant death syndrome, other causes of infant mortality, and stillbirth in Scotland: Population based study.
BMJ 2012;344:e1552.
22. Fleming PJ, Blair PS, Bacon C, Bensley D, Smith I, Taylor E, et al. Environ-ment of infants during sleep and risk of the sudden infant death syndrome: Results of 1993-5 case-control study for confidential inquiry into stillbirths and deaths in infancy. BMJ 1996;313:191-95.
23. Public Health Agency of Canada. What Mothers Say: The Canadian Maternity Experiences Survey. 2009.
24. Mitchell EA, Milerad J. Smoking and the sudden infant death syndrome.
Rev Environ Health 2006;21(2):81-103.
25. Hauck FR, Thompson JM, Tanabe KO, Moon RY, Vennemann MM. Breast-feeding and reduced risk of sudden infant death syndrome: A meta-analysis.
Pediatrics 2011;128(1):103-10.
26. Wilkins R. Neighbourhood income quintiles derived from Canadian postal codes are apt to be misclassified in rural but not urban areas. Ottawa: Statistics Canada, 2004.
Received: November 8, 2012 Accepted: February 28, 2013
RÉSUMÉ
CONTEXTE : La mortalité infantile a diminué au Canada depuis les années 1990 et 2000 mais nous ignorons si toutes les classes socio-économiques ont bénéficié également de ce progrès.
OBJECTIFS : La présente étude portait sur les différences entre les taux de mortalité néonatale et postnéonatale et de mort subite du nourrisson entre les différents quintiles de revenu des quartiers au Canada de 1991 à 2005.
MÉTHODES : Le fichier couplé des naissances vivantes et des décès infantiles au Canada a été utilisé à l’exclusion des naissances survenues en Ontario, au Yukon, dans les Territoires du Nord-ouest et au Nunavut. Les taux de mortalité néonatale et postnéonatale et de mort subite du nourrisson ont été calculé par quintile de revenu des quartiers et par période (1991-1995, 1996-2000, 2001-2005). Les rapports de risque (RR) ont été calculés par quintile de revenu et période avec ajustement pour la province de résidence, l’âge de la mère, la parité, le sexe du nourrisson et les naissances multiples.
RÉSULTATS : En zone urbaine, pour toute la période étudiée (1991-2005), le quintile de revenu le plus pauvre avait un risque plus élevé de mortalité néonatale (RR ajusté 1,24; IC 95% 1,15-1,34), de mortalité postnéonatale (RR ajusté 1,58; IC 95% 1,41-1,76) et de mort subite du nourrisson (RR ajusté 1,83; IC 95% 1,49-2,26) par rapport au quintile le plus riche. Les taux de mortalité post néonatale et de mort subite du nourrisson ont décliné respectivement de 37 % et de 57 % de 1991-1995 à 2001-2005 alors que le taux de mortalité néonatale n’a pas changé de façon significative. Cette diminution de la mortalité postnéonatale et de la mort subite du nourrisson a été observée dans tous les quintiles de revenu.
CONCLUSION : Malgré une diminution de la mortalité postnéonatale et du syndrome de mort subite du nourrisson dans tous les quintiles de revenu, les inégalités subsistent au Canada. Ce résultat démontre le besoin de stratégies efficaces de promotion de la santé visant spécifiquement les populations vulnérables.
MOTS CLÉS : mort subite du nourrisson; mortalité infantile; statut socio-économique