HAL Id: hal-01054744
https://hal.inria.fr/hal-01054744
Submitted on 8 Aug 2014HAL is a multi-disciplinary open access archive for the deposit and dissemination of sci-entific research documents, whether they are pub-lished or not. The documents may come from teaching and research institutions in France or abroad, or from public or private research centers.
L’archive ouverte pluridisciplinaire HAL, est destinée au dépôt et à la diffusion de documents scientifiques de niveau recherche, publiés ou non, émanant des établissements d’enseignement et de recherche français ou étrangers, des laboratoires publics ou privés.
Distributed under a Creative Commons Attribution| 4.0 International License
End-to-End Performance Evaluation of Interconnected
Optical Multi-ring Metropolitan Networks
Tülin Atmaca, Tuan Dung Nguyen
To cite this version:
Tülin Atmaca, Tuan Dung Nguyen. End-to-End Performance Evaluation of Interconnected Optical Multi-ring Metropolitan Networks. Third IFIP TC6 International Conference on Wireless Commu-nications and Information Technology in Developing Countries (WCITD) / IFIP TC 6 International Network of the Future Conference (NF) / Held as Part of World Computer Congress (WCC), Sep 2010, Brisbane, Australia. pp.206-216, �10.1007/978-3-642-15476-8_20�. �hal-01054744�
End-to-End Performance Evaluation of
Interconnected Optical Multi-Ring
Metropolitan Networks
(*)Tülin ATMACA and Tuan Dung NGUYEN
Institut Telecom/Telecom SudParis, 9 rue Charles Fourier, 91011 Evry-France
{ tulin.atmaca, dung.nguyen @it-sudparis.eu}
Abstract
Metropolitan ring networks are usually used to connect the high speed backbone networks with the high speed access networks. In this paper, we focus on the end-to-end performance of a multi-ring architecture in which metropolitan access networks (MANs) are interconnected by a metropolitan core network. These rings are synchronized and can be interconnected transparently through single access nodes (Hub node) or multiple access nodes. A multi ring architecture consisting of two slotted MAN rings connected by a ring-based slotted metro core will be simulated. The major problem in this architecture is how to resolve the synchronization shift between rings while assuring the traffic routed efficiently from the metro access to the metro core networks. To ensure this efficiency, we use some optical packet filling mechanisms such as Aggregation Mechanism, CUM (CoS-Upgrade Mechanism), DCUM (Dynamic CoS-Upgrade Mechanism). Through various simulations, we present some performance results in terms of jitter and mean end-to-end delay which show that the use of the pair of Aggregation/DCUM improves the transmission capability at Hub nodes as compared with others pairs and provide a cost-effective solution.
Keywords: Metropolitan Area Network (MAN), Optical Multi-Ring metro architecture, performance, synchronization, simulation, jitter, end-to-end delay
1.
End-to-End Network Architecture
Transport and switching network elements responsible for the data transmission between network users is referred to as the transport (or data) plane. It is
* This work was partially supported by the ECOFRAME ANR French national research project and NoE/Euro-NF project
important to note that the architecture required to construct an efficient transport plane has evolved differently in the backbone, metro, and access levels. Backbone networks (also called long haul networks) carry huge loads of information between countries, through mountains to keep the signal clear and the loss minimal. Backbone networks provide connectivity between points of presence (PoPs), consist of multiple edge and core routers. Each serves one or multiple MAN. The number of nodes and links in a backbone network can vary significantly among the different service providers (typically 30–100 nodes and 40–120 links) [1]. The distances between node pairs are in the order of several hundreds or even thousands of kilometres, and the traffic demand between them is usually meshed and specified in multiples of the wavelength granularity (i.e., 2.5 or 10 Gbits/s). The average bandwidth on a backbone link can be up to several hundreds of Gbits/s.
Metro networks (MAN) interconnect a number of central offices (CO) within a given metropolitan area. These networks have been traditionally deployed using synchronous optical network/synchronous digital hierarchy (SONET/SDH) rings, as the traffic grooming technique was needed to guarantee efficient use of the network bandwidth (the capacity required between pairs of CO has been smaller than the wavelength granularity of SONET/SDH systems). Unlike long-haul networks, which transport point-to-point traffic, metro networks are ring-based in multiples of the wavelength granularity.
Fig. 1. Access, Core and Backbone Metro Networks [2]
As showed in Fig. 1, metro rings (core/region networks) interconnect the high-speed backbone networks and the high-high-speed access networks. The metro rings can be interconnected transparently through single access node (Hub node) or multiple access nodes. Current metro networks are typically SONET/SDH-over-WDM rings which carry the huge amount of bursty data traffic. The metro core
and regional networks are normally both 2-fiber rings. A fiber failure in a metro access ring does not affect the traffic in the core and other access rings. The network thus becomes more reliable.
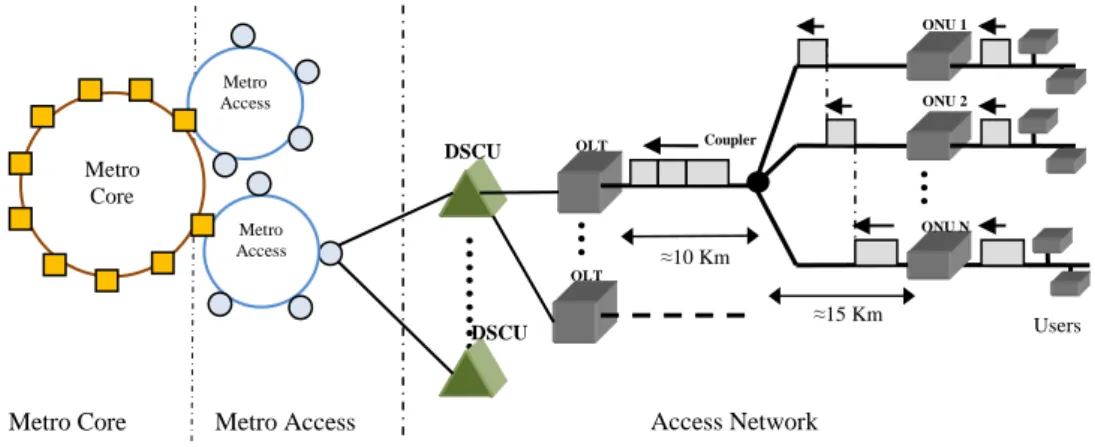
The technology evolution for an end-to-end architecture can be: ADSL towards Passive Optical Network (PON) in the access network [3] and SONET/SDH/WDM towards all-optical packet switching/Dense WDM in the metro network. Besides, upstream traffic flux from Optical Line Terminal (OLTs) to the access metro is statistically multiplexed through a DSCU (Distant Subscriber Connection Unit). A DSCU can be connected with several OLTs while an access node of the access metro can be connected with several DSCUs. As a result, an access metro (about 10 ring nodes) can support some thousands of PONs. A simplified end-to-end architecture in the metropolitan network is shown in Fig 2.
Fig. 2. End-to-End Metro Network Architecture
In this architecture, there are about 2 million subscribers which are connected to the metro core (primary ring with 10 core stations) through access networks and metro networks. Each core station is connected with a secondary ring (access metro) composing of 4 access stations (access nodes). So we have a total of 40 stations which are accessible. Each access station connects with 25 DSCUs which manages approximately 2000 subscribers across 60 PONs. We suppose that the amount of traffic from each network PON is approximately equal to 32Mbits/s, which requires an access metro with a capacity exceeding 200Gbit/s (40 wavelengths of 10Gbit/s responsible for 50%). Note that optical frames are transmitted from ONUs to OLT and from OLTs to DSCU under point-to-point connections. OLT ONU 2 ONU N Metro Core ONU 1 OLT Metro Access Metro Access Metro Access Metro Core ≈10 Km ≈15 Km DSCU DSCU Coupler Access Network Users
2.
Multi-Ring Network Simulation
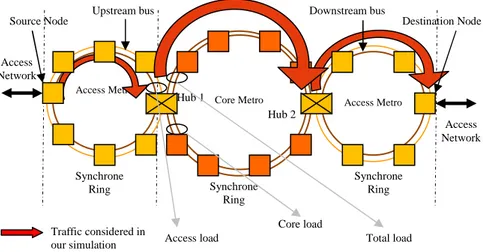
Now, we focus on the proposed simulation. For the sake of simplify, we use 3 metro rings in which 2 access metro rings connected to 1 core network through Hub nodes as shown in Fig. 3. All access nodes of a metro access (the left one) sends its local traffic to a destination node residing on another metro access network (the right one) by passing through a metro core network. These traffics are then transported to the left Hub node (Hub 1 - the node interconnecting the metro access network in the left side with the core network) before being routed to the core metro network into optical fixed-size packets. Inside the Hub 1, the traffic can be aggregated with other traffic coming from other access nodes (because they have the same destination) or with the Hub node’s local traffic. Since the network architecture is configured with active components as Packet Optical Add/Drop Multiplexer (POADM [4]), hence both metro types support the synchronous transmission which allows transporting optical fixed-size packets in the slotted mode. In the following, we use the bus-based network referring to the left metro access’s upstream path in the figure.
Fig. 3. Multi-Ring Network Simulation
In our simulation, the uniform traffic pattern is considered in the bus-based network. From an access node residing in the bus-based network, electronic packets are encapsulated into optical packets and then transported to the Hub 1. Depending on the mechanism used in the Hub node, the optical packets might be directly put on optical buffers (to be ready for being routed to the core network) or be separated again into electronic packets which will be then contained in electronic buffers. The second one leads to the situation that incoming electronic packets (from different access nodes) might be together combined (mutual combination) or be combined with local electronic packets (local combination) of
Core Metro Access Metro
Synchrone Ring Synchrone Ring Access Network Access Metro Synchrone Ring Access Network Hub 1 Hub 2
Upstream bus Downstream bus
Source Node Destination Node
Traffic considered in
our simulation Access load
Core load
Hub node (Hub node can be a point of presence) or both in order to create a new optical packets with a higher filling ratio. This behaviour is very similar to GPFO mechanism [5] (that we have developed in order to increase the filling ratio of the optical packets by entering electronic packets in intermediary nodes), so-called GPFO behaviour. In order to limit the complexity of the simulation, we consider only GPFO behaviour formed by mutual combination in resuming that Hub node does not function as a POP.
Fig. 4. Hub node’s traffic
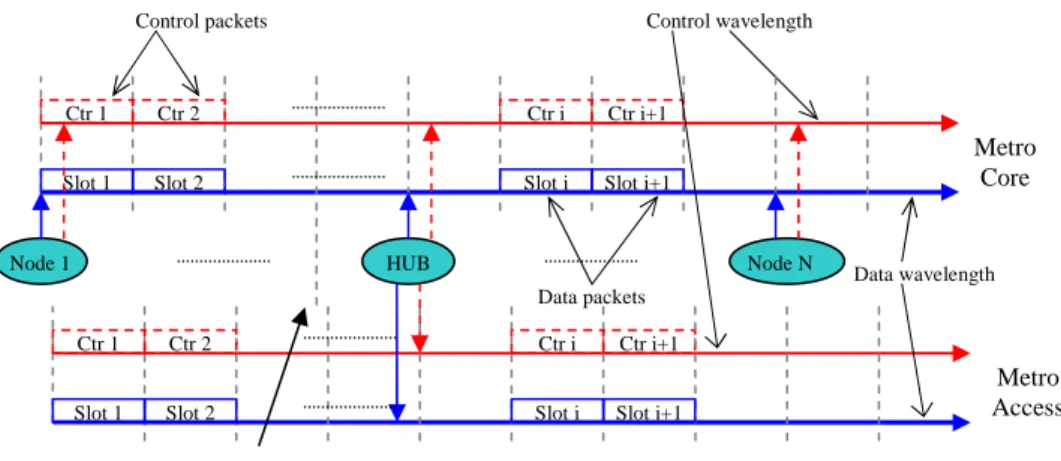
There are two key challenges to simulate a Hub node. The first one is the synchronization between interconnected rings. Transmitting transparently optical packets through Hub node needs to consider this synchronization shift. The other challenge to simulating Hub node is the optical packets size supported by different rings. This is referred as “granularity” problem. In the second one, optical packets must be disassembled and re-aggregated, but in different sizes before being switched to the core network. The problem of synchronization shift is shown in the Fig. 5. Control Unit Electronic buffers Add traffic Transparent optical transit path Control wavelength Optical fiber Data wavelength FDL Metro Core (Single fiber)
Fig. 5. The synchronization shift between interconnected rings
For simplicity, we suppose that three simulated rings support the same optical packets size and hence the same slot duration. So the synchronization shift has a ‘minor’ impact on the Hub node performance. In general, a control packet will be dropped when corresponding data packets which come from access nodes, are received in Hub node. At Hub node, a new control packet needs to be created when a data packet sent to the core network. Certainly, this created control packet must be according to characteristics of the core network. The insertion of data packets must satisfy the discipline of the traffic priority at Hub node (Fig. 4) which is described as follows: the traffic in the core network has the priority higher than that in Hub node.
3.
Simulation Parameters
Generally, many performance requirements must be met in order to transport specified data from the access network to the backbone network across a pair of metro core/region (access) networks. Based on parameter requirements for the metropolitan Ethernet network defined in MEF of IETF we use performance parameters in an end-to-end metropolitan network (metro access/core/access networks) as follows: the end-to-end Packet Loss Ratio (EPLR), the end-to-end Accumulated Packet Delay (EAPD) and the Electronic Packet Jitter (EPJ). EPJ is one of the most important parameters which support for real-time data transfer in quality-of-service (QoS).
We suppose that networks support the fixed-size optical packets of 12500 bytes corresponding to the duration of 10µs @10Gbps. We use the multi-class approach for both network types [4]. We assume 8 CoS for client packets in the electronic domain. The premium traffic is generated from CBR sources, with the packet size of 810 bytes. The non premium traffic is modelled by an aggregation of IPP
Data wavelength
Node 1 HUB Node N
Control wavelength Control packets Data packets Ctr i+1 Ctr 1 Slot 1 Ctr 2 Slot 2 Ctr i
Slot i Slot i+1
Ctr i+1 Ctr 1 Slot 1 Ctr 2 Slot 2 Ctr i
Slot i Slot i+1
Metro Core
Metro Access The synchronization shift
sources with different burstiness levels. Generated packets are of variable lengths according to the Internet packet length statistic ([6]) for each non premium CoS (classes ID from 3 to 8). The optical buffer size is equal to 200 Kbytes for the premium traffic class, 500 Kbytes for silver and bronze traffic classes, 1000 Kbytes for the BE traffic class.
Since Hub node has not a function as a point of present, we propose three scenario cases to study as table 1. Our previous works [4, 7, 10] has shown that PEM (Packet Erasing and Extraction) mechanism does not improve the network performance under medium load, so it is disabled in this work. DCUM and Aggregation Mechanism offer the best performance (in terms of access delay and PLR) [7], so we choose them for metro core network to compare. The GPFO-behaviour can be activated or deactivated, depending on each scenario.
Table 1: End-to-End cases
4.
Numerical Results
Before analyzing simulation results, we note that all mean values in our simulation results are computed with an accuracy of no more than a few percents at 95% confidence level using Batch Means method [8].
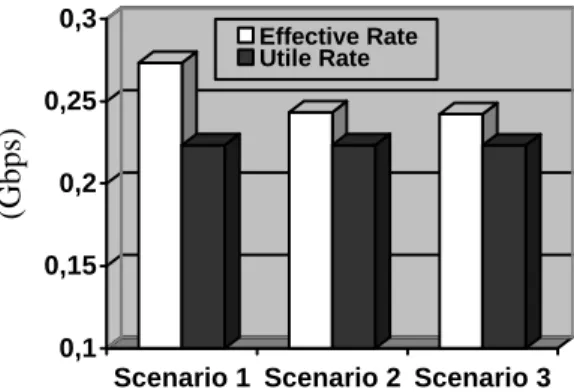
(G b p s) 0,1 0,15 0,2 0,25 0,3
Scenario 1 Scenario 2 Scenario 3 Effective Rate
Utile Rate
Fig. 6. The total utile and effective rates (from node 1 to 7) in the left-side access metro
network Metro Access (10Gbps) Metro Core (10Gbps) Metro Access (10Gbps) Case 1 Aggregation DCUM Aggregation Case 2 T = 150µs DCUM T = 150µs Case 3 Aggregation Aggregation Aggregation
Let’s call “effective rate” be the rate of optical containers being transported on the optical ring, and let “utile rate” be the rate of electronic client packets which are travelling inside the optical container (being encapsulated in the optical container). Fig. 6 shows the total utile and effective rates from node 1 to node 7 in the left-side access network for three scenarios without GPFO. We observe that the utile rate has the same value from node 1 to node 9 while the effective rate becomes smaller as long as the timer value increases. This is due to the fact that when the Timer duration is small, the number of created optical containers is higher than it is obtained with bigger Timer values and increases the probability of having not full-filled optical containers. The effective rate with small timer values thus becomes more important, leading to the waste of bandwidth. This shows advantage of simple aggregation mechanism compared to limited-timer mechanism [10].
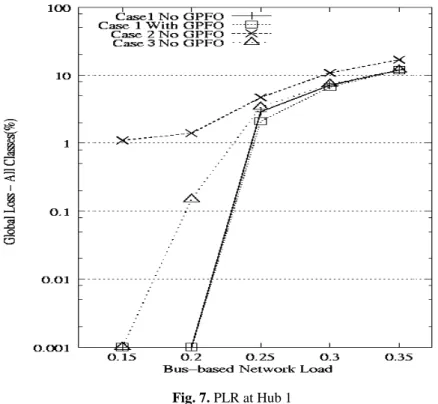
Fig. 7. PLR at Hub 1
Now, we focus on the Hub 1 which interconnects the bus-based network with the metro core network. Fig. 7 presents the total PLR (all classes of service) obtained at Hub node with three cases in function of the access load. Since the core load in observation (shown in Fig. 3) is set up to 70% (that we have supposed), so the total load can be up to a very high proportion over the core network capacity (e.g. it occupies about 95% core network capacity when the access load equal to 25%). As expected, all four curves show a very high loss as considered load increases. This is due to the fact that as the access load increases, the total load of the core
network increases also. When the access load reaches 0.3, the Hub node’s output capacity hence becomes saturated (100% core network capacity filled). As a result, a very high packet loss is observed when the access load surpasses this threshold.
For this reason, we focus on access loads which are smaller than 0.3. Regarding case 1, with or without GPFO, the difference of the packet loss is not significant. Since the simple aggregation always provides a maximum filling ratio, thus the remaining space inside an optical packets filled by the simple aggregation is not enough to be continuously filled in intermediate nodes. Hence GPFO-behaviour is not necessary when the simple aggregation is enabled.
Among three studied cases without GPFO-behaviour, Hub node in case 2 performs the worst performance, followed by case 3 while case 1 offers the best performance. Case 2 begins show the packet loss earlier than that in case 1 and 3 (15% in comparison to 20% of the access load). Moreover, in case 2, although DCUM is used in the core network, the timer size of 150µs set up at metro access network cannot improve the PLR, even under lightly loaded network (PLR observed with the access load of 0.15 has shown more than 1% loss). So, we think that the simple aggregation used in the metro access network, connecting to a metro core network implementing DCUM is the best choice, based on obtained performance results. Theoretically, DCUM can be implemented in metro access side, but it is more expensive in terms of consumed resource since the algorithm used in DCUM is more complex than that in the simple aggregation.
( % ) 60 80 100
CoS 1-2 CoS 3-4 CoS 5-6 CoS 7-8
Scenario 1 - N o GP F O Scenario 2 - N o GP F O Scenario 3 - N o GP F O Scenario 1 w GP F O
Fig. 8. Filling Ratio observed at Hub 1
Fig. 8 shows the filling ratio obtained for 3 scenarios with and without GPFO. Having a lower filling ratio, the optical container in the scenario 2 without GPFO wastes more bandwidth than other cases, notably for the Premium class. We observe that the filling ratio obtained in scenarios 1 and 3 without GPFO is the same for 4 CoS and always smaller than that obtained in scenarios 1 with GPFO. The difference of the filling ratio obtained from different scenarios is clearer for the premium traffic but it becomes vaguer as the priority of traffic decreases. An explanation for this phenomenon is that we use the factor 1 for the premium
traffic’s timer (T1 = T) while we use respectively the factor 2, 10 and 20 for other classes of service (T2 = 2*T, T3 = 10*T and T4 = 20*T) [10].
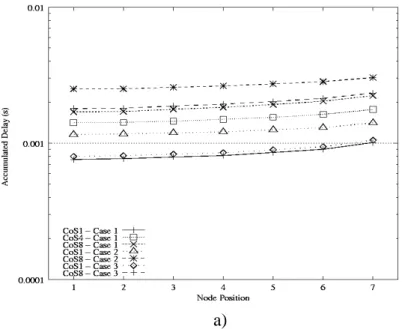
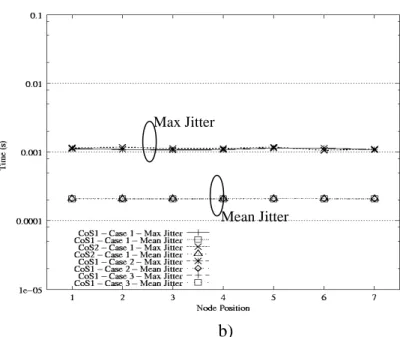
Fig. 9a plots the accumulated access delay in function of access nodes with bus-based network load fixed to 15%. We observe that classes of lower priority provide slightly higher accumulated access delay for all cases as compared to that obtained with classes of high priority. For instance, Premium traffic with the simple aggregation provides a low average accumulated delay (less than 1 ms) at all nodes as compared to accumulated delays obtained by classes of lower priority (e.g. CoS 4 and CoS 8). Regarding the maximum and the average of the electronic packet jitter shown in Fig. 9b, we observe that three cases provide nearly identical average electronic packet jitter at all nodes. Additionally, electronic packet jitter obtained from CoS 1 and 2 seems to be the same. This is due to the fact that electronic packets which are encapsulated in an optical packet will be received in the same time when the optical packets finish its travel at the destination node. In general, there are about from ten to hundred electronic packets encapsulated inside an optical container, leading to small inter-arrival time measured at the destination node. Packet jitters obtained by CoS 1 and 2 are smaller than values specified by MEF. This could be considered as satisfaction in terms of QoS, even for strictly delay-sensitive voice traffic, regardless of used access mechanisms.
a)
b)
Fig. 9. Average accumulated delays and standard of electronic packet jitter at each node for
different cases with the access load equal to 5%
5.
Concluding Remarks and Future Works
In this article, we have presented an interconnection architecture of optical multi-rings metropolitan networks. We studied the end-to-end performance and the functionality of the interconnection interface of synchronous metropolitan rings. Comparing three cases scenario of optical packet filling mechanisms: CUM/DCUM, Aggregation/Aggregation and Aggregation/DCUM, respectively used for metro access and metro core networks, we have observed that the pair of Aggregation/DCUM mechanisms was the best choice thanks to the algorithmic simplicity of the aggregation mechanism in access and to efficiency of DCUM in metro core to obtain quite good results in terms of jitter and end-to-end delay. Aggregation/DCUM mechanisms implemented in a pair of metro networks have well achieved its objective: its configuration can strongly improve the network performance, providing an end-to-end metro network with the capability of being stable while guaranteeing good performance in terms of low packet loss, low accumulated delay and high resource utilization under various workloads.
In the future, we will take into account the “granularity” problem in which each network supports different size of the optical packets. This work also will include the performance evaluation of a network where an asynchronous ring (i.e DBORN [9]) connected to a synchronous ring, while the capacity of the metro core should be several times larger than that of the metro access network.
Max Jitter
6.
References
[1] E. ALANQAR, A. JUKAN, “Extending End-to-End Optical Service Provisioning and Restoration in Carrier Networks: Opportunities, Issues and Challenges”, IEEE Communications Magazine, January 2004.
[2] Tülin Atmaca, Viêt Hung Nguyen, Thaere EIDO & Tuan Dung Nguyen, “Report N° 2 on Comparative Study between Fix Packet Format & Variable Packet Format in an Optical Ring Network”, Collaboration 2006 Alcatel-Lucent / GET-INT; Performance Analysis of DATA Oriented Metro Area Networks (PERFOMAN), 2007.
[3] Kramer, G., and Pesavento, G.: “Ethernet passive optical network (EPON): building a next-generation optical access network”, IEEE Commun. Mag., 2002, 40, (2), pp. 66–73.
[4] Delivrable D2.1 : “Définition du Plan de Transport (MAC, Protocoles)”, French ANR Project / ECOFRAME (Eléments de convergence pour les futurs réseaux d’accès et métropolitains à haut débit), Conventions n° 2006 TCOM 002 -01 à -08, Alcatel-Lucent, Orange-Labs, Télécom-SudParis, Télécom Bretagne, UVSQ, January 2008
[5] Thaere EIDO, Dung Tuan NGUYEN, Tülin ATMACA, “Packet Filling Optimization in Multiservice Slotted Optical Packet Switching MAN Networks”, paper accepted for the Advanced International Conference on Telecommunications, AICT’08, Athens June 2008. [6] http://www.caida.org/analysis/AIX (still accessible)
[7] Tuan-Dung NGUYEN, Thierry EIDO, Tülin ATMACA, “DCUM: Dynamic Creation of Fixed-Size Containers in Multiservice Synchronous OPS Ring Networks”, International Workshop on the Evaluation of Quality of Service through Simulation in the Future Internet, IEEE QoSim’09, Roma, Italy, March 6th, 2009.
[8] M.H. McDougall, Simulating Computer Systems: Techniques and Tools, The MIT Press, 1987.
[9] N. Le Sauze, E. Dotaro, A. Dupas and al., “DBORN: A Shared WDM Ethernet Bus Architecture for Optical Packet Metropolitan Network”, Photonic in Switching, July 2002. [10] Tuan Dung Nguyen, Thierry Eido, Viet Hung Nguyen, Tülin Atmaca, “Impact of Fixed-Size Packet Creation Timer and Packet Format on the Performance of Slotted and Unslotted Bus-Based Optical Man”, International Conference on Digital Telecommunications IEEE ICDT’08, Bucharest, Romania, June 29 - July 5, 2008.
[11] D. Popa and T. Atmaca, “On Optical Packet Format and Traffic Characteristics”. In proceedings of IEEE/EuroNGI SAINT’05 Workshop on Modelling and Performance Evaluation for Quality of Service in Next Generation Internet, Trento, Italy, 31 Jan. – 4 Feb. 2005
[12] F. Haciomeroglu, T. Atmaca, “Impacts of packet filling in an optical packet switching architecture”, Advanced Industrial Conference on Telecommunications, AICT’05, Lisbon, Portugal, July 2005
[13] Kevin Fall & Kannan Varadhan, “The ns Manual “, UC Berkeley, LBL, USC/ISI, and Xerox PARC, December 13, 2003
[14] T. Atmaca, H. Nguyen, , “Optical MAN Ring Network: Performance Modelling and Evaluation”, Springer © 2009, Performance Handbook – Next Generation Internet:
Performance Evaluation and Applications- SPIN 12440030, LNCS 5233, ISBN 978-3-540-99500-5, Edited by Prof. Demetres Kouvatsos, University of Bradford, United Kingdom
![Fig. 1. Access, Core and Backbone Metro Networks [2]](https://thumb-eu.123doks.com/thumbv2/123doknet/11604050.300772/3.892.183.708.642.909/fig-access-core-backbone-metro-networks.webp)