HAL Id: hal-01812084
https://hal.archives-ouvertes.fr/hal-01812084
Submitted on 11 Jun 2018
HAL is a multi-disciplinary open access
archive for the deposit and dissemination of
sci-entific research documents, whether they are
pub-lished or not. The documents may come from
teaching and research institutions in France or
abroad, or from public or private research centers.
L’archive ouverte pluridisciplinaire HAL, est
destinée au dépôt et à la diffusion de documents
scientifiques de niveau recherche, publiés ou non,
émanant des établissements d’enseignement et de
recherche français ou étrangers, des laboratoires
publics ou privés.
Ag3V2(PO4)2F3, a new compound obtained by
Ag+/Na+ ion exchange into the Na3V2(PO4)2F3
framework
Matteo Bianchini, F. Lalère, Long H. B. Nguyen, François Fauth, Rénald
David, Emmanuelle Suard, Laurence Croguennec, Christian Masquelier
To cite this version:
Matteo Bianchini, F. Lalère, Long H. B. Nguyen, François Fauth, Rénald David, et al..
Ag3V2(PO4)2F3, a new compound obtained by Ag+/Na+ ion exchange into the Na3V2(PO4)2F3
framework . Journal of Materials Chemistry A, Royal Society of Chemistry, 2018, 6 (22),
pp.10340-10347. �10.1039/c8ta01095a�. �hal-01812084�
, M. Bianchini , F. Lalère , H. B. L. Nguyen , F. Fauth , R. David , E. Suard , L. Croguennec
b,e,f and C. Masquelier a,e,f
Phosphate polyanionic compounds have been used for several technological applications, and are especially widespread in battery research. Na3V2(PO4)2F3 is a material holding great promise as a positive electrode for Na-ion batteries. We study
here the Ag+/Na+ ion exchange that is possible due to the high ionic mobility of Na+ in this material. A nearly complete ion
exchange was obtained and we report the crystal structure of the new orthorhombic phase Ag3V2(PO4)2F3, determined by
synchrotron X-ray and neutron powder diffraction. Silver occupies the same crystallographic sites as sodium and, except for the differences caused by steric effects, Ag3V2(PO4)2F3 preserves the symmetry constrains already present in the parent
compound Na3V2(PO4)2F3. We also followed the evolution of the crystal structure upon heating/cooling, to observe an
order/disorder transition analogous to the one already reported for Na3V2(PO4)2F3, but occurring at a significantly higher
temperature.
Introduction
Phosphate compounds have been extensively studied in recent years for several technological applications, including Li-ion batteries. The discovery of LiFePO4 1 and its development
towards commercial exploitation proved that polyanionic compounds, and phosphates in particular, despite their “weight penalty” when compared to oxides, can play an important role in the electric portable and automotive revolution. The importance of polyanionic systems 2 has emerged clearly also in
the field of next-generation technologies like Na-ion batteries 3:
in fact, among the best positive electrodes reported to date are vanadium-based (fluoro)phosphates Na3V2(PO4)3 and
Na3V2(PO4)2F3, which were shown to have high energy density
and exceptional cycling stability and rate capability 4-6. Na-ion
batteries are nowadays investigated as lower cost alternatives to Li-ion, especially in light of the concerns on the increasing price and possible lower availability of lithium precursors in the future 7, 8.
A particular niche relates to the ionic conduction of heavier silver into host phosphate frameworks. The high ionic conductivity of silver-based compounds has been known since the investigation of AgI and related compounds 9. Among other
Ag-conducting investigated compositions one finds open structures of NASICON-type such as Ag1+xZr2-2xMx(PO4)3 (M = Sc,
Fe 10), AgTaMP3O12 (M = Al, Ga, In, Cr, Fe and Y) 11, AgSbMP3O12
(M = Al, Ga, Fe and Cr) 12 and other structural families such as
(Ag1-xNax)2FeMn2(PO4)3 13, Ag2VP2O8 14, AgRu2(P2O7)2 15 and
Ag7-xNaxFe3(X2O7)4 (X = P, As) 16-18. The high ionic conductivity of
these ceramics led to several applications into functional devices such as membranes, fuel cells and gas sensors 19, 20.
Other potential applications include low thermal expansion behavior 21, hosts for radioactive wastes 22, catalyst supports 23,
ion exchangers 24 and biomedical applications (implantable
devices)25. These last, in particular, were sparked by the work of
Takeuchi and co-workers on primary lithium batteries 26, 27.
In this article, we report the crystal structure of a new silver fluorophosphate Ag3VIII2(PO4)2F3 prepared through ion
exchange from the sodium analog Na3VIII2(PO4)2F3. The interest
in such compound rose significantly in recent years, since it holds great promise as a positive electrode, firstly for hybrid Li/Na-ion batteries 5, 28 and more recently for full Na-ion devices 6, 29, 30. For about 15 years the crystal structure of Na3V2(PO4)2F3
was described using the P42/mnm tetragonal space group 31.
Only recently we observed an orthorhombic distortion and the crystal structure was solved within the Amam space group 32.
The framework is based on V2O8F3 bi-octahedra bridged by
corner-sharing PO4 tetrahedra, creating a stable structure
where large tunnels are present along the [110] and [1-10] directions. These tunnels are responsible for the facile sodium extraction from Na3V2(PO4)2F3 and for its promising
electrochemical activity as a positive electrode for Na-ion batteries, but also for the relative ease of ion exchange with silver without consequent disruption of the 3D framework of the material. Interestingly, there are reports in the literature about ion exchange of Na with Li, where partial exchanges have been obtained33, 34 and this process has even been recently
studied in situ for the parent compound Na3VIV2(PO4)2FO2: Park
et al. showed that the ion exchange process is biphasic 35.In the
following, we detail the structural modifications that are induced by the Ag+/Na+ ionic exchange to achieve the
Ag3V2(PO4)2F3 composition; moreover, the crystal structure is
reported for the first time, for both the room-temperature and high-temperature polymorphs.
Experimental
Synthetic proceduresThe synthesis of Na3V2(PO4)2F3 (NVPF) followed the same
procedure as reported in 36; the material was obtained as a
microcrystalline powder (particles size ≈ 1 µm) without any carbon coating at the surface of the particles. A second batch of Na3V2(PO4)2F3 was also prepared in order to reduce the particle
a.Laboratoire de Réactivité et de Chimie des Solides, CNRS-UMR#7314, Université
de Picardie Jules Verne, F-80039 Amiens Cedex 1, France.
b. CNRS, Univ. Bordeaux, Bordeaux INP, ICMCB UPR 9048, F-33600 Pessac,
France.
c. Institut Laue-Langevin, 71 Avenue des Martyrs, F-38000 Grenoble, France
d. CELLS - ALBA synchrotron, E-08290 Cerdanyola del Vallès, Barcelona, Spain.
e. RS2E, Réseau Français sur le Stockage Electrochimique de l’Energie, FR CNRS
3459, F-80039 Amiens Cedex 1, France.
f. ALISTORE-ERI European Research Institute, FR CNRS 3104, Amiens, F-80039 Cedex
1, France
† Footnotes relating to the title and/or authors should appear here.
Electronic Supplementary Information (ESI) available: [details of any supplementary information available should be included here].
ARTICLE Journal Name
Please do not adjust margins
size, adapting the synthesis reported in 37. In this case, NVPF was
made using as intermediate compound VPO4-c, i.e. a VPO4
coated with carbon. The resulting NVPF, referred to as NVPF-c, has particles size of the order of hundreds of nm and with a carbon coating (SEM images are reported in Supp. Info, Figures S1 and S2). The so-synthesized powders were then stirred for a variable time in an aqueous solution of AgNO3 0.36 M to
exchange sodium ions by silver ions. The resulting powder was washed several times with water and acetone and dried at 50°C under vacuum before being characterized by EDX (SEM Quanta 200 FEG FEI equipped with an EDX INCA OXFORD, SDD 80 mm2)
to monitor the Ag/Na ratio. The chemical composition (Na: Ag: V: P) was also characterized by inductively coupled plasma-optical emission spectroscopy (ICP-OES) using a Varian Model 720-ES spectrometer, after a complete dissolution of the powder into a nitric acid (HNO3) solution.
Materials and methods
Synchrotron X-Ray Powder Diffraction (XRPD) measurements were performed at the MSPD beamline 38 of the ALBA
synchrotron radiation facility (Barcelona, Spain). Data were collected in Debye-Scherrer geometry in the 2θ angular range of 2° - 60°, using the high-angular mode of the station (13-channel Si(111) multianalyzer setup). The sample was enclosed in a 0.7 mm-diameter borosilicate capillary and measured at λ = 0.6202 Å (as determined using a NIST standard silicon sample (NIST SI640D)).
Temperature dependent diffraction patterns were collected at λ=0.7749 Å wavelength on the MSPD beamline using the high-throughput mode (position sensitive MYTHEN detector setup) and CYBERSTAR hot air blower. Data were first collected dynamically in warming ramp (2deg/min, 90sec integration) from room temperature up to 633K. In cooling down, improved statistics data (270sec integration time) were collected every 25 degrees.
Laboratory XRPD was also carried out on a Bruker D8 diffractometer equipped with Cu Kα1,2 radiation and mounted in
θ-θ configuration.
Neutron powder diffraction (NPD) data were acquired at the D2B high-resolution powder diffractometer of the Institut Laue-Langevin (Grenoble, France), at the wavelength of 1.595 Å, calibrated with a Na2Ca3Al2F14 reference. The powder was put
in a vanadium cylindrical sample holder of the diameter of 6.5 mm and data collected in the 10° - 160° 2θ angular range. Diffraction data treatment and Rietveld refinement 39 were
performed using the FullProf Suite 40. The combined refinement
was carried out with equal weights of the synchrotron XRPD and neutrons diffraction data.
Results and discussion
Ag+/Na+ ion exchange in NVPFThe ion-exchange study started by following, through XRPD, the amount of Ag+/Na+ substitution in NVPF as a function of time.
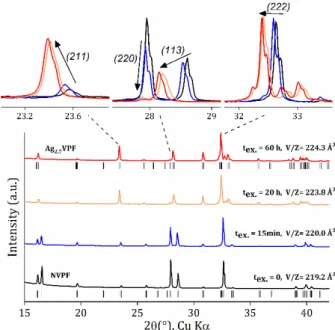
Figure 1 shows the XRPD patterns collected at different times after the ion exchange process started. One can observe that the exchange of Na+ for Ag+ starts quickly, as after 15 minutes
Bragg peaks’ positions (e.g. (113), (222)) and intensities (e.g. (220), (211)) are already modified, indicative of the initial substitution of Ag+ for Na+ (the volume of unit cell describing
the material increases from 219.2 Å3 to 220 Å3). A long ion
exchange time of 20 hours results in a significantly different diffraction pattern, indicating that the material has become Ag-rich. However, only a small variation is observed between 20 and 60 hours and the volume of the unit cell increases only slightly from 223.8 to 224.3 Å3, respectively. Although this could
indicate that the exchange is at this point complete, SEM-EDX
after the longest ion exchange reaction time (60 h) shows that some sodium remains in the structure (approximately 0.38 Na/f.u.). The global composition reached is close to Ag2.71(6)Na0.3(2)V2(PO4)2F3 (thereafter called Ag2.7VPF), still
containing some sodium but significantly Ag-rich. This composition, in rather good agreement with SEM-EDX, is obtained from the Rietveld refinement described in the following (Figure 2). We suggest that the incomplete exchange is due to limited kinetics because of the large particles size of our NVPF.
The crystal structure of Ag2.7VPF obtained after ion exchange
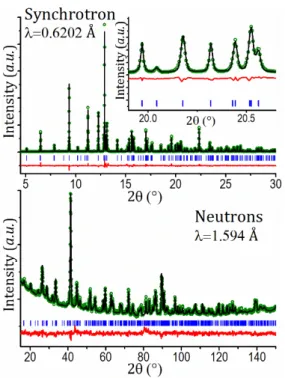
was studied by high angular resolution synchrotron XRPD, while the complete Rietveld structural refinement was carried out combining this with neutron diffraction data from the D2B diffractometer at ILL (Figure 2). A combined approach was chosen because the XRPD pattern is dominated by the heavy
Figure 1: Evolution of the XRPD patterns of Na3V2(PO4)2F3 as the Ag+/Na+ ion exchange proceeds. The different positions of selected Bragg peaks, indexed in the orthorhombic Amam space group, are highlighted at the top. The unit cell volume obtained from Rietveld refinement is also indicated.
silver and vanadium atoms, thus neutrons are helpful to better localize the lighter atoms O, F, P and the residual Na. The Bragg reflections in the synchrotron XRPD pattern have slightly modified angular positions as compared to those measured from NVPF32, although the most important differences are
found on the reflections' intensities, as expected by the higher atomic weight of silver with respect to sodium. Indexation quickly revealed the compatibility of all Bragg positions with the space group Amam of Na3V2(PO4)2F332. As all the diffraction
peaks are properly indexed, no doubt is left about the presence of a single phase after our ionic exchange. We mention nonetheless the presence of few weak peaks (visible in the synchrotron data only) that belong to metallic silver and are significantly broader than the main phase’s ones. The pure Na parent compound has the peculiarity of an extremely small orthorhombic distortion in the a-b plane (Table 4). The distortion is found to significantly increase in Ag2.7VPF, where a
= 9.0843(1) Å and b = 9.0303(1) Å (b < a now and a/b = 1.006). This implies that while the b unit cell parameter slightly decreases, a increases (< 1%). The c axis, perpendicular to the 2-D planes of (Na,Ag) lengthens more significantly, from c = 10.741(3) Å to c = 10.9942(1) Å. It is interesting to note that this directly confirms and further strengthens the recent attribution of an orthorhombic Amam space group for Na3V2(PO4)2F332. The
Ag/Na substitution respects such a symmetry constraint and the space group can be more clearly and undoubtedly confirmed in reason of the presence of Ag, which has two effects: it distorts more the a-b plane, making the Bragg peaks’ splitting easier to observe, and it is a stronger scatterer of X-Rays (Z = 47 vs. Z = 11 for Na), thus dominating the intensity of reflections and clearly marking its position in the structure.
Table 1: Structural parameters obtained from combined Rietveld refinement of
synchrotron XRPD and NPD data of Ag2.7VPF. The SOF of Na3 is found slightly negative, thus is set to 0. The sum of SOFs of all Ag and Na ions is constrained so that it equals 3.00(1).
Ag2.7VPF: Ag2.71(6)Na0.3(2)V2(PO4)2F3
Space group : Amam; Z = 4 a = 9.0843(1) Å, b = 9.0303(1) Å, c = 10.9442(1) Å
V = 897.796(1) Å3, V /Z = 224.449(1) Å3 Combined χ2 = 6.56
Synchrotron RBragg = 7.87%, Synchrotron Rwp = 16.7% Neutrons RBragg = 12.6%, Neutrons Rwp = 18.9%
atom Wyckoff position Atomic position Occ. Biso x/a y/b z/c V 8g ¼ 0.2526(6) 0.1820(4) 1 0.5(1) P 8e 0 0 0.2396(9) 1 0.7(1) O1 16h 0.099(1) 0.094(1) 0.156(1) 1 0.7(2) O2 16h 0.093(1) 0.402(1) 0.175(1) 1 0.7(2) F1 4c ¼ 0.265(2) 0 1 0.8(3) F2 8g ¼ 0.742(2) 0.140(1) 1 1.0(3) Ag1 4c ¼ 0.9610(5) 0 0.93(4) 2.1(1) Ag2 8f 0.9598(7) 0.792(1) ½ 0.51(4) 1.2(2) Ag3 8f 0.942(1) 0.856(2) ½ 0.38(2) 1.6(3) Na1 4c ¼ 0.9610(5) 0 0.03(17) 2.1(1) Na2 8f 0.9598(7) 0.792(1) ½ 0.14(17) 1.2(2)
Based on the combined Rietveld refinement of synchrotron and neutron diffraction patterns (Figure 2 and Table 1), the crystal structure of Ag2.7VPF was obtained and is displayed in Figure 3.
The basic structural framework of Na3V2(PO4)2F3, consisting of
V2O8F3 bi-octahedra bridged by corner-sharing PO4 tetrahedra,
is preserved. The large 2D tunnels are also preserved, hence the relative ease of ion exchange with silver without consequent disruption of the 3D framework of the material is not a surprise. Tables 2 and 3 gather all the significant structural information on PO4 tetrahedra and VO4F2 octahedra, respectively. The most
important differences between the parent structural framework of Na3V2(PO4)2F3 and the one obtained after Ag+/Na+
ion exchange can be summarized as follows:
• more pronounced orthorhombic distortion and longer c axis, as discussed above.
• bond-length distances within the VO4F2 octahedra and PO4
tetrahedra are poorly affected while a small difference is found for V-F bonds: V-F1 increases from 1.98 Å to 1.995(5) Å and V-F2 decreases from 1.97 Å to 1.95(1) Å. • the V-F1-V angle within a bi-octahedron decreases from an almost straight one in Na3V2(PO4)2F3 (179.5(2)°) to a
significantly bent one (173.5(3)°). The bending of this axis occurs within the b-c plane, since x/a = ¼ is fixed by symmetry for V and F1.
The increase of the unit cell can be explained by steric effects of the bigger Ag+ ions with respect to Na+. As reviewed by
Shannon41, the effective ionic radii for 6-coordinated Na+ and
Figure 2: Combined Rietveld refinement of synchrotron XRPD and
NPD of Ag2.7VPF (Ag2.71(6)Na0.3(2)V2(PO4)2F3). Measured data are shown as green dots, Rietveld fit as a black line, their difference as a red line and Bragg positions as blue marks.
ARTICLE Journal Name
Please do not adjust margins
Ag+ are 1.02 Å and 1.15 Å, respectively. This unit cell increase is
in line with what is observed for the Na/Ag substitution in other materials families, such as alluaudites13 and materials of
composition Ag7-xNaxFe3(X2O7)4 (X = P, As) 16-18.
Table 2: Significant bond length distances (Å), angles (°), polyhedral distortion and
Bond-Valence Sum calculations for PO4 tetrahedra in Ag2.71(6)Na0.3(2)V2(PO4)2F3. The P-O distances are given on the diagonal, the O-O distances above the diagonal and the O-P-O angles below.
PO4 O(1) O(1) O(2) O(2)
O(1) 1.54(1) 2.47(2) 2.55(2) 2.54(2) O(1) 106.8(3) 1.54(1) 2.54(2) 2.55(2) O(2) 111.7(3) 110.8(2) 1.54(1) 2.45(2) O(2) 110.8(2) 111.7(3) 105.2(3) 1.54(1)
Distortion Δ = 0.11·10-5
BVS calculation: P average oxidation state = +4.94(9)
Table 3: Significant bond length distances (Å), angles (°), polyhedral distortion and
Bond-Valence Sum calculations for VO4F2 octahedra in Ag2.71(6)Na0.3(2)V2(PO4)2F3. The V-(O,F) distances are given on the diagonal, the (O,F)-(O,F) distances above the diagonal and the (O,F)-V-(O,F) angles below.
VO4F2 O(1) O(1) O(2) O(2) F(1) F(2) O(1) 2.01(1) 2.74(1) 2.80(2) 3.95(2) 2.68(1) 2.94(2) O(1) 86.2(2) 2.01(1) 3.95(2) 2.80(2) 2.68(1) 2.94(2) O(2) 89.5(1) 169.1(2) 1.96(1) 2.85(2) 2.69(2) 2.87(2) O(2) 169.1(2) 89.5(1) 92.9(2) 1.96(1) 2.69(2) 2.87(2) F(1) 84.1(1) 84.1(1) 85.5(1) 85.5(1) 1.995(5) 3.95(2) F(2) 96.1(2) 96.1(2) 94.3(2) 94.3(2) 179.7(2) 1.95(1) Distortion Δ = 1.174·10-4
BVS calculation: V average oxidation state = +3.04(4)
In Na3V2(PO4)2F3, sodium ions are found in planes at z = 0 and z
= ½, distributed on a "triangular" arrangement of three crystallographic sites Na(1), Na(2) and Na(3) (Figure 4) 31. The
first one is fully occupied, while Na(2) and Na(3) have partial occupancy, respectively, close to 2/3 and 1/3. We found that Ag+ ions choose to place themselves on the exact same sites as
the Na+ ions in Na3V2(PO4)2F3. Relative occupations are also
similar (Table 1). Figure 4 gathers Na+ and Ag+ distributions in
the z = 0 plane. Since from SEM-EDX it is found that the ion exchange was not complete we used this information and included both Ag and Na cations in the Rietveld refinement. We observe that remaining Na+ cations are localized in Na(1)
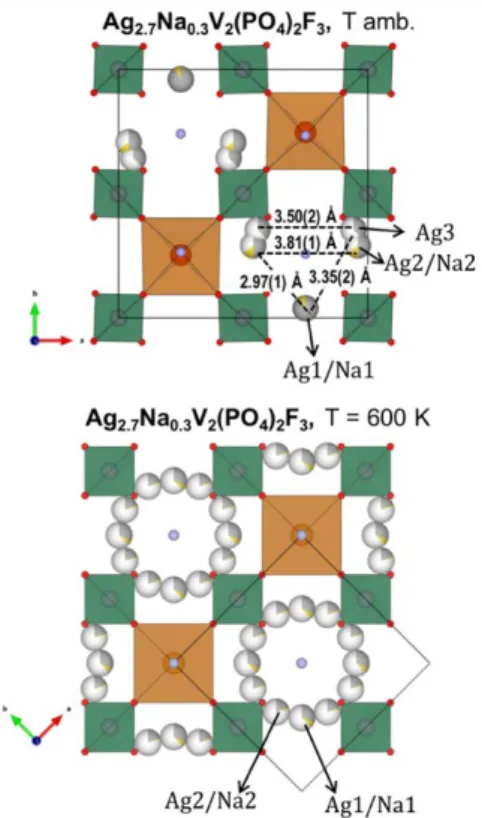
(0.03(17) / f.u.) and mainly Na(2) (0.28(17) / f.u.) sites, but not in the Na(3) one, where the site occupancy factor (SOF) converged to a negligible (slightly negative) value, and was thereafter set to zero. We can conclude that Ag-Ag distances (Figure 4) are very similar to Na-Na ones in Na3V2(PO4)2F3,
except for Ag3-Ag3 which are farther away (Na3-Na3 = 2.84 Å in Na3V2(PO4)2F3 whereas Ag3-Ag3 = 3.50 Å in Ag2.7VPF).
Ag+/Na+ ion exchange in NVPF-c
Given the fact that the ion exchange does not proceed to completion even after 60 hours in NVPF, we prepared a new batch of the material, indicated as NVPF-c, following the procedure described in the Methods Section. In this case, the particle size is smaller, of the order of a few hundreds of nm. We then repeated the ion exchange procedure carried out for NVPF, but with more intermediate characterization steps. Figure 5 shows the evolution of the XRPD patterns as the ionic exchange proceeds, while Table 4 summarizes the evolution of unit cell parameters.
Figure 3: Crystal structure of Ag2.71(6)Na0.3(2)V2(PO4)2F3 obtained by ion exchange with Na3V2(PO4)2F3. The space group Amam is retained, but a more pronounced orthorhombic distortion is induced (a/b from 1.002 to 1.006).
Figure 4:Sodium distribution in Ag2.71(6)Na0.3(2)V2(PO4)2F3 for the room-temperature (Amam) and high-temperature (I4/mmm) polymorphs.
The process gradually progresses over the first 31 hours. One can clearly observe how the kinetics of the ion exchange is much faster in this case, since for NVPF-c V/Z15min = 222.5 Å3, whereas
for the NVPF it was V/Z15min = 220.0 Å3. After 105 min of ion
exchange in NVPF-c, V/Z105min = 224.6 Å3, comparable to the one
obtained after 60 hours for NVPF and characterized in the previous section. In NVPF-c, the ionic exchange is nearly complete after 31 hours. At this time, the unit cell reaches 225.9
Å3. Further exchange, up to a final time of 97 hours, only slightly
increases such value to 226.1 Å3. These observations suggest
that a solid solution domain is present in Na3-xAgxV2(PO4)2F3. We
do not observe any miscibility gap (Figure 5), contrary to what was reported for the Li+/Na+ exchange 35. The difference is likely
due to the ionic radii of the cations (r(Li+) = 0.76 Å, r(Na+)=1.02
Å, r(Ag+)=1.15 Å), since the size mismatch between Li+ and Na+
is much larger than the one between Ag+ and Na+.
Table 4: Unit cell parameters and volume at different reaction times after the
beginning of the Ag+/Na+ ion exchange in Na3V2(PO4)2F3-c. ICP-OES indicates a composition Ag3.1±0.12Na0.12±0.05VPF after 97 hours, close to full exchange.
Time a (Å) b (Å) c (Å) V/Z (Å3) 0 9.028(3) 9.042(3) 10.741(3) 219.2(1) 15 min 9.0639(3) 9.0611(3) 10.8389(2) 222.56(1) 45 min 9.0769(3) 9.0602(3) 10.8863(3) 223.82(1) 105 min 9.0857(3) 9.0561(3) 10.9187(3) 224.60(1) 5 h 9.0923(2) 9.0491(2) 10.9501(3) 225.24(1) 10 h 9.0968(2) 9.0467(2) 10.9668(3) 225.63(1) 31 h 9.0986(2) 9.0443(2) 10.9797(2) 225.88(1) 55 h 9.1004(2) 9.0437(2) 10.9842(2) 226.00(1) 97 h 9.1007(5) 9.0427(6) 10.9880(2) 226.08(2)
The sample that had been ion-exchanged for 97 hours and with the largest unit cell (indicated as Ag3VPF) was measured by
synchrotron XRPD and the resulting pattern refined by the Rietveld method (Figure 6). No sodium is included in the refinement because ICP-OES only indicates the presence of 0.12(5) Na/f.u., and such a small amount of Na is difficult to localize, being on the same sites as Ag. The long exchange in NVPF-c results in significantly larger unit cell parameters as compared to NVPF (Table 1), with the SOF of Ag converging to a value of 2.87(6) Ag/f.u. Despite the broader reflections, the fit quality (RBragg) of Ag3VPF is satisfactory. Yet, we should mention
the presence of additional small peaks not taken into account. Although few of them belong again to metallic Ag, most are actually not indexed and might indicate a different unit cell symmetry (Figure S3 in the Supp. Info). Note that no orthorhombic cell, even in low-symmetry s.g. Pmmm, is able to index the extra observed peaks. At present we cannot be conclusive on whether such peaks belong to the phase (as a monoclinic distortion or a superstructure, for example), and this is currently object of further study.
Figure 5: Evolution of the XRPD patterns of Na3V2(PO4)2F3–c as the Ag+/Na+ ion exchange proceeds. The different positions of selected Bragg peaks, indexed in the orthorhombic Amam space group, are highlighted at the top. The unit cell volume obtained from Rietveld refinement is also indicated.
Figure 6: Rietveld refinement of synchrotron XRPD of Ag3VPF. Measured data are shown as green dots, Rietveld fit as a black line, their difference as a red line and Bragg positions as blue marks.
ARTICLE Journal Name
Please do not adjust margins
Table 5: Structural parameters obtained from Rietveld refinement of synchrotron XRPD
data of Ag3V2(PO4)2F3-c. No Na is included in the refinement.
Ag3V2(PO4)2F3-c
Space group : Amam; Z = 4 a = 9.1008(5) Å, b = 9.0429(6) Å, c = 10.9880(6) Å V = 904.29(9) Å3, V /Z = 226.07(2) Å3 χ2 = 68.4 Rbragg = 6.86%, Rwp = 12.9% atom Wyckoff position Atomic position Occ. Biso x/a y/b z/c V 8g ¼ 0.2532(9) 0.1834(6) 1 0.5(2) P 8e 0 0 0.260(1) 1 1.7(3) O1 16h 0.094(2) 0.094(2) 0.155(1) 1 0.9(5) O2 16h 0.094(2) 0.406(2) 0.154(1) 1 0.9(5) F1 4c ¼ 0.273(4) 0 1 2.5(9) F2 8g ¼ 0.738(3) 0.143(2) 1 1.8(6) Ag1 4c ¼ 0.9596(8) 0 0.97(1) 3.1(2) Ag2 8f 0.962(2) 0.779(4) ½ 0.41(2) 1.4(5) Ag3 8f 0.945(2) 0.846(3) ½ 0.54(2) 2.6(4)
The High Temperature crystal structure of the Ag+/Na+ ion-exchanged phase
Both Na3V2(PO4)2F3 and its oxidized relative Na3V2(PO4)2FO2 are
known to undergo an order-disorder phase transition upon heating at 100 °C and 200 °C, respectively32, 42. The disordering
of sodium cations results in a tetragonal unit cell, smaller by a factor of 2 and rotated by 45° around the c axis with respect to the room-temperature one (Figure 4). To assess the behavior of the Ag+ ion-substituted compound, we realized an in situ
synchrotron temperature-controlled XRPD experiment. The sample we used was Ag2.7VPF obtained from NVPF, as the larger
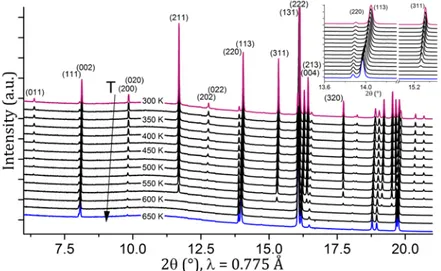
crystallite size allows a better resolution in the in situ experiment. Figure 7 shows the evolution of the diffracted peaks during the cooling process, i.e. the sample Ag2.7VPF was
heated offline to 350 °C and then measured in the beamline upon cooling. We can observe that the transition occurs at a temperature 300 °C < T < 325 °C (Figure 7), significantly higher than the one observed for Na3V2(PO4)2F3. Its signature is the
disappearance/appearance (in case of heating/cooling, respectively) of the Bragg peaks typical of the larger sodium-ordered unit cell.
The synchrotron XRPD pattern measured at ~350 °C (625K) was used for a detailed structural refinement by the Rietveld method. The results of the structural analysis are reported in Table 6. Firstly one should note that the Ag amount is independently refined and, as in the RT case, it yields 2.72(2) Ag/f.u.. Ag2.70VPF follows the same disordering scheme than
reported for Na3V2(PO4)2F3. Thus, no significant differences are
present within the skeleton of the compound between the RT and high-T phases. The main difference is instead in the position and arrangement of the monovalent cations within the z = 0 and z = 1/2 planes. They disorder in a circular arrangement around the fluorine that terminates the bi-octahedra. This in turn
induces a homogeneous electrostatic repulsion along the a and b axes, and thus favors the tetragonal symmetry of the structure.
Table 6: Structural parameters obtained from Rietveld refinement of synchrotron XRPD
of Ag2.7VPF at 350 ºC. 0.3 Na/f.u. are included in the refinement, as obtained in the RT case. Only site Na1 is included because it is Wyckoff position 8h, corresponding to both Na1 and Na2 sites in the RT Amam s.g.).
Ag2.7VPF: Ag2.72(2)Na0.3V2(PO4)2F3 (350 ºC)
Space group : I4/mmm; Z = 2 a = 6.4176(1) Å, b = 6.4176(1) Å, c = 11.0198(1) Å V = 453.856(3) Å3, V /Z = 226.928(1) Å3 χ2 = 4.09 Rbragg = 9.61%, Rwp = 11.3% atom Wyckoff position Atomic position Occ. Biso x/a y/b z/c V 4e 0 0 0.1819(3) 1 1.0(1) P 4d ½ 0 ¼ 1 1.6(1) O 16n 0.3082(9) 0 0.1651(5) 1 1.4(1) F1 2a 0 0 0 1 1.7(4) F2 4e 0 0 0.3568(9) 1 1.9(3) Ag1 8h 0.2871(5) 0.2871(5) 0 0.30(1) 2.8(2) Ag2 16l 0.409(1) 0.210(1) 0 0.19(1) 3.8(3) Na1 8h 0.2871(5) 0.2871(5) 0 0.075(-) 2.8(2)
DFT calculations by Matts et al.43 shed light on the migration
barriers of sodium into the structure of Na3V2(PO4)2F3. In
particular, they calculated a very low migration barrier for sodium along the rings (Figure 5c in 43, but that can also be seen
in Figure 4), of the order of 20 meV. This is of the same order of the thermal energy at room T, usually estimated as 25 meV, which can well explain why the orthorhombic structure features sodium ions in partial occupancy positions. Bringing the temperature to 100 °C in Na3V2(PO4)2F3 (corresponding to ≈35
meV) is sufficient to trigger the complete sodium disordering within such rings, in rather good agreement with Matts et al. The fact that the disordering does not happen until 300 °C in Ag2.7VPF is an indication that the migration barriers for Ag are
higher than for Na. One should also note that the Na hops within the rings described above are non-percolating, hence do not result in macroscopic sodium diffusion. A much higher energy barrier is calculated for Na hops between neighboring rings, of the order of 0.6 eV and above 43. These hops are required for
macroscopic diffusion; in fact, recently the activation energy for Na conduction in Na3V2(PO4)2F3 was measured by Impedance
Spectroscopy and reported to be 680 meV (or even greater) 44, 45, in good agreement with the calculations.
We have hereby studied the ionic exchange between Na and Ag within the structural framework of the electrode material Na3V2(PO4)2F3. The exchange proceeds close to completion in
roughly 30 hours if NVPF with particles below µm size used. On the other hand, 60 hours are not sufficient to complete it for larger particles due to kinetic limitations. The ionic exchange, close to completion, results in a silver-exchanged compound of orthorhombic symmetry. Although the XRPD and NPD patterns look significantly different after the exchange because of the high atomic weight of silver compared to sodium, we obtain from Rietveld refinement a crystal structure strongly related to the parent one. We have detailed the main differences, which are few, supporting the fact that the framework of Na3V2(PO4)2F3 is capable of high ionic conductivity and can
support the presence of different monovalent ions. Finally, we have shown that Ag2.7VPF undergoes an order-disorder
transition upon heating, that transforms the symmetry from orthorhombic to tetragonal as a consequence of Ag+
disordering. This transition occurs close to 600 K while a similar one in Na3V2(PO4)2F3 occurs at 400 K, showing that Ag is less
prone to disordering than sodium within this framework. Ag3V2(PO4)2F3 is possibly a new polyanionic framework capable
of Ag+ ionic conduction, and we suggest it could be used as a
cathode in rechargeable or primary silver-based batteries.
Conflicts of interest
There are no conflicts to declare.
Acknowledgements
The authors thank T. Broux (ICMCB/LRCS) for the preparation of the sample Na3V2(PO4)2F3 and L. Etienne (ICMCB) for technical
assistance in the chemical analyses by ICP-OES.
Notes and references
1. A. K. Padhi, K. S. Nanjundaswamy and J. B. Goodenough,
Journal of The Electrochemical Society, 1997, 144,
1188-1194.
2. C. Masquelier and L. Croguennec, Chemical Reviews, 2013,
113, 6552-6591.
3. S.-W. Kim, D.-H. Seo, X. Ma, G. Ceder and K. Kang,
Advanced Energy Materials, 2012, 2, 710-721.
4. Z. Jian, W. Han, X. Lu, H. Yang, Y.-S. Hu, J. Zhou, Z. Zhou, J. Li, W. Chen, D. Chen and L. Chen, Advanced Energy
Materials, 2013, 3, 156-160.
5. R. K. B. Gover, A. Bryan, P. Burns and J. Barker, Solid State
Ionics, 2006, 177, 1495-1500.
6. R. Shakoor, D.-H. Seo, H. Kim, Y.-U. Park, J. Kim, S.-W. Kim, H. Gwon, S. Lee and K. Kang, Journal of Materials
Chemistry, 2012, 22, 20535-20541.
7. J.-M. Tarascon, Nat Chem, 2010, 2, 510-510.
8. The Economist, 2016, An increasingly precious metal.
9. J. N. Bradley and P. D. Greene, Transactions of the Faraday
Society, 1967, 63, 424-430.
10. J. Angenault, J. C. Couturier and M. Quarton, Materials
Research Bulletin, 1989, 24, 789-794.
11. K. Koteswararao, G. Rambabu, M. Raghavender, G. Prasad, G. Kumar and M. Vithal, Solid State Ionics, 2005, 176, 2701-2710.
12. G. Rambabu, N. Anantharamulu, K. Koteswara Rao, G. Prasad and M. Vithal, Materials Research Bulletin, 2008,
43, 1509-1518.
13. A. Daidouh, C. Durio, C. Pico, M. L. Veiga, N. Chouaibi and A. Ouassini, Solid State Sciences, 2002, 4, 541-548. 14. A. Daidouh, M. L. veiga and C. Pico, Journal of Solid State
Chemistry, 1997, 130, 28-34.
15. H. Fukuoka, H. Matsunaga and S. Yamanaka, Materials
Research Bulletin, 2003, 38, 991-1001.
16. E. Quarez, O. Mentre, Y. Oumellal and C. Masquelier, New
Journal of Chemistry, 2009, 33, 998-1005.
17. E. Quarez, O. Mentré, K. Djellab and C. Masquelier, New
Journal of Chemistry, 2010, 34, 287-293.
18. C. Masquelier, F. d'Yvoire, E. Bretey, P. Berthet and C. Peytour-Chansac, Solid State Ionics, 1994, 67, 183-189.
Figure 7: Synchrotron XRPD data measured as a function of temperature upon cooling. The order-disorder
ARTICLE Journal Name
Please do not adjust margins
19. M. Meunier, R. Izquierdo, L. Hasnaoui, E. Quenneville, D. Ivanov, F. Girard, A. Yelon and M. Paleologou, Applied
Surface Science, 1998, 127-129, 466-470.
20. R. Collongues, A. Kahn and D. Michel, Annual Review of
Materials Science, 1979, 9, 123-150.
21. J. Alamo and R. Roy, Journal of Materials Science, 1986, 21, 444-450.
22. R. Roy, E. R. Vance and J. Alamo, Materials Research
Bulletin, 1982, 17, 585-589.
23. A. Serghini, M. Kacimi, M. Ziyad and R. Brochu, JOURNAL
DE CHIMIE PHYSIQUE ET DE PHYSICO-CHIMIE BIOLOGIQUE,
1988, 85, 499-504.
24. N. Hirose and J. Kuwano, Journal of Materials Chemistry, 1994, 4, 9-12.
25. D. C. Bock, A. C. Marschilok, K. J. Takeuchi and E. S. Takeuchi, Electrochimica Acta, 2012, 84, 155-164.
26. K. Kirshenbaum, D. C. Bock, C. Y. Lee, Z. Zhong, K. J. Takeuchi, A. C. Marschilok and E. S. Takeuchi, Science, 2015, 347, 149-154.
27. K. J. Takeuchi*, A. C. Marschilok, S. M. Davis, R. A. Leising and E. S. Takeuchi*, Coordination Chemistry Reviews, 2001,
219, 283-310.
28. J. Barker, R. K. B. Gover, P. Burns and A. J. Bryan,
Electrochemical and Solid-State Letters, 2006, 9,
A190-A192.
29. A. Ponrouch, R. Dedryvere, D. Monti, A. E. Demet, J. M. Ateba Mba, L. Croguennec, C. Masquelier, P. Johansson and M. R. Palacin, Energy & Environmental Science, 2013,
6, 2361-2369.
30. M. Bianchini, P. H. Xiao, Y. Wang and G. Ceder, Advanced
Energy Materials, 2017, 7.
31. J. M. Le Meins, M. P. Crosnier-Lopez, A. Hemon-Ribaud and G. Courbion, Journal of Solid State Chemistry, 1999, 148, 260-277.
32. M. Bianchini, N. Brisset, F. Fauth, F. Weill, E. Elkaim, E. Suard, C. Masquelier and L. Croguennec, Chemistry of
Materials, 2014, 26, 4238-4247.
33. Y.-U. Park, D.-H. Seo, B. Kim, K.-P. Hong, H. Kim, S. Lee, R. A. Shakoor, K. Miyasaka, J.-M. Tarascon and K. Kang,
Scientific Reports, 2012, 2.
34. Q. Feng, K. Peng, Z. Huang, W. Yan, S. Tang and Q. Liu,
Journal of Power Sources, 2015, 280, 703-709.
35. Y.-U. Park, J. Bai, L. Wang, G. Yoon, W. Zhang, H. Kim, S. Lee, S.-W. Kim, J. P. Looney, K. Kang and F. Wang, Journal
of the American Chemical Society, 2017, 139, 12504-12516.
36. T. Broux, T. Bamine, F. Fauth, L. Simonelli, W. Olszewski, C. Marini, M. Ménétrier, D. Carlier, C. Masquelier and L. Croguennec, Chemistry of Materials, 2016, DOI: 10.1021/acs.chemmater.6b02659.
37. France Pat., FR1559709, 2015.
38. F. Fauth, I. Peral, C. Popescu and M. Knapp, Powder
Diffraction, 2013, 28, S360-S370.
39. H. M. Rietveld, Journal of Applied Crystallography, 1969, 2, 65.
40. J. Rodriguez-Carvajal, Physica B, 1993, 192, 55-69. 41. R. Shannon, Acta Crystallographica Section A, 1976, 32,
751-767.
42. A. A. Tsirlin, R. Nath, A. M. Abakumov, Y. Furukawa, D. C. Johnston, M. Hemmida, H. A. Krug von Nidda, A. Loidl, C. Geibel and H. Rosner, Physical Review B, 2011, 84, 014429. 43. I. L. Matts, S. Dacek, T. K. Pietrzak, R. Malik and G. Ceder,
Chemistry of Materials, 2015, 27, 6008-6015.
44. C. Zhu, C. Wu, C.-C. Chen, P. Kopold, P. A. van Aken, J. Maier and Y. Yu, Chemistry of Materials, 2017, 29, 5207-5215. 45. T. Broux, B. Fleutot, R. David, A. Brüll, P. Veber, F. Fauth, M.
Courty, L. Croguennec and C. Masquelier, Chemistry of
Materials, 2017, DOI: 10.1021/acs.chemmater.7b03529.