HAL Id: hal-00331889
https://hal.archives-ouvertes.fr/hal-00331889
Submitted on 19 Oct 2008
HAL is a multi-disciplinary open access archive for the deposit and dissemination of sci-entific research documents, whether they are pub-lished or not. The documents may come from teaching and research institutions in France or
L’archive ouverte pluridisciplinaire HAL, est destinée au dépôt et à la diffusion de documents scientifiques de niveau recherche, publiés ou non, émanant des établissements d’enseignement et de recherche français ou étrangers, des laboratoires
Effects of Lipid Extraction on δ13C and δ15N Values in
Seabird Muscle, Liver and Feathers
Jessica Kojadinovic, Pierre Richard, Matthieu Le Corre, Richard Cosson,
Paco Bustamante
To cite this version:
Jessica Kojadinovic, Pierre Richard, Matthieu Le Corre, Richard Cosson, Paco Bustamante. Effects of Lipid Extraction on δ13C and δ15N Values in Seabird Muscle, Liver and Feathers. Waterbirds, Waterbird Society, 2008, 31 (2), pp.169-178. �10.1675/1524-4695(2008)31�. �hal-00331889�
Reference : CW07-020
Send proof to: Jessica Kojadinovic, 9 B Glover Rd, Saint Heliers, 1005 Auckland, New Zealand
e-mail: jessica.kojadinovic@univ-nantes.fr
Effects of Lipid Extraction on δ13C and δ15N Values in Seabird Muscle, Liver and Feathers
JESSICA KOJADINOVIC123*, PIERRE RICHARD1, MATTHIEU LE CORRE2, RICHARD P. COSSON3 AND PACO BUSTAMANTE1
1
CRELA, UMR 6217, CNRS-IFREMER-Université de La Rochelle, 22 avenue Michel Crépeau, La Rochelle, F-17042 France
2
Université de La Réunion, ECOMAR, 15 avenue René Cassin, Saint Denis de La Réunion, F-97715 France
3*
Université de Nantes, EMI, EA 2663, 2 chemin Houssinière, Nantes cedex 3, F-44322 France
Abstract.- We determined whether lipid extraction of seabird muscle, liver and feathers is required
for δ13C and δ15N analysis, based on a study of Barau’s Petrels (Pterodroma baraui) and
White-tailed Tropicbirds (Phaethon lepturus). Samples were analyzed for stable isotopes before and after
lipid removal. Lipid-free muscle and liver were significantly enriched in 13C compared to those
containing lipids (0.52 ‰ and 0.61 ‰ mean differences in δ13C respectively) implying that lipids
should be extracted from these tissues to avoid effects of uncontrolled differential lipid content.
However lipid extraction also slightly increased muscle δ15N values in tropicbirds. Researchers
should thus run samples separately for δ13C and δ15N analysis, extracting lipids only in aliquots in
which δ13C is measured, or apply arithmetic δ13C normalization methods on non lipid-extracted
samples. Predictive models developed from our data, inferring δ13C values of lipid-extracted
material from δ13C values and C:N ratios of non lipid-extracted material are presented and compared
to five normalization methods taken from literature. Our models showed the best prediction
efficiencies followed by that developed by McConnaughey and McRoy (1979). In feathers, no
difference in stable isotopic measurements were noted between aliquots treated with sodium
hydroxide or 2:1 chloroform:methanol. Both protocols seem suitable for preparing feather samples
for isotopic analysis.
Key words.- Carbon-13, Lipid extraction, Marine birds, Nitrogen-15, Stable isotopes.
In waterbird ecology stable carbon (δ13C) and nitrogen (δ15N) isotopic analysis is
increasingly being used as a tool to delineate dietary patterns (Nisbet et al. 2002; Dahl et al. 2003;
Cherel et al. 2005b; Quillfeldt et al. 2005), trophic relationships (Thompson et al. 1999, Forero and
Hobson 2003, Dehna et al. 2006) or migratory routes (Cherel et al. 2000, Rubenstein and Hobson
2004). All of these applications take advantage of natural variations in stable isotope ratios resulting
from chemical or biological processes and of the predictability of the stable isotopic compositions of
consumer tissues in relation to that of their diet (DeNiro and Epstein 1978, Kelly 2000, Vander
Zanden and Rasmussen 2001). Prior to isotopic analysis in birds, most authors extract lipids
contained in tissues (Kelly 2000) as they can induce a bias in δ13C readings because i) lipids are
typically more depleted in 13C relative to other tissue components (DeNiro and Epstein 1977)
resulting in differences in δ13C of around 6 – 8 ‰ (DeNiro and Epstein 1977; McConnaughey and
McRoy 1979) and ii) considerable heterogeneity in lipid content exists among animals and among
tissues within an organism (McConnaughey and McRoy 1979; Sweeting et al. 2006; Post et al.
2007). However, the diversity of lipid extraction procedures employed in isotopic studies is of
concern as the efficiencies of each procedure may differ. Moreover, lipid extractions using the Bligh
and Dyer (Bligh and Dyer 1959), the Folch (Folch et al. 2003) or the Soxhlet (Soxhlet 1879) methods
have been shown to remove some nitrogenous compounds which, in some cases, results in changes
in δ15N values (Pinnegar and Polunin 1999; Cherel et al. 2005a; Sweeting et al. 2006). Nevertheless,
in certain tissues with low lipid content, isotopic signatures do not differ significantly between
lipid-free and bulk aliquots. It has, for example, been established that there is no need to extract lipids
determined i) whether the removal of lipids from seabird muscle, liver and feathers is a needed
prerequisite for δ13C analysis and ii) whether lipid removal has an effect on δ15N values based on the
study of two tropical species: Barau’s Petrel (Pterodroma baraui) and White-tailed Tropicbird
(Phaethon lepturus). To this effect, valuesof δ13C and δ15N resulting from the analysis of bulk
sample material were compared to values obtained from the analysis of an aliquot from which lipids
were extracted using cyclohexane for muscle and liver, and using a modified Folch rinse for feathers.
In the case where the two previous assertions are true, potential solutions are considered.
METHODS
Bird Sampling and Tissue Preparation
Barau’s Petrels and White-tailed Tropicbirds were sampled in Reunion Island, a tropical
island situated 700 km east of Madagascar (21°7’S ; 55°33’E). All birds died accidentally, mainly by
collision with urban lights and by poaching. Since these birds were found before or shortly after their
death, we are confident that the conditions in which the birds died had no effect on carbon and
nitrogen in their tissues.
Two age classes were determined (juvenile and adult) using characteristic features of the beak
and the feathers (Barré et al. 1996, authors unpubl. data). Liver, kidney and pectoral muscles were
removed, weighed and stored at -20°C. Breast feathers were also sampled on each bird. Emaciation
was estimated by evaluating the muscular condition (MC) which was given an index from one to
slight pectoral muscle atrophy; three, severe pectoral muscle atrophy (Bolton et al. 1991). Body
condition (BC) was also evaluated using a condition index proposed by Wenzel and Adelung (1996).
This condition index is the ratio of liver to kidney masses and is significantly negatively correlated to
the degree of emaciation of the bird (Debacker et al. 2001). The healthiest birds were selected for
this study: MC equal to one or two, and mean BC equal to 324 ± 41 for Barau’s Petrels and 255 ± 68
for tailed Tropicbirds. Muscle samples originated from 20 adult Barau’s Petrels and 24
White-tailed Tropicbirds, and liver samples from 20 Barau’s Petrels and 20 White-White-tailed Tropicbirds. Breast
feathers came from ten Barau’s Petrels.
To prepare for isotopic determination, livers and muscles were frozen at -80°C, freeze dried
and ground to fine powder. Feathers were washed vigorously in triple baths of 0.25 N sodium
hydroxide solution alternated with triple baths of deionized water, a method commonly used to
remove external contamination as it may interfere with isotopic measurement results (Walsh 1990;
Thompson et al. 1998; Schreiber and Burger 2001). Feathers were then dried in an oven for 24 h at
50°C.
Lipid Extraction
Each sample was divided into two aliquots. For the first aliquots, the preparation ended at the
protocol step described above. The second aliquots were submitted to lipid extraction processes
commonly employed in bird studies (e.g. Hobson et al. 2002; Sagerup et al. 2002; Cherel et al.
2005a).
aliquots of about 1 g. An ultra Turax was used to homogenize the mixture (2 x 15 sec). The sample
was then centrifuged for 2 min at 804 g. The supernatant containing the lipids was then disposed off,
whereas the pellet was dried on an aluminum plate for 12 h at 60°C. All utensils were washed with
detergent, then with ethanol, rinsed with deionized (Milli-Q quality) water and dried in an oven at
60°C before use.
A modified Folch method was applied to the feathers. They were soaked in a 2:1
chloroform:methanol rinse (still for 30 min, followed by five min sonication). Feathers were then
dried in an oven and cut into small fragments.
Isotopic Analysis
Stable carbon and nitrogen isotope assays were carried out on 1 ± 0.02 mg subsamples of
powder loaded into tin cups. Continuous-flow isotope-ratio mass spectrometry (CF-IRMS) analyses
were conducted using a Europa Scientific NT 20-20 Stable Isotope Analyzer with
ANCA-NT Solid/Liquid Preparation Module (Europa Scientific Ltd., Dundee, UK). Every ten samples were
separated by two laboratory standards (leucine) which were calibrated against “Europa flour” (potato
flour) and IAEA standards N1 and N2 (Scrimgeour and Robinson 2003). Sample analysis also
yielded carbon and nitrogen percentages from which carbon-to-nitrogen (C:N) ratios (by weight)
were derived. Experimental precision (based on the standard deviation of replicate measurements of
the internal standards) for δ13C, δ15N, %C and %N was 0.07 ‰, 0.12 ‰, 1.61 % and 0.29 %
Stable isotope results are expressed in delta notation (δ), defined as the part per thousand
(‰) deviation from a standard material:
δ = [(Rsample / Rstandard) − 1] × 1000
where Rsample and Rstandard are the fractions of heavy to light isotopes in the sample and standard,
respectively. The international standards are, the Pee Dee Belemnite (PDB) marine fossil limestone
formation from South Carolina for δ13C, and atmospheric nitrogen for δ15N.
Statistical analysis
Statistical analyses were performed using the GNU R statistical system (R Development Core
Team 2005). Data were first checked for normality and homogeneity of the variances by means of
Shapiro-Wilk and Bartlett tests respectively. Wilcoxon and t-tests for paired samples were used
accordingly to test the significance of differences of the isotopic deviations and the C:N ratios
between aliquots. Isotopic deviation results are reported as means and standard deviations (SD).
RESULTS
Muscle and Liver
Results presented in Table 1 show that lipid extraction significantly affected δ13C values in
muscle and liver of both species, lipid-free aliquots being enriched in 13C by, on average, 0.52 ± 0.56
mean difference between bulk (δ13Cbulk) and lipid-extracted (δ13Cext) δ13C values (3.22 ‰) was seen
in juvenile Barau's Petrel liver where lipid content seemed to be the highest (C:N ratio of 5.81). The
only case where δ13Cext values were not significantly different from δ13Cbulk values was noted when
the tests were restrictively applied to adult Barau’s Petrel liver. Of the 84 samples, nine showed very
slightly negative value for the difference between δ13Cext and δ13Cbulk values (∆δ13C); this
deviation below the theoretical value of zero for lipid-free tissue was close to the analytical
precision. Furthermore ∆δ13C were positively correlated in a linear fashion with C:N ratios in bulk
material from both tissues (Figure 1). After lipid extraction, C:N ratios in both species dropped close
to a value of 4 in both tissues with average variation becoming lower (Table 1); the average
post-extraction C:N ratio of all seabirds was 3.90 ± 0.14 in muscle and 4.06 ± 0.23 in liver.
Stable nitrogen isotope values were affected by lipid extraction only in White-tailed
Tropicbird muscle in which lipid-extracted δ15N (δ15Next) values were, on average, 0.20 ‰ higher
than bulk δ15N (δ15Nbulk) values (Table 1).
Feathers
Feather δ13C and δ15N values did not differ significantly between the samples washed in
sodium hydroxide baths and the corresponding aliquots having undergone sodium hydroxide and 2:1
chloroform:methanol baths (Table 1), although C:N ratio decreased slightly but significantly (p =
DISCUSSION
Muscle and Liver
The enrichment of 13C with lipid extraction observed in Barau's Petrel and in White-tailed
Tropicbird tissues were lower than the 1.3 ‰ value reported by Kelly (2000) for the muscle of
carnivorous seabirds and consistent with the 0.61 to 0.67 ‰ increase noted in fish muscle (Pinnegar
and Polunin 1999; Sweeting et al. 2006). These results suggest that lipids present in Barau’s Petrel
and White-tailed Tropicbird muscular and hepatic tissues alter their stable carbon isotope signatures.
This experiment adds to the growing body of evidence supporting lipid extraction as a prerequisite to
δ13
C determination in lipid-rich avian tissues, namely muscle and liver, as in several other organisms
(Pinnegar and Polunin 1999; Kelly 2000; Sweeting et al. 2006; Bodin et al. 2007).
Lipid extraction affected δ15N only in White-tailed Tropicbird muscle. Some lipids, for
example glycolipids or lipoproteins, contain nitrogenous compounds. It is possible that such
nitrogenous compounds or protein material were lost during the lipid extraction process, explaining
the change in the muscular δ15N signatures of White-tailed Tropicbirds. This average increase of
0.20 ‰ of δ15N values with lipid extraction is very close to that observed by Post et al. (2007) when
working on a variety of animals (0.25 ± 0.18 ‰). The fact that an effect of lipid-extraction was
observed only in White-tailed Tropicbird muscle might be linked to differences in physiological
makeup between tissues and species.
In conclusion, lipid extraction is necessary for δ13C determination in seabird muscle and liver
run in separate batches of treated (for δ13C determination) and untreated (for δ15N determination)
aliquots. Separated analysis are however time consuming and costly. An alternative to dual analysis
and lipid extraction is the use of arithmetic correction techniques for predicting δ13Cext values. These
include lipid normalization models that predict δ13Cext values (δ13Cpredicted) from sample δ13Cbulk
values and C:N ratios (McConnaughey and McRoy 1979; Alexander et al. 1996; Kiljunen et al.
2006; Bodin et al. 2007; Post et al. 2007). These equations present the advantage not to require
information neither on lipid content, lipid δ13C signatures nor on C:N ratios in protein. The three
most commonly used lipid normalization models are of the following form:
δ13
Cpredicted = δ13Cbulk + D ((I + 3.9) / (1 + 287 / L)) Eqn 1
δ13
Cpredicted = δ13Cbulk + D (L / 100) Eqn 2
δ13
Cpredicted = a (C:N) + b + δ13Cbulk Eqn 3
In these equations, L, a function of C:N, is an approximation of the proportional lipid content of the
bulk sample established by McConnaughey and McRoy (1979): L = 93 / (0.246 × (C:N) – 0.775) – 1.
I, a and b are parameters estimated from data. D is the difference in δ13C between protein and lipid;
it is sometimes estimated from data and sometimes fixed to 6 ‰, a value derived from published
data (McConnaughey and McRoy 1979; Alexander et al. 1996). Note that Equation 1 can be
equivalently rewritten as:
δ13
Cpredicted = δ13Cbulk + D I + D f(C:N) Eqn 4
Here, in order to obtain δ13C normalization models for seabird muscle and liver tissues, we fitted, by
least squares, Equations 3 and 4 to the observed data (Figure 1), which led to new estimations of a
and b, and D and I. Equation 4 was also fitted to the observed data by estimating only I and by
assigning D a value of 6. Additionally, a modified version of Equation 3, containing a third
parameter (c), was fitted to the observed data:
δ13
Cpredicted = a (C:N) + b + c δ13Cbulk Eqn 5
To ensure better clarity in the following discussion, models given in Equations 1 and 4 will be
referred to as models of Type I, and models given in Equations 3 and 5 to models of Type II and III
respectively. The values of the parameters estimated in different studies, including this one, are
presented in Table 2.
In order to compare the predictive quality of the different models for the considered seabird
data, we calculated the root mean squared error (rmse) between the observed and the predicted
values of δ13C. For the models estimated from the seabird data themselves, to avoid biased results,
the rmses were computed using leave-one-out cross validation: for each of the n observations (n = 44
and n = 40 for muscle and liver respectively), the δ13Cpredicted value was computed using the model
estimated from the n - 1 remaining observations; the square root of the mean of the n squared errors
between the predicted and the observed values was then calculated. From the rmses presented in
Table 2, it appears that the leave-one-out models estimated from the observed data led, in all cases,
to the lowest rmses which could have been expected. They are followed by the models proposed by
and Kiljunen et al. (2006) in decreasing order of fitness. The significance of the differences between
the δ13Cpredicted values by these models was tested using t-tests for paired samples. The results,
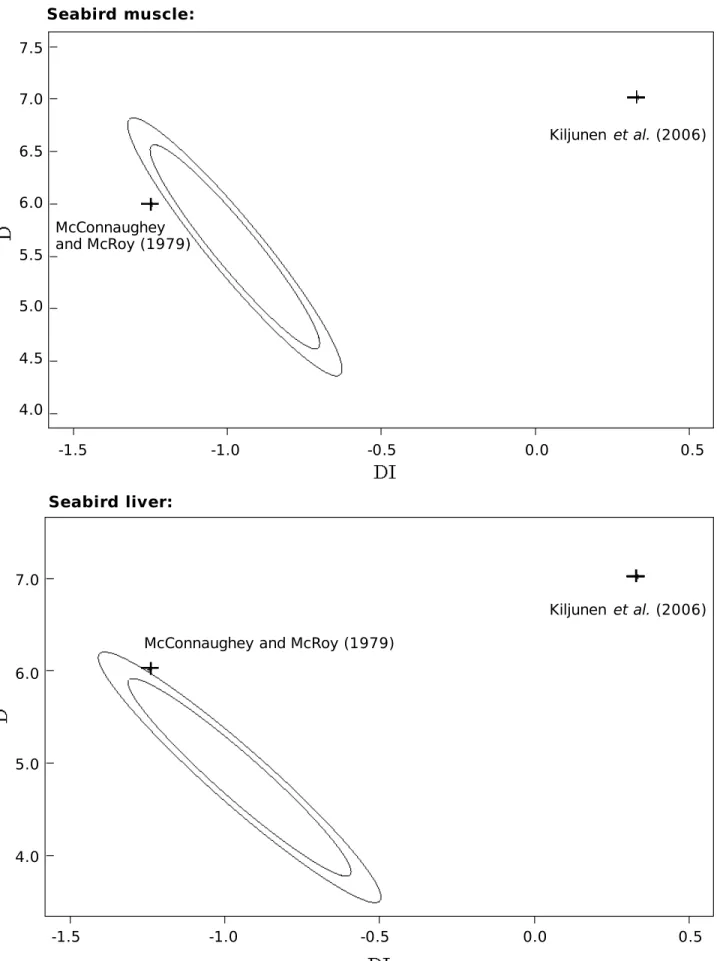
assuming a 5 % significance level, are presented in columns M and L of Table 2. Furthermore, the
95 % confidence intervals, and the 95 % and 99 % confidence ellipses (Faraway 2005; Murdoch et
al. 2007) for the estimated parameters of models of Type I and II are presented in Table 2 (column
6), and in Figures 2a and 2b respectively. When confronted to the confidence ellipses, the parameters
estimated by the other authors for models of Type I and II are outside the ellipses indicating
significant differences between our fitted models for muscle and liver and the existing models. This
was confirmed by the paired t-test results which showed that significant differences existed among
δ13
Cpredicted values predicted by the models of other authors in all but one case (between the models
developed by Post et al. (2007) and Alexander et al. (1996) when applied to the liver data set) and
that the absence of significant differences among δ13Cpredicted values for our models should not be
rejected (Table 2). This suggest that, for all types of models, the parameters of the relation between
δ13
Cext, and C:N and δ13Cbulk, strongly vary with the biological material. In Figure 3, the
δ13
Cpredicted values calculated using the best models (in terms of rmse) fitted from our data for
muscle (Equation 3 with a = 0.828 and b = -3.147) and liver (Equation 5 with a = 0.350, b = -4.162
and c= 0.838) are plotted against the observed δ13Cext values and compared to δ13Cpredicted values
calculated using the five other models obtained from literature. A part from the Bodin et al. (2007)
model applied to liver, the models seem to overestimate the δ13Cpredicted values in seabird tissues.
Globally, of the five models, none predicts δ13Cext values from δ13Cbulk and C:N values stemming
The arithmetic lipid normalization models established in this study have been estimated from
seabirds originating from a single location, belonging to only two species and characterized by a
fairly narrow and low range of C:N ratios. Type I models nonlinearly relate ∆δ13C to C:N because of
the expectation that ∆δ13C will converge to D at high C:N ratios (McConnaughey and McRoy 1979;
Alexander et al. 1996). If this is so, our samples might be sitting within the region where ∆δ13C and
C:N are linearly related (Figure 1). Hence, as the differences in the predictive qualities of the four
models estimated here were not significant, we suggest that the model of Type I (where D = 6 and I
= - 0.180 and - 0.220 in muscle and liver respectively) be used in priority by researchers wanting to
apply these seabird-adapted models to their samples. However, because the nature of the biological
material and the range of C:N ratios seem to influence lipid normalization models, the models
proposed here for seabird muscle and liver should be validated using an independent data set from
other species of seabirds from various locations and habitats, and extended to a larger range of C:N
ratios before being considered fit for general use in seabird studies. More generally, if researchers
want to fit one of the three types of models to their data, it is recommended that they choose Type I
models since their functional form seems to be the most appropriate for large C:N ranges, and they
do not appear to perform significantly worse when the C:N range is small and the relationship
between ∆δ13C and C:N appears as linear.
Feathers
between samples washed in sodium hydroxide baths and the corresponding aliquots having
undergone sodium hydroxide and 2:1 chloroform:methanol baths: either i) sodium hydroxide baths
are efficient in extracting lipids that cover the bird’s plumage or, ii) lipids attached to the feather
surface do not significantly alter isotopic signatures.
Kiljunen et al. (2006) consider that tissues deprived of lipid have a C:N ratio equal to three.
C:N ratios in in Barau's Petrels' bulk feather samples were close to this value, on average equal to
3.19, indicating low lipid levels, and decreased only very slightly to 3.15 after the modified Folch
treatment. Considering the first hypothesis, these results imply that sodium hydroxide baths are
efficient in extracting plumage lipids but not to the extent of the modified Folch method. Ambrose
(1993) showed that sodium hydroxide is, however, equally effective in removing lipids as either
chloroform or diethyl ether in human tissue. Considering that sodium hydroxide baths are not
efficient (second hypothesis), the above results added to the very small intra-specific variability in
C:N ratios indicate that the amount of lipid spread over their feathers by these birds when preening is
rather constant among individuals and small enough not affect δ13C readings. In this case, our results
support the conclusion made by Post et al. (2007) that it is not necessary to account for lipids in
aquatic animal samples when lipid content is below 5 % (C:N < 3.5).
More generally, it may be concluded that either treatment can be used in view of stable
carbon and nitrogen isotopic measurements in plumage. It is noteworthy that the use of 0.25 N
sodium hydroxide (irritant for the eyes and the skin in case of prolongated or repeated contact) is
much less hazardous to human health than the use of chloroform (noxious when inhaled, ingested or
inhaled, ingested or in contact with the skin and may cause death) (Acros Organics 2004-2005)
making its usage easier. Moreover, it would be of interest to compare other methods used to clean
feathers (Hobson et al. 1993; Thompson and Furness 1995; Cherel et al. 2000; Becker et al. 2002)
with the protocols tested here.
ACKOWLEDGMENTS
This research was supported by the Conseil Général de La Réunion and by a WIOMSA
(Western Indian Ocean Marine Science Association) MASMA (MArine Science for MAnagement)
grant. J.K. also benefited from support of the Conseil Régional de La Réunion and the European
Social Fund through a PhD grant. We would like to thank the SEOR (Société d'Etudes
Ornithologiques de La Réunion) for providing the birds.
LITERATURE CITED
Alexander, S. A., K. A. Hobson, C. L. Gratto-Trevor and A. W. Diamond. 1996. Conventional and
isotopic determinations of shorebird diets at an inland stopover: The importance of invertebrates and
Potamogeton pectinatus tubers. Canadian Journal of Zoology 74: 1057-1068.
Acros Organics. 2004-2005. Catalog of fine chemicals. Acros Organics, Noisy-Le-Grand, France.
Ambrose, S. H. 1993. Isotopic analysis in paleodiets: methodological and interpretive consideration.
pages 59-130 in Investigation of ancient human tissue (M. K. Sanford Eds.). Gordon and Breach,
Barré, N., A. Barau and C. Jouanin. 1996. Oiseaux de la Réunion, Les Editions du Pacifique, Paris,
France.
Bearhop, S., S. Waldreon, D. Thompson, and R. Furness. 2000. Bioamplification of mercury in
Great Skua and Catharacta Skua chicks: the influence of trophic status as determined by stable
isotope signatures of blood and feathers. Marine extraction and arithmetic lipid correction on stable
isotope ratio of fish muscles. Rapid Communications in Mass Spectrometry 20: 595–601.
Becker, P. H., J. González-Solís, B. Behrends, and J. Croxall. 2002. Feather mercury levels in
seabirds at South Georgia: influence of trophic position, sex and age. Marine Ecology Progress
Series 243: 261–269.
Bligh, E. G., and W. J. Dyer. 1959. A rapid method of total lipid extraction and purification.
Canadian Journal of Biochemistry and Physiology 37: 911–917.
Bodin, N., F. Le Loc'h, and C. Hily. 2007. Effect of lipid removal on carbon and nitrogen stable
isotope ratios in crustacean tissues. Journal of Experimental Marine Biology and Ecology 341:
168-175.
Bolton, M., P. Monaghan, and D. C. Houston. 1991. An improved technique for estimating pectoral
muscle protein condition from body measurements of live gulls. Ibis 133: 264–270.
Cherel, Y., K. A. Hobson, and S. Hassani. 2005a. Isotopic discrimination between food and blood
and feathers of captive penguins: Implications for dietary studies in the wild. Physiological and
Biochemical Zoology 78: 106-115.
Cherel, Y., K. A. Hobson, and H. Weimerskirch. 2005b. Using stable isotopes to study resource
acquisition and allocation in procellariiform seabirds. Oecologia 145: 533–540.
Dahl, T. M., S. Falk-Petersen, G. W. Gabrielsen, J. R. Sargent, H. Hop, and R. M. Millar. 2003.
Lipids and stable isotopes in common eider, Black-legged Kittiwake and Northern Fulmar: a trophic
study from an Arctic fjord’, Marine Ecology Progress Series 256: 257–269.
Debacker, V., T. Jauniaux, F. Coignoul, and J.-M. Bouquegneau. 2001. Heavy metal contamination
and body condition of wintering guillemots (Uria aalge) at the Belgian coast from 1993 to 1998.
Environmental Research 84: 310–317.
Dehna, L.-A., E. H. Follmanna, D. L. Thomasb, G. G. Sheffieldc, C. Rosaa, L. K. Duffya and T. M.
O'Haraa. 2006. Trophic relationships in an Arctic food web and implications for trace metal transfer.
Science of The Total Environment 362: 103-123.
DeNiro, M. J. and S. Epstein. 1977. Mechanism of carbon fractionation associated with lipid
synthesis. Science 197: 261–263.
DeNiro M. J., and S. Epstein. 1978. Influence of diet on the distribution of carbon isotopes in
animals. Geochimica et Cosmochimica Acta 42: 495-506.
Faraway, J. J. 2005. Linear Models with R, Chapman and Hall/CRC, Florida, U.S.A.
Forero, M. G., K. A. Hobson. 2003. Using stable isotopes of nitrogen and carbon to study seabird
ecology: applications in the Mediterranean seabird community. Scientia Marina 67: 23-32
Folch, J., M. Lees and G. H. Sloane Stanley. 2003. A simple method for the isolation and
Hobson, K. A., R. T. Alisauska, and R. G. Clark. 1993. Stable-nitrogen isotope enrichment in avian
tissues due to fasting and nutritional stress: implications for isotopic analyses of diet. The Condor 95:
388–394.
Hobson, K. A., A. Fisk, N. Karnovsky, M. Holst, J.-M. Gagnone, and M. Fortier. 2002. A stable
isotope (δ13C, δ15N) model for the North Water food web: implications for evaluating
trophodynamics and the flow of energy and contaminants. Deep-Sea Research Part II – Tropical
studies in oceanography 49: 5131–5150.
Kelly, J. F. 2000. Stable isotopes of carbon and nitrogen in the study of avian and mammalian
trophic ecology. Canadian Journal of Zoology 78: 1–27.
Kiljunen, M., J. Grey, T. Sinisalo, C. Harrod, H. Immonen and R. I. Jones. 2006. A revised model
for lipid-normalizing δ13C values from aquatic organisms, with implications for isotope mixing
models. Journal of Applied Ecology 43: 1213-1222.
McConnaughey, T. and C. P. McRoy. 1979. Food-Web structure and the fractionation of Carbon
isotopes in the bering sea. Marine Biology 53: 257-262.
Murdoch, D., E. D. Chow and J. M. Frias Celayeta. 2007. ellipse: Functions for drawing ellipses and
ellipse-like confidence regions. R package version 0.3-5.
Nisbet, I. C. T., J. P. Montoya, J. Burger, and J. J. Hatch. 2002. Use of stable isotopes to investigate
individual differences in diets and mercury exposures among common terns Sterna hirundo in
breeding and wintering grounds. Marine Ecology Progress Series 242: 267–274.
Post, D. M., C. A. Layman, D. A. Arrington, G. Takimoto, J. Quattrochi and C. G. Montana. 2007.
Getting to the fat of the matter: models, methods and assumptions for dealing with lipids in stable
isotope analyses. Oecologia 152: 179-189.
Quillfeldt, P., R. A. R. McGill, and R. W. Furness. 2005. Diet and foraging areas of Southern Ocean
seabirds and their prey inferred from stable isotopes: Review and case study of Wilson’s storm-petrel.
Marine Ecology Progress Series 295: 295-304.
R Development Core Team. 2005. R: A language and environment for statistical computing. R
Foundation for Statistical Computing, Vienna, Austria. http://www.R-project.org, accessed 15
November 2006.
Rubenstein D. R., and K. A. Hobson. 2004. From birds to butterflies: animal movement patterns and
stable isotopes. Trends in Ecology and Evolution 19: 256-263
Sagerup, K., E. O. Henriksen, J. U. Skaare, and G. W. Gabrielsen. 2002. Intraspecific variation in
trophic feeding levels and organochlorine concentrations in Glaucous Gulls (Larus hyperboreus)
from Bjørnøya, the Barents Sea. Ecotoxicology 11: 119–125.
Schreiber, E. A. and J. Burger. 2001. Biology of marine birds. CRC Press, USA.
Scrimgeour, C. M. and D. Robinson. 2003. Stable isotope analysis and applications. Pages 381-432
in Soil and Environmental Analysis: Modern Instrumental Techniques (K. A. Smith and M. S.
Cresser Eds.), Marcel Dekker Inc., New York, New York, USA.
Soxhlet, F. 1879. Die Gewichtsanalytische Bestimmung des Milchfettes. Polytechnisches Journal
Sweeting, C. J., N. V. C. Polunin, and S. Jennings. 2006. Effects of chemical lipid extraction and
arithmetic lipid correction on stable isotope ratio of fish muscles. Rapid Communications in Mass
Spectrometry 20: 595–601.
Thompson, D. R., S. Bearhop, J. R. Speakman, and R. W. Furness.1998. Feathers as a means of
monitoring mercury in seabirds: insights from stable isotope analysis. Environmental Pollution 101:
193–200.
Thompson, D. R. and R. W. Furness. 1995. Stable-isotope ratios of carbon and nitrogen in feathers
indicate seasonal dietary shifts in Northern Fulmars. The Auk 112: 493–498.
Thompson, D. R., K. Lilliendahl, J. Solmundsson, R. W. Furness, S. Waldron, R. A. Phillips. 1999.
Trophic Relationships among Six Species of Icelandic Seabirds as Determined through Stable
Isotope Analysis. The Condor 101: 898-903.
Vander Zanden M. J., and J. B. Rasmussen. 2001. Variation in 15N and 13C trophic fractionation:
Implications for aquatic food web studies. Limnology and Oceanography 46: 2061-2066.
Walsh, P. M. 1990. The use of seabirds as monitors of heavy metals in the marine environment.
Pages 183–205 in Heavy metals in the marine environment (R. Furness and P. Rainbow Eds.). CRC
Press, Boca Raton, Florida.
Wenzel, C. and D. Adelung. 1996. The suitability of oiled guillemots (Uria aalge) as monitoring
organisms for geographical comparisons of trace element contaminants. Archives of Environmental
TABLE 1: Stable isotope results for Barau's Petrels (Pterodroma baraui) and White-tailed
Tropicbirds (Phaethon lepturus), with juveniles (J) and adults (A) considered separately and
together. Number of samples (n), mean (± SD) δ13
C values, δ15N values (‰) and C:N ratios of bulk
and chemically lipid-extracted seabird muscle, liver and feathers are presented, together with the
differences between lipid-extracted and bulk aliquots (± SD) followed by their significance (NS, *,
**, *** indicate that the mean difference is not significant, significant at p < 0.05, p < 0.01 and p <
0.001 respectively).
TABLE 2: Lipid normalization models for predicting δ13Cext values from sample δ13Cbulk values
and C:N ratios. D and I (resp. a, b and c) are the parameters of Equation 1 and 2 (resp. 3 and 5)
estimated by different authors. “rmse” stands for “root mean square error” which was calculated for
each model applied to each tissue (M: muscle; L: liver). In the last two columns (M and L), different
Latin or Greek letters symbolize significant differences between the δ13Cext values predicted by the
T
A
BLE
1:
22
Bulk Lipid extracted
n C:N C:N Muscle 20 −18.12 ± 0.79 13.15 ± 0.59 4.26 ± 0.54 −17.92 ± 0.60 13.12 ± 0.59 3.87 ± 0.12 0.40 ± 0.57 ** 11 −17.83 ± 0.81 11.55 ± 0.95 4.41 ± 0.59 −17.35 ± 0.43 11.82 ± 0.83 3.96 ± 0.13 0.48 ± 0.51 * 0.27 ± 0.13 *** 13 −18.11 ± 0.91 11.70 ± 1.41 4.65 ± 0.71 −17.37 ± 0.57 11.75 ± 1.36 3.89 ± 0.17 0.74 ± 0.54 *** 0.14 ± 0.15 ** 24 −17.98 ± 0.86 11.63 ± 1.20 4.54 ± 0.66 −17.36 ± 0.50 11.78 ± 1.14 3.92 ± 0.16 0.62 ± 0.53 *** 0.20 ± 0.15 *** Liver 10 −18.85 ± 1.22 15.34 ± 1.38 4.46 ± 0.49 −18.28 ± 0.98 15.25 ± 1.20 4.00 ± 0.16 10 −20.51 ± 1.34 14.37 ± 0.82 5.81 ± 1.32 −19.20 ± 0.75 14.35 ± 0.75 4.20 ± 0.21 3.22 ± 6.20 *** 20 −19.64 ± 1.51 14.86 ± 1.21 5.13 ± 1.19 −18.60 ± 1.00 14.92 ± 1.14 4.08 ± 0.20 1.74 ± 4.55 * 10 −18.06 ± 0.51 13.97 ± 0.87 4.08 ± 0.63 −17.43 ± 0.51 14.28 ± 0.96 4.09 ± 0.32 0.43 ± 0.17 *** 10 −18.42 ± 0.58 14.44 ± 2.22 4.36 ± 0.26 −17.91 ± 0.80 14.17 ± 2.24 3.98 ± 0.14 0.44 ± 0.18 *** 20 −18.25 ± 0.56 14.20 ± 1.72 4.58 ± 0.52 −17.66 ± 0.70 14.23 ± 1.68 4.04 ± 0.25 0.43 ± 0.17 *** Feathers 5 −15.68 ± 1.29 13.37 ± 0.58 3.18 ± 0.02 −15.72 ± 1.05 13.30 ± 0.91 3.15 ± 0.02 5 −16.92 ± 0.41 14.00 ± 0.36 3.21 ± 0.03 −16.61 ± 0.43 13.74 ± 0.76 3.15 ± 0.01 10 −16.30 ± 1.11 13.68 ± 0.57 3.19 ± 0.03 −16.16 ± 0.89 13.52 ± 0.82 3.15 ± 0.01 δ13C δ15N δ13C δ15N δ13C
ext – δ13Cbulk δ15Next – δ15Nbulk
Pterodroma baraui A 0.01 ± 0.22 NS
Phaethon lepturus A Phaethon lepturus J Phaethon lepturus A+J
Pterodroma baraui A 0.39 ± 1.62 NS 0.08 ± 0.15 NS
Pterodroma baraui J −0.03 ± 0.27 NS
Pterodroma baraui A+J 0.03 ± 0.22 NS
Phaethon lepturus A 0.01 ± 0.12 NS
Phaethon lepturus J 0.05 ± 0.13 NS
Phaethon lepturus A+J 0.03 ± 0.12 NS
Pterodroma baraui A −0.04 ± 0.27 NS −0.07 ± 1.35 NS
Pterodroma baraui J 0.32 ± 0.04 NS −0.25 ± 0.63 NS
T
A
BLE
2:
23
Model type Estimated equation parameters p-value 95% CI n Biological material C:N range References M L
1 D = 6; I = -0.207 - - - M: 0.277 - Range of animals and plankton - a
L: 0.290 (muscle, whole organisms)
1 D = 7.018; I = 0.048 - - - M: 1.715 109 Fish dorsal muscle 2 – 63 b
L: 2.016
4 D = 5.590; I = -0.174 0.831 < 0.001 D: 4.816, 6.364 M: 0.236 44 Seabird muscle 3.7 – 6.0 Present study c
I I: -0.213, -0.135
4 D = 6; I = -0.180 - - - M: 0.233 44 Seabird muscle 3.7 – 6.0 Present study c
4 D = 4.846; I = -0.196 0.772 < 0.001 D: 3.994, 5.698 L: 0.274 40 Seabird liver 4.0 – 7.9 Present study I: -0.252, -0.134
4 D = 6; I = -0.220 - - - L: 0.286 40 Seabird liver 4.0 – 7.9 Present study
2 D = 6 - - - M: 0.793 - Shorebird muscle - d
L: 0.989
3 a = 0.322; b = -1.175 - - - M: 0.467 46 Crustacean muscle, gonads 4.0 – 16.2 e
L: 0.371
3 a = 0.99; b = -3.32 - - - M: 0.593 22 Aquatic animals 2.9 – 6.9 f
II L: 1.010 (muscle, whole organisms)
3 a = 0.828; b = -3.147 0.841 < 0.001 a: 0.718, 0.939 M: 0.232 44 Seabird muscle 3.7 – 6.0 Present study c b: -3.642, -2.651
3 a = 0.522; b = -1.926 0.810 < 0.001 a: 0.440, 0.603 L: 0.245 40 Seabird liver 4.0 – 7.9 Present study b: -2.331, -1.520
5 a = 0.781; b = -3.607; c= 0.963 0.883 < 0.001 a: 0.590, 0.972 M: 0.238 44 Seabird muscle 3.7 – 6.0 Present study c b: -5.196, -2,018
III c: 0.842, 1.084
Eqn r 2 rsme
McConnaughey and McRoy (1979) Kiljunen et al. (2006)
Alexander et al. (1996)
Bodin et al. (2007)
and hepathopancreas
Figure captions
FIGURE 1: Relationship between C:N ratios and ∆δ13C (‰) in seabird tissues (■: Pterodroma
baraui; ○: Phaethon lepturus).
FIGURE 2a: 95 % (inner ellipse) and 99 % (outer ellipse) confidence ellipses for models of Type I
estimated here from seabirds muscle and liver. The parameters of the models of equivalent type
fitted by other authors are plotted on these graphs (crosses).
FIGURE 2b: 95 % (inner ellipse) and 99 % (outer ellipse) confidence ellipses for models of Type II
estimated here from seabirds muscle and liver. The parameters of the models of equivalent type
fitted by other authors are plotted on these graphs (crosses).
FIGURE 3: Observed (chemically lipid-extracted) and predicted (from various lipid-normalization
methods) δ13C values (‰) from Reunion Island seabirds used for independent validation of the
FIGURE 1:
a) Muscle
b) Liver
C:N ratio
δ
13C
ex t–
δ
13C
b ul k(
‰
)
FIGURE 2a: Seabird muscle: Seabird liver: Kiljunen et al. (2006) McConnaughey and McRoy (1979) Kiljunen et al. (2006) McConnaughey and McRoy (1979)
-1.5 -1.0 -0.5 0.0 0.5 -1.5 -1.0 -0.5 0.0 0.5 7.5 7.0 6.5 6.0 5.5 5.0 4.5 4.0 7.0 6.0 5.0 4.0
FIGURE 2b: Seabird muscle: Seabird liver: Post et al. (2007) 1.0 0.8 0.6 0.4 0.2 Bodin et al. (2007) -4.0 -3.5 -3.0 -2.5 -2.0 -1.5 -1.0 -3.5 -3.0 -2.5 -2.0 -1.5 -1.0 1.0 0.8 0.6 0.4 0.2 Bodin et al. (2007) Post et al. (2007)
FIGURE 3: