UNCORRECTED
PROOF
Journal of Environmental Management xxx (2017) xxx-xxx
Contents lists available at ScienceDirect
Journal of Environmental Management
journal homepage: www.elsevier.comResearch article
Study of factors involved in the gravimetric separation process to treat soil
contaminated by municipal solid waste
Ikbel Mouedhen, Lucie Coudert, Jean-François Blais
∗, Guy Mercier
Institut National de la Recherche Scientifique (Centre Eau Terre Environnement), Université du Québec, 490 rue de la Couronne, Québec, QC G1K 9A9, Canada
A R T I C L E I N F O
Article history:
Received 18 May 2017
Received in revised form 29 November 2017 Accepted 8 December 2017 Available online xxx Keywords: Inorganic contaminants Soil remediation Gravimetric process Shaking table Dense media separation Box–Behnken design
A B S T R A C T
The current research investigated the effectiveness of a gravimetric process (shaking table) to treat soil con-taminated by municipal solid waste. A detailed characterization of the inorganic pollutants was performed, followed by concentrating the metals within smaller volumes using the shaking table technology. The densi-metric examination of the 1–2 mm and 0.250–1 mm fractions of the contaminated soil showed that lead (Pb), copper (Cu), and tin (Sn) were mostly concentrated in the heavy fraction (metal removals > 50%). Scanning electron microscopy coupled with elemental analysis indicated the relevance of using gravimetric processes to treat this soil sample. The influence of shaking table parameters was determined using a Box–Behnken design. The tilt and washing water flow demonstrated significant effects on the motion of the 1–2 mm soil fraction and on the removal of Pb, Cu, and Sn. The results obtained under the optimal settings of the shaking table defined using the Box–Behnken methodology when treating the 1–2 mm fraction were close to those obtained when using dense media separation. The recovered mass of the concentrate was approximately 20.8% (w.w−1) of the total mass. The removals of Pb, Cu, and Sn were estimated to be 67.3%, 54.5% and 54.6% respectively. The predicted and experimental mass distributions of the medium (1–2 mm) and fine-sized (0.250–1 mm) particles were compared successively under some selected conditions. The mass distribution of both frac-tions showed similar tendencies in response to the forces applied by each condition. However, lowering the forces induced by the bumping action and the flowing film was recommended so as to efficiently treat the fine fraction (0.250–1 mm). The recovered mass of the concentrate (10%) was slightly lower than that obtained by dense media separation (13%). However, satisfactory removal yields were obtained for Pb, Cu, and Sn (42.7%, 23.6%, and 35% respectively).
© 2017.
1. Introduction
Industrial expansion and population growth densities led to the es-tablishment of municipal solid waste management strategies (Collett et al., 1998). Waste combustion is commonly used to reduce the total volume of solid waste that should be disposed of by 80–90% (Prasad and Shih, 2016). The first such device was developed in England in 1870. Thereafter, incinerators began to appear in many industrialized countries to treat domestic, commercial, and industrial solid wastes (Chandler et al., 1997). Prior to the Second World War, the absence of serious environmental regulations promoted the discharge of toxic chemicals and ashes into the environment (Santoleri et al., 2000). Therefore, the inadequate management of waste has contributed to the contamination of urban soils (Hutton et al., 1988; Thornton, 2009). The contamination of soil by metals presents a potential risk for the exposed population and fauna (Olawoyin et al., 2012). The man-agement of contaminated sites has become of a major concern in
∗Corresponding author.
Email addresses: ikbel.mouedhen@ete.inrs.ca (I. Mouedhen); lucie.coudert@ete.
inrs.ca (L. Coudert); blaisjf@ete.inrs.ca (J-F Blais); guy.mercier@ete.inrs.ca (G. Mercier)
developed countries. Remediation technologies available to treat sites contaminated by inorganic compounds are classified into physical, chemical and biological techniques. Rehabilitation costs involved are usually the major challenge defining the practical application of such remediation technologies (Khalid et al., 2017). Solidification/Stabi-lization is the most relevant technology and the most commonly used method to manage soil contaminated by inorganic compounds (Iskandar, 2000). It aims to reduce the mobility of the hazardous ma-terials. In a second step, the contaminated soil is mixed with ordinary Portland cement to ensure a subsequent safe landfilling (Ucaroglu and Talinli, 2012). The costs related to the management range from $US190-248 m−3of treated soil (FRTR, 2016).
Solidification/stabi-lization technique requires the maintenance of the secured systems and is deemed to be an unsustainable treatment technology (Guemiza et al., 2017). Hence, alternative and environmentally friendly solu-tions are necessary to treat soil contaminated by metals. For instance, bioremediation is a simple and economical treatment solution which involves plants, microorganisms and organic amendments to detox-ify/remove the inorganic compounds from soils. The effectiveness of the biological techniques depends generally on the bioavailability of metals in the soil and concerns low to moderate polluted mediums (Khalid et al., 2017; Park et al., 2011). In the other hand, soil washing
https://doi.org/10.1016/j.jenvman.2017.12.020 0301-4797/© 2017.
UNCORRECTED
PROOF
uses physical and chemical approaches to extract effectively metalsfrom soil (Benschoten et al., 1997). Chemical agents such as chelat-ing agents, acids and salt chloride solution are used to transfer the metals from the soils into an aqueous solution (Guo et al., 2016; Yao et al., 2012). Mineral processing technologies, such as gravimetric separation, are frequently implemented to reduce the use of chemi-cals. Moreover, the volume of soil to be safely managed is consid-erably reduced, which decreases the operating costs of the decont-amination process (ranging from $US70-187 m−3of soil) (Dermont et al., 2008). Gravimetric processes are based on the motion of the soil particles in response to gravity and other forces, such as the re-sistance to the motion offered by the fluid. Specific gravity, weight, particle size, and shape are the key factors determining the effec-tiveness of the separation of contaminated particles from uncontam-inated soil (Burt, 1999). A significant difference in the density be-tween the soil particles and the particles bearing the inorganic cont-aminants is necessary to produce a satisfactory decontamination per-formance (Gosselin et al., 1999). Several works highlighted the suit-ability of gravimetric processes to efficiently decontaminate soils pol-luted by incinerator residues (Jobin et al., 2016a; Mercier et al., 2001). These studies reported high levels of Pb and Cu liberation degree ac-cording to a pollutant characterization of the municipal solid waste. According to these authors, iron oxides were widely or occasionally involved in the carrying phase of Sn, Cu, and Pb, indicating that gravi-metric processes would be a very promising treatment option (Jobin et al., 2016b; Mercier et al., 2001). Unit operations such as soil siz-ing and attrition scrubbsiz-ing are usually involved prior to gravimetric treatment. Indeed, the application of a shaking table to treat contami-nated soil is restricted to medium and coarse fractions (0.063–2 mm). Finer and coarser particles undergo further treatment such as chemi-cal extraction or other physichemi-cal treatments (flotation, jig, and magnetic separators, among others) (Dermont et al., 2008). Among the gravi-metric processes, the most common equipment available to isolate these contaminated particles from uncontaminated soil are jigs, spi-rals, heavy-medium techniques, and shaking tables (USEPA, 1995). If used correctly, shaking tables demonstrate high selectivity and sat-isfactory metal recovery efficiencies, allowing the treatment of con-taminated soil and mining ore. Particles introduced to the table are displaced by the forces of the washing water and the longitudinal stroke of the deck. Depending on the density of the particles, the stratification mechanism near the riffles of the deck is also involved in the concentration process. Hence, operational and design variables (characteristics of the deck) affect the treatment performance. Fre-quent operator attention and adjustment of the shaking table parame-ters are therefore needed to optimize the separation performance of contaminated particles from the uncontaminated fraction (Falconer, 2003). The principal operational parameters are the throughput of the solid, length and frequency of strokes, tilt of the deck, and water flow (Fitzpatrick et al., 2016). The shaking table has been used to treat a large range of soils, including those polluted by weapon ammuni-tion, mining residues, slags or foundry residues, and municipal solid waste. The chemical and mineralogical heterogeneities of soils in-duce large variability in the observed performance. For instance, in the case of soils moderately contaminated by mining residues, the re-moval of Zn, Pb, and Cu ranged from 19% to 26%. The required adjustments to enhance the decontamination of these soils were de-fined as follows: 20° tilt, feed water flow of 3.5 L min−1, washing wa-ter flow of 8 L min−1, and feed pulp composition of 20% total solids
(w·w−1) (Veetil et al., 2014). For a soil highly contaminated by Pb, Zn, Cu, and Sb found in military shooting grounds, the removals ranged from 60% to 96% under a feed water flow of 3.5 L min−1, a washing water flow of 8 L min−1, and a pulp comprising 70% total
solids (w·w−1) (Laporte-Saumure et al., 2010). The research of Bisone et al. (2013) focused on the treatment of the 0.125–1 mm fraction of a soil contaminated by slags and foundry residues. These samples con-tained high levels of Cu and Zn. The tilt was adjusted to the max-imum level. The principal and secondary water flows were fixed at 6 L min−1, and 3.5 L min−1, successively. The stroke frequency was
adjusted to 360 Strokes min−1. The shaking table treatment allowed the removal of 44–68% of Cu. The removal of Zn varied from 30 to 44%. In the case of a soil highly contaminated by municipal solid waste, the removals of Pb, Zn, Cu, Sn, and As ranged from 49% to 80% under an 11° tilt, a stroke frequency of 500 strokes·min−1, a feed water flow of 5 L min−1, a washing water flow of 5 L min−1, and a solid throughput of 100 g min−1(Jobin et al., 2015). Another study, which investigated the decontamination of soil polluted by municipal solid waste, reported that the removal yields of Pb, Zn, Cu, and Sn varied from 0 to 61.2%. The soil was dry fed and the optimal settings comprised a slope ratio ranging from 1:55–1:96, a stroke frequency of 500 strokes·min−1, and a pulp composition of 10% total solids (w·w−1)
(Mercier, 2000; Mercier et al., 2001). Consequently, optimal settings vary according to the nature and/or the level of contamination. Mod-eling the mechanism of the shaking table can help to improve our un-derstanding of the concentration process occurring during the treat-ment. Previous work investigated the possibility of modeling the per-formance of the shaking table to recover cassiterite from ore using the Box–Behnken response surface methodology. The statistical de-sign was helpful for finding the optimal parameters of Sn recovery (Youssef et al., 2009).
Hence, a Box–Behnken design was used in the present study to evaluate the influence of operational parameters on the performance of the shaking table, which removed metals from soil contaminated by municipal solid waste. Moreover, the specific characteristics of the contamination and the operational settings involved in the separation process were investigated.
2. Material and methods
2.1. Feedstock treatment
Experiments were carried out with soil samples contaminated by municipal solid waste. More specifically, soil samples were collected from inorganic contaminated land, located in the site of Pointe au Lièvre in Quebec City (Canada). According to the history of the site, the contamination is old and mainly caused by the successive operation of two incinerators from 1939 until 1970. Samples were wet-sieved to produce several fractions, using a vibrating screen (Sweco™) and different sieves. Fractions ranging from 1 to 2 mm and 0.250–1 mm were generated. Then, these soil fractions were put through a scrubbing attrition step performed at 1500 rpm for a dura-tion of 10 min with a solid-liquid ratio fixed at 30% (w·w−1). Attrition disintegrates agglomerates and liberates particles from slim coatings, enhancing the performance of a gravimetric process train (Marino et al., 1997).
2.2. Dense media separation
Tetrabromoethane (TBE – C2H2Br4) was used to characterize the
density distribution of each soil fraction used in this study. The liquid density was adjusted to 1.5 g cm−3using ethanol (EtOH C
2H6O).
Dense media separation was performed on 100 g of each soil sample collected from the entire soil fraction using Riffle-type Sample Split-ters. Experiments were performed in triplicate. For the 1–2 mm soil fraction, the densities of the different products obtained were lower
UNCORRECTED
PROOF
than 1.5 g cm−3, between 1.5 and 2.9 g cm−3, and higher than2.9 g cm−3 (pure TBE). The lightest fraction (<1.5 g cm−3)
corre-sponds to the organic matter whereas the heaviest fraction (>2.9 g cm−3) corresponds to the concentrate. For the 0.250–1 mm soil fraction, the densities of the different products obtained were lower than 2.9 g cm−3and higher than 2.9 g cm−3.
2.3. Gravimetric separation 2.3.1. Experimental method
A Laboratory Wilfley Table (Outokumpu Technology, model 13A-SA) with a rectangular shape (1.02 m length and 0.46 m width) was used to treat contaminated soil fractions (Fig. 1). For each exper-iment, the solid flow was adjusted. The dry feedstock was introduced using a vibratory feeder. Three exits were selected (Fig. 1):
• exit E1, which collected the light output mass;
• exits E4, E5, E6, and E7, which received the concentrate (metal en-riched product); and
• exits E2 and E3, which received the treated soil.
All generated shaking table exits were weighed. Their densities were determined using a Pycnometer (AccuPyc 1330, Micromeritics).
2.3.2. Preliminary assays
The influence of six variables (tilt, feed water flow, washing wa-ter flow, stroke frequency, stroke length, and solid throughput) affect-ing the gravimetric separation process was studied on the 1–2 mm soil fraction. All the experiments were performed in triplicate. Prelimi-nary tests conducted with a control soil showed that physical separa-tion was not affected by solid throughput. The independence of stroke length and stroke frequency was verified to determine whether their influence can be studied using a response surface methodology. How-ever, feed water flow and washing water flow are dependent factors.
2.3.3. Box–Behnken design
A response surface methodology (Box–Behnken design) was used to evaluate the effect of some variables and their interactions on the
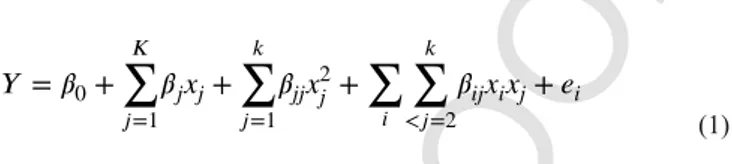
performance of the shaking table with regard to contaminated parti-cle separation from uncontaminated soil. The Box–Behnken design is a statistical method that can be used to optimize operating pa-rameters using the minimum number of experiments. According to the Box–Behnken design, the response can be estimated using sec-ond-order prediction models (Equation (1)) (Govarthanan et al., 2014; Mocellin et al., 2015).
where Y is the response; βj, βjj, and βij are the coefficients of the main effects, the quadratic effects, and the interaction between the main ef-fects; and eiis the random error.
For this series of experiments, the solid flow was set at 100 g min−1 and the feed water flow was fixed at 2 L min−1. Four relevant factors (tilt, washing water flow, stroke length, and stroke frequency) were considered in this study. Their effects on the mass and density of the concentrate, as well as metal removal yields, were studied. The real and coded levels of each variable are presented in Table 1. The values of coded variables vary over the same range (from −1 to +1), allowing the comparison of the effects of each variable. They were calculated using Equation (2).
where xiis the coded value, xois the value of the variable at the center
point, and Δx is the step change.
A total of 29 tests were conducted using Equation (3) (Ferreira et al., 2007).
where k and C0 correspond to the number of numeric factors and
Fig. 1. Schematic illustration of the shaking table.
(1)
(2)
UNCORRECTED
PROOF
Table 1
Range of selected factors.
Parameters Unit Range
−1 0 1
Tilt ° 8 11 14
Washing water flow L.min−1 4 6 8
Stroke length mm 11.0 12.5 14.0
Stroke frequency rpm 300 400 500
the center point respectively (k = 4 and C0= 5 in the present study),
and n is the number of categorical factors.
Following the experiments and the statistical analysis, a validation test under the optimal predicted conditions was performed in tripli-cate.
Secondly, the effect of the shaking table parameters on the motion of medium-sized particles (1–2 mm) was exploited to treat the finer fraction (0.250–1 mm) of the contaminated soil.
2.4. Analytical methods
The concentrations of Al, Fe, Cu, Pb, Sn and Zn were followed during all assays of attrition, dense media separation and shaking table separation. Regarding the limits values for various contaminants fixed by the Land Protection and Rehabilitation Regulation in the Province of Quebec (Canada), Cu, Pb, Sn and Zn were considered as the most problematic inorganic compounds. Each soil sample was finely ground and digested using the aqua regia method (MA. 100 – Lix.com.1.1) (CEAEQ, 2010). Certified soil samples (SC0063618, LKSD-2 and LKSD-4) were used to ensure the quality of the digestion method. Metal concentrations in liquid samples obtained from the di-gestion method were determined using ICP-AES. Certified solutions (multi-element standard 900-Q30-002, SCP Science) were used to en-sure the conformity of the meaen-sures.
2.5. Calculations
Dense media ensures a high efficiency of separation. It offers an ideal separation of contaminants from uncontaminated particles (Wills, 2011). Accordingly, practical comparison between the per-formance of dense media separation and the treatment of contami-nated soil fractions using the shaking table was considered. Hence, the mass removal efficiency and metal removal efficiency ratios (RE and RM(M)) were calculated during the treatment of the 1–2 mm soil
frac-tion according to Equafrac-tions (4) and (5).
Theoretically, the RE ratio may vary from 0 to values higher than 1. When RE is lower than 1, this reflects that the mass separated and collected in exists E4, E5, E6 and E7 of the shaking table is lower than the mass separated by the dense media. These results indicate that a proportion of the contamination is concentrated in the exits E2 and E3 instead of the desired outputs (E4, E5, E6 and 7). Therefore, the forces involved in the separation process promote the motion of a proportion of the contaminated particles until the middling of the deck instead of the concentrate zone. In this case, the separation by shaking table is less efficient than that of dense media. When RE values are higher than 1, this indicates that the mass removed by shaking table is higher than that removed by dense media. The forces on the deck promote the motion of both heavy and uncontaminated particles to the concentrate zone (E4, E5, E6 and E7). When the RE ratio is equal to 1, ideal set-tings of the gravimetric device are reached, regarding only the mass removal parameter. The performance of the shaking table is similar to that of dense media separation.
When RE varies from 0 to 1, the values of RM(M) may vary also
from 0 to 1. The threshold 1 reflects a maximum removal of the metal ‘M’ with the shaking table technology.
For the experiments performed on the 0.250–1 mm soil fraction, the total removed mass of the concentrate as well as the metal re-moval, were calculated according Equations (6) and (7).
3. Results and discussion
3.1. Characterization of soil fractions treated by attrition scrubbing
The chemical analysis of the total content of inorganic compounds in the bulk soil revealed high concentrations of Cu (705 mg kg−1), Pb (1494 mg kg−1), Sn (484 mg kg−1) and Zn (1339 mg kg−1). As well,
high levels of Fe (75,729 mg kg−1) and Al (8470 mg kg−1) were de (4)
(5)
(6)
UNCORRECTED
PROOF
termined. These latter largely contributed to the composition of thecarrying phases with which the heavy metal can be associated. The fine fraction (<0.250 mm) represented 19.8% (w.w−1) of the total soil. The 0.250–2 mm and the fraction > 2 mm represented 23.1% and 57% (w.w−1) of the total soil, respectively. All the fractions were highly contaminated by Pb, Cu, Sn and Zn. Therefore, each soil frac-tion required a specific treatment in order to ensure a safe use of the soil. Since the shaking table concerns to treat particles sized from 0.100 mm to 3 mm (Wills, 2011), the current study focused on the 0.250–1 mm and 1–2 mm fractions of the soil. The shape of bottom and fly ash particles emerging from municipal solid waste incineration is usually irregular (Chang et al., 1999). Hence, attrition scrubbing is often necessary to enhance their sphericity and promote their separa-tion from the uncontaminated soil, thereby removing some porsepara-tion of the contaminants (Jobin et al., 2015). As mentioned previously, wet screening and attrition scrubbing were necessary to prepare the soil fractions for the gravimetric treatment and to allow for better treat-ment performance. Attrition scrubbing is a physical process that al-lows for the disaggregation of aggregates and the liberation of the thin film on the surface of particles (Marino et al., 1997; Stražišar and Sešelj, 1999). According to the study carried out by Jobin et al. (2015), approximately 10% of highly contaminated sludge was produced dur-ing the preconditiondur-ing step of the 1–2 mm and 0.250–1 mm soil frac-tions respectively. In the present study, the 1–2 mm soil fraction ini-tially contained 727 mg kg−1of Cu, 1640 mg kg−1of Pb, 596 mg kg−1 of Sn, and 1290 mg kg−1 of Zn. The concentrations of Cu, Pb, Sn,
and Zn in the 0.250–1 mm fraction were 463 mg kg−1, 1663 mg kg−1, 628 mg kg−1, and 1200 mg kg−1respectively. The large presence of Cu, Pb, Sn, and Zn in the soil is a result of combustion of batteries, printed circuit boards, drink and food containers, pigments in paint, plastics, glass, and pesticides (Chandler et al., 1997; Harrison and Hester, 1994; Wei et al., 2011). Following to the attrition scrubbing treatment, the measured concentrations of metals in the 1–2 mm frac-tion were 658 mg kg−1 of Cu, 1925 mg kg−1of Pb, 551 mg kg−1 of
Sn, and 1020 mg kg−1of Zn. The concentrations of inorganic cont-aminants in the 0.250–1 mm soil fraction were slightly lower, with 343 mg kg−1 of Cu, 1040 mg kg−1 of Pb, 609 mg kg−1 of Sn, and 955 mg kg−1of Zn. According to the mass balance of the 1–2 mm
fraction, low to moderate removals of metals were obtained. They var-ied from 3.47 to 35.0% depending on the contaminant. The concen-trations of Cu, Pb and Sn were maintained closed to those determined before the treatment (error threshold of 5%). Consequently, the attri-tion scrubbing had no significant effect on the removal of these conta-minants. Only the concentration of Zn significantly decreased follow-ing this treatment. The generated sludge represented 17.8% of the total mass of the 1–2 mm soil fraction. In the other hand, the attrition scrub-bing treatment allowed the removal of 16.3% (w.w−1) of the total mass of the 0.250–1 mm fraction. The heavy metals removal varied from 18.8 to 47.6%. A significant decrease of Cu, Pb and Zn were achieved. However, the attrition scrubbing had no significant effect on the con-centration of Sn (error threshold of 5%). The concon-centrations were still higher than the mean natural background of Cu (38.9 mg kg−1), Pb (17 mg kg−1), Sn (2.5 mg kg−1), and Zn (70 mg kg−1) determined for uncontaminated soils around the world (European countries, United States, Japan and Brazil) (Alloway, 2013; Burt et al., 2003; Erikssonv, 2001; FOREG, 2005; Kabata-Pendias, 2004, 2011; Kabata-Pendias and Dudka, 1991; Lado et al., 2008; Shacklette and Boerngen, 1984; Takeda et al., 2004).
Table 2 presents the elemental composition of pollutants accord-ing to the microscopic analysis performed on numerous particles of
the concentrates obtained by dense media separation. The examined particles exhibited numerous phases with large mineralogical hetero-geneity. For example, particles containing Pb were identified as ox-ides of Pb, M-Pb oxox-ides, Pb carbonates, and Pb silicates. This con-taminant was highly liberated and associated to one or more carry-ing phases like Fe oxides, Ba sulfates, and Ca carbonates/oxides. Ac-cording to these results, Sn was identified as Sn oxides, M-Sn oxides, and alloys of Sn and other metals. Cu was also found to exist as ox-ides, M-Cu oxox-ides, and as a native element alloyed with other met-als. All the Pb, Sn, and Cu were totally liberated or carried by one or a mix of phases. The microscopic analysis revealed the presence of Zn in heavy particles, in the form of M-Zn oxides and Zn silicates. Zn was generally associated with other phases such as Ti-Ba oxides or a combination of Fe and Ca carbonates. This wide mineralogical variation is primarily explained by the source of contamination. In-deed, municipal solid waste comprises the waste of households, pub-lic areas, shops, and markets, and can sometimes contain industrial non-hazardous waste too (Weidemann, 2014). The elemental compo-sition of particles is also affected by the fate of metals during the incin-eration process and inside the soil after municipal solid waste inciner-ator residues are disposed of to the landfill. The following factors are able to affect the mineralogical properties: characteristics of the incin-eration system, redox atmosphere, temperature, pH, and presence of alkalis and mineral substances. Volatilization and condensation phe-nomena are involved during the incineration process. Adsorption, pre-cipitation, organometallic reaction, and incrustation in the crystalline lattices of minerals can occur when the ashes are in contact with the soil (Dong et al., 2015; Horowitz, 1991; Iskandar, 2000).
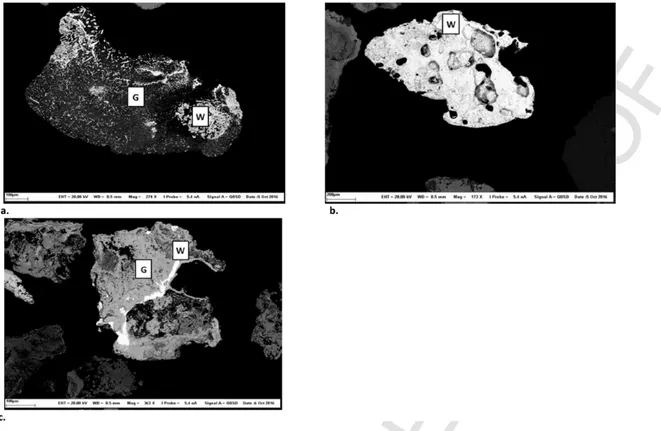
The nature of the carrying phase with which metals are embed-ded or adsorbed controls the fate of contaminants during the gravi-metric treatment (Dermont et al., 2008). Therefore, Table 2 classifies the examined particles into three classes (totally liberated phase, as-sociated to heavy phase, and asas-sociated to light phase). Fig. 2 pre-sents an example of each defined class. Firstly, totally liberated par-ticles have high densities and can be easily removed using gravimet-ric processes (Fig. 2-a). In the present study, some percent of the Cu, Pb, and Sn were totally liberated. The second class concerned parti-cles that were associated with the heavy phase, such as iron oxides (Fig. 2-b). In the present study, this mainly involved Pb, Sn, and Cu. High concentrations of Fe were noted, varying from 64,270 mg kg−1 to 103,100 mg kg−1 for the 0.250–1 mm and 1–2 mm soil fractions respectively. As for the first class, the particles associated with the heavy phase can be easily removed by gravimetric treatments. The third class concerned particles that were associated with a light phase or a mix of light and heavy phases (Fig. 2-c). The density of this class can be affected by the volume of the light phase, which can reduce the effectiveness of the gravimetric processes. . Prior studies classified the numerous carrying phases into the melt glass phase, silicate min-eral phase (especially melilite: [CaNa]2[AlMgFe2+][AlSi]SiO7], and
pseudowollastonite: CaSiO3), and calcium-rich mineral phases (Lime:
CaO, Portlandite: Ca(OH)2, and Calcite: CaCO3). They are
charac-terized by low densities, which vary from 2.3 g·cm−3-2.9 g cm−3. The presence of heavy phases, such as metal alloys and magnetic spinels (e.g., magnetite), was also reported (Chandler et al., 1997; Wei et al., 2011).
3.2. Contaminant removal performance of dense media separation from treated soil fractions by attrition scrubbing
The mass proportions and concentrations of the different inorganic contaminants present at each dense media separation exit are pre-sented in Table 3. According to these results, 17.5% and 13.1% of
UNCORRECTED
PROOF
Table 2
Mineralogical characterization of selected particles of contaminated soils by municipal solid waste.
Number of the particle examined Phase containing the contaminant Carrying phase of the contaminant
1 PbaOb 2 PbaCbOc – 3 SnaPbbOc – 4 PbaAlbOcCd – 5 PbaFebSicOd – 6 CuaPbbSncOd – 7 1: PbaOb 2: PbaCabOc – 8 1: PbaOb 2: SnaPbbOc – 9 1: PbaBabScOd 2: PbaBabFecOd – 10 1: PbaOb 2: PbaBabFecOd 3: PbaBrbFecOd – 11 1: PbaCbOc 2: PbaSnbOcCd 3: SnaCbOc – 12 1: PbaSnbOcCd 2: SnaOb 3: PbaSnbCcOd – 13 1: SnaOb 2: SnaFebOc – 14 1: CuaOb 2: CuaFebOc – 15 PbaFebOc FeaOb 16 PbaCbOc BaBabScCdOe 17 SnaOb FeaCbOc 18 Sn-Fe FeaOb 19 TiaZnbOc 1: BaaCrbOc 2: BaaTibOc 20 1: SnaFebOc 2: Sn-Cu-Fe FeaOb 21 1: Sn-Fe 2: SnaFebOc FeaOb 22 1: SnaBrbFecOd 2: SnaFebOc FeaOb 23 1: SnaCubNicFedOe 2: SnaFebOc FeaOb 24 1: Sn-Fe 2: SnFeOC FeaCbOc 25 1: SnaFebOc 2: Sn-Fe FeaOb 26 1: SnaOb 2: SnaFebOc FeaCbOc 27 1: PbaOb 2: PbaCabSicOd 3: CaaPbbFecOd BaaSbOc 28 PbaSibOc 1: AlaSibOc 2: FeaCabSicOd 3: MgaAlbSicOd 29 PbaSbbCcOd 1: BraSibOc 2: KaNabAlcSidOe 30 SnaFebOc 1: FeaOb 2: CaaPbOc 3: CaaOb 4: CaaFebOc 31 SnaFebOc 1: FeaOb 2: FeaAlbSicOd 32 ZnaFebCcOd 1: FeaCbOc 2: CaaCbOc 33 1: ZnaFebOc 2: SnaFebOc 1: FeaOb 2: NaaAlbSicOd 34 1: SnaOb 2: SnaCabOc 3: SnaFebOc 1: CaaOb 2: FeaOb 35 1: CuaOb 2: ZnaSibCacOd 1: CaaPbOc 2: KaSibOc 36 1: PbaCbOc 2: PbaSbbSncOdCe KaNabAlcSidOe 37 1: PbaCbOc 2: PbaFebOcCd 1: CaaAlbSicOd 2: NaaAlbSicOd 38 1: SnaFebCcOd 2: SnaFebOc 1: FeaOb 2: CaaCbOc
1, 2, 3 and 4: Number of mineralogical phases.
metallic concentrates were removed from the 1–2 mm and the 0.250–1 mm attrition scrubbed soil fractions respectively.
For the 1–2 mm soil fraction, it can be observed that Pb, Cu, and Sn were highly concentrated in the heaviest fraction. The final concentration measured in the concentrate was 3510 ± 750 mg kg−1 for Cu, 8290 ± 1070 mg kg−1for Pb and 2360 ± 510 mg kg−1for Sn,.
High metal removals were realized when using dense media separa-tion, varying from 75% to 89%, depending on the contaminant. How-ever, the efficiency in isolating Zn from uncontaminated particles was slightly limited. The analysis of the light fraction (between 1.5 and 2.9 g cm−3) generated by dense media separation method showed that the concentration of Zn remained relatively high (702 ± 54 mg kg−1). Dense media separation allowed the removal of 43.1% of Zn from the 1–2 mm fraction of the soil. The removal percent was consid-ered low compared to that obtained for Cu, Pb and Sn (>75.1%). The same behavior was observed in another study performed on soil con-taminated by municipal solid waste incinerator residues (Jobin et al., 2016b). As discussed in section 3-1, contaminated particles have a very heterogeneous mineralogy. The mineralogy of both heavy metal and carrying phase with which the metal is embedded or adsorbed controls the fate of the contaminated particle during the gravimet-ric separation process (Dermont et al., 2008; Mercier et al., 2001). Likewise, the surface percentage of each mineralogical phase pre-sent in the particle defines the mean density of this latter and con-sequently its response to the force of gravity (Mercier et al., 2001). The loss of efficiency in separating Zn by using dense me
dia separation reflects the fact that a large proportion of Zn-parti-cles is distributed in a range of a mean density inferior to 2.9 g cm−3.
This can be explained by the fact than Zn is for instance in sili-cate (Zn2SiO4) or Zn-aluminate (ZnAl2O4) forms, as reported in
an-other study (Abanades et al., 2002) and adsorbed to a light matrix (for example silicate glass matrix with a mean density of 2.64 g cm−3)
(Wei et al., 2011). If the matrix occupies a large area of the par-ticle, the mean density of the contaminated particle will be conse-quently reduced. This negatively affects the response of Zn to the gravimetric separation. It must be noted that the presence of such ma-trix (NaaAlbSicOd, KaSibOc) was found among heavy particles
(den-sity > 2.9 g cm−3) (Table 2). However, these particles were separated by the dense media method since this mineralogical phase was associ-ated to other heavy phases (for example, FeaObor SnaFebOc).
For the 0.250–1 mm soil fraction, dense media separation allowed for high concentrations of Pb, Cu, and Sn in the heaviest fraction. Metal removal yields varied from 47.5% to 94.7%, depending on the contaminant considered. Zn was less concentrated in the light frac-tion. However, as observed for the 1–2 mm fraction, the Zn con-centration remained relatively high (593 ± 51 mg kg−1). The metal was moderately removed (46.3%) from the 0.250–1 mm fraction. The good efficiency of dense media separation in removing Pb, Cu and Sn was reported in previous studies. Pb, Cu, and Sn removals were higher than 80% (Mercier et al., 2001). Indeed, the dense media sep-aration method is known for its sepsep-aration accuracy since only the forces of gravity and buoyancy affect the sedimentation of each soil
UNCORRECTED
PROOF
Fig. 2. Examples of the mineralogical classes of particles and their approximate compositions. 3-a: Totally liberated contaminant, W: Oxide of Pb; 3-b: Contaminant associated with
a heavy mineralogical phase, W: Alloy of Fe and Sn and Fe-Sn oxide, G: Oxide of Fe; 3-c: Contaminant associated with a light mineralogical phase; W: Oxide of Sn, and G: Oxide of Ca.
Table 3
Densimetric analysis of the feedstock by using tetrabromoethane. Parameter Mass (%) Metallic contaminants (mg.kg−1)
Cu Pb Sn Zn Fraction 1–2 mm Initial 100 <1.50 g cm−3 0.65 ± 0.5 721 ± 113 886 ± 151 91.5 ± 12.2 1205 ± 240 Between 1.50 and 2.89 g cm−3 82.5 ± 0.3 198 ± 15 453 ± 40 76.5 ± 15.6 702 ± 54 >2.89 g cm−3 16.0 ± 1.5 3510 ± 750 8290 ± 1070 2360 ± 510 3630 ± 580 Massic removal (%) 17.5 75.1 80.6 88.6 43.1 Fraction 0.250–1 mm Initial 100 <2.89 g cm−3 86.9 ± 1.9 208 ± 18 509 ± 25 37.2 ± 10.4 593 ± 51 >2.89 g cm−3 14.9 ± 1.4 1180 ± 185 7290 ± 100 1930 ± 780 2300 ± 150 Massic removal (%) 13.1 47.5 57.8 94.7 46.3
particle (Drzymała and Swatek, 2007). To conclude, the presence of the two first classes (totally liberated particles and contaminants as-sociated with the heavy phase) and the high-to-medium release avail-ability of the contamination according to the light carrying phase, cou-pled with the dense media separation results, supported the selection of gravimetric technology to treat soil fractions contaminated by Pb, Cu, and Sn. However, the gravimetric treatment of Zn was not con-ducted in the remaining part of the study. A special concern must be allocated to Zn according to further deep investigations in order to se-lect the appropriate strategy of separation.
3.3. Gravimetric treatment of the 1–2 mm fraction 3.3.1. Preliminary assays
As mentioned in Section 2.3.2, preliminary assays were conducted using a control soil in order to select the main variables affecting the gravimetric treatment with the shaking table device. Fig. 3-a shows the effect of the solid throughput on the mass collected at several exits of the table. The corresponding densities of each collected mass appear in Fig. 3-b. Varying the throughput of the solid from 50 to 300 g m−3
increased the solid-liquid ratio from 0.6% to 4.0%. Increasing the pro-portion of the solid is known to hinder the settling effect, and conse-quently, the density classification (Wills, 2011). However, as the col-lected masses and densities were similar for the different assays, no significant effect was observed when the throughput of the solid was varied. The solid throughput was consequently fixed while studying the effects of the shaking table variables.
On the other hand, Fig. 3-c shows the relationship between the stroke frequency and stroke length. For the tests conducted at the max-imum and minmax-imum stroke frequencies (500 strokes·min−1and 250 strokes·min−1respectively), the variables remained constant when the stroke length varied from 11 mm to 14 mm. Therefore, the stroke fre-quency and stroke length are independent parameters, and their ef-fects on the motion of the particles in the deck can be studied using a Box–Behnken methodology.
3.3.2. Box–Behnken statistical analysis (ANOVA)
The fitness of the mathematical models developed was assessed us-ing the analysis of variance (ANOVA). Graphical examinations of the plot of the normal probability of residuals, the plot of residuals ver-sus the experimental run order and the plot of residuals verver-sus pre
UNCORRECTED
PROOF
Fig. 3. Results of primary tests conducted under the following conditions. Tilt: 14°, feed water flow: 2 L·min−1, washing water flow: 6 L min−1, stroke frequency: 500 strokes·min−1, and stroke length: 11 mm. 2-a: Effect of the solid throughput on the obtained mass of particles at E1, E(2,3), and E(4,5,6,7), 2-b: Effect of the solid throughput on the density of particles at E1, E(2:3), and E(4,5,6,7). 2-c: Relationship between stroke length and stroke frequency.
dicted verified the assumptions of normal distribution of residues and their independency with a constant variance. The ANOVA provided information about the contribution of the tilt (A), the washing wa-ter flow (B), the stroke length (C) and the stroke frequency (D) or of their factorial interaction to the variation in each response (RE, density of the concentrate, RM(Pb), RM(Cu) and RM(Sn)). The
sig-nificance of this contribution was tested according the F-test within a 95% confidence interval. The different results of ANOVA are de-tailed in Supplementary Table 1. The sum of square, the degree of
freedom, the mean square, the F-value and the p-value were calcu-lated for each model and for each factor of the statistical model. Table 4 highlights the main results obtained. The developed mod-els and the factors of the shaking table are significant if the value of “Prob > F″ is lower than 0.05. The fit summary of the output in-dicated that all the established models were statistically significant (p-values < 0.0001). The adequacy of models was also checked by the analysis of the regression coefficients (R2) and the adequate preci-sion. The adjusted R2indicates the amount of the variation explained
UNCORRECTED
PROOF
Table 4
Main results of the ANOVA performed on the mathematical models. Sources REa Density of the concentrate RMb(Pb) RM(Cu) RM(Sn) p-value <0.0001 <0.0001 <0.0001 <0.0001 <0.0001 R2 Adjusted R2 0.96 0.84 0.86 0.84 0.88 Predicted R2 0.89 0.78 0.79 0.72 0.75 CV 21.3 10.7 10.5 19.5 19.7 Adequate precision 23.4 13.3 16.4 15.2 16.1 aR E= Removal efficiency. bR
M= Metal Removal efficiency.
by the models after the adjustment of their terms. The predicted R2
indicates how well models predict new observations (Jordão et al., 2016). The adequate precision is a signal to noise ratio. It compares the range of the predicted values to the average prediction error (Mocellin et al., 2015). Consequently, a high adjusted R2, a low difference
be-tween adjusted and predicted R2and an adequate precision higher than
4 are favored (Tanong et al., 2016). The adjusted R2and the predicted R2were superior than 0.84, indicating that less than 16% of the 29 ex-perimental values could not be explained using the mathematical mod-els. The coefficient of variance ranged from 10.7% to 21.6%, which pointed to the models reliability being either high or acceptable. The adequate precision of each proposed model was desirable (the sig-nal to noise ratio was higher than 4). In addition, the lack of fit was not significant, indicating that the mathematical models established a good fit with the experimental values. Supplementary Fig. 1 illustrates the relationship between the predicted and experimental values. The diagnostic of the predicted versus experimental values supports that models were suitable for predicting RE, the density of the concentrate, RM(Pb), RM(Cu) and RM(Sn) in the experimental field studied.
As observed in Supplementary Table 1, the calculation of p-values demonstrates that factors A, B, BD, A2and B2had a significant
influ-ence on the response RE. The factors A, B, AB, and CD had a signif-icant influence on the density of the concentrate. The factors A, B, C, BD, A2and B2had a significant effect on RM(Pb). The factors A, B,
C, and A2were statically significant for R
M(Cu). Finally, A, B, CD,
A2and B2had a significant influence on R M(Sn).
Equations (8-a) to (8-e) show, for each response, the mathemati-cal model expressed in terms of coded factors. The comparison of the coefficients of each factor highlighted that tilt (A) and washing water flow (B) had the highest impact on RE, the density of the concentrate, RM(Pb), RM(Cu), and RM(Sn). The signs of these coefficients revealed
whether each factor increases (positive sign) or decreases (negative sign) the studied response (Jin et al., 2014). According to Equations (8-a) to (8-e), both tilt (A) and washing water flow (B) had a positive influence on the density of the concentrate and a negative influence on RE. This indicated that increasing tilt and/or washing water flow will lead to a decrease in RE and an increase in the density of the concen-trate.
(8-a)
(8-b)
UNCORRECTED
PROOF
3.3.3. Effect of shaking table factors on the treatment of the 1–2 mmsoil fraction
Contour plots, presented in Fig. 4, were constructed to demon-strate the effect of tilt (A) and washing water flow (B) on RE, RM(Pb),
RM(Cu), RM(Sn), and on the density of the concentrate. As mentioned
previously, both tilt and washing water flow are the main factors in-fluencing the various responses studied. The influence of these para-meters on the mass of the concentrate as well as metal removal ef-ficiencies (RM(M)) seemed to be negative. However, these
parame-ters had positive effects on the density of the concentrate, which was indicative of the degree of the concentrate's purity. Lowering the tilt levels led to results close to those obtained by dense media separa-tion in terms of metal removal efficiencies, where RM(Pb), RM(Cu),
and RM(Sn) tended towards 1. Lowering the tilt generally ensures
a good distribution of material on the shaking table and maximizes the separation process (Mehrotra and Singhal, 2000). However, ac-cording to the RE plot, decreasing the tilt to beyond 10° can pro-mote the particle mass to move excessively to exits E4, E5, E6, and E7 (RE > 1). Consequently, the density of the collected mass at the concentrate zone decreases to less than 3.5 g cm−3. Therefore, to en-sure removal of the mass of the concentrate similar to that obtained by dense media separation, a slight loss of metal removal efficien-cies (RM(M)) has to be tolerated. In fact, a particle density
differ-ence greater than 1 g cm−3is theoretically required for the separation process, and several factors are involved, including particle size dis-tribution and shape (Dermont et al., 2008). Additionally, the acting forces that occur during the operation of the shaking table are more complex than those occurring during dense media separation. In ad-dition to the gravity and buoyancy forces, forces due to the table mo-tion and the flowing film of water play an important role on the mo
tion of particles through the deck (Wills, 2011). In order to reach good separation at low tilt levels, higher washing water flows are necessary. Hence, tilting the deck to between 10.5° and 12° and setting the wash-ing water flow to between 5 and 8 L min−1led to an RE close to 1. Under these conditions, RM(Pb), RM(Cu), and RM(Sn) are higher than
0.6. An acceptable purity of the concentrate can be also obtained with a density exceeding 3.5 g cm−3. Therefore, the concentration of metals can be maximized at the lowest volume of concentrate.
Fig. 5 illustrates the effect of both stroke length (C) and frequency (D) on RM(Pb), RM(Cu), and RM(Sn). Stroke length and frequency are
generally involved in selective particle motion, by bed dilation and stratification (Mehrotra and Singhal, 2000). According to these re-sults, the stroke length appeared to have a negative impact on RM(Pb),
RM(Cu), and RM(Sn). Lowering the stroke length led to an increase in
metal removal efficiencies. The operating conditions of stroke length must vary from 11 to 12 mm to produce results close to those obtained by dense media separation. The interaction between stroke length and stroke frequency has also been studied. A decrease of the stroke length and an increase of the stroke frequency are required to raise the shak-ing table's efficiency of Cu and Sn removal from uncontaminated par-ticles and to obtain results similar to dense media separation (RM(Cu)
and RM(Sn) should be close to 1). Observations of the effect of stroke
frequency on mass removal of the concentrate highlighted that a very large decrease in stroke length can significantly promote the exit of particles of the concentrate zone (RE > 1). It appeared that lowering the stroke length and frequency is necessary for the removal of Pb from uncontaminated particles. RM(Pb) tended to 1 under such
oper-ating conditions. In summary, according to the results presented in Fig. 5, the recommended operating conditions of stroke frequency should be between 350 and 400 strokes·min−1to maximize Cu and
Sn removals, whereas these values should be between 300 and 400 strokes·min−1to maximize the removal of Pb.
3.3.4. Process optimization
Polynomial equations use multiple linear regressions to identify which optimal operational parameters can improve the performance of the shaking table with regard to the removal of Cu, Pb, and Sn from uncontaminated particles and concentrating these contaminants within the smallest possible volume. Tilt, washing water flow, stroke length, and frequency were set at 10.5°, 6.1 L min−1, 11 mm, and 432 strokes·min−1respectively. Table 5 presents the predicted and exper-imental results of RE, density of the concentrate, RM(Pb), RM(Cu),
and RM(Sn) obtained during the validation experiments performed
un-der the optimal conditions described previously. Firstly, it can be ob-served that experimental RE were close to 1, which reflected a sat-isfactory mass removal of the concentrate. It corresponded to 20.8% (w·w−1) of the total mass of the soil sample initially used for the experiment. The recovered concentrate was characterized by an ac-ceptable purity, with a density of 3.32 g cm−3. The experimental re-sults obtained for RM(Pb) and RM(Cu) were 0.8 for Pb and 0.7 for
Cu, which corresponded to 67.3% and to 54.5% of Pb and Cu re-movals respectively. A lower RMthan those predicted was obtained
(RM(Sn) = 0.6) for the removal of Sn, corresponding to a removal of
54.5%. It must be noted that the experimental results were slightly lower than predicted. This reflected the impact of the experimental error relative to the predictive models. For instance, as seen for the removal of Sn, the corresponding CV was around 20%, which may explain the difference between the experimental and predicted val-ues. However, despite this difference, the mathematical models estab-lished were useful to predict the behavior of the shaking table and its (8-d)
UNCORRECTED
PROOF
Fig. 4. Effect of tilt and washing water flow on RE, density of the concentrate, RM(Pb), RM(Cu), and RM(Sn).
performance, and to maximize the gravimetric separation when using the shaking table.
3.4. Movement study and gravimetric treatment of the fine soil fraction (0.250–1 mm)
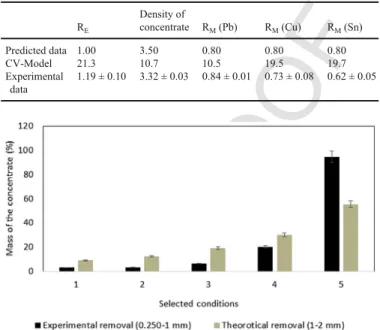
As explained before, the reliability of the mathematical model re-garding the mass movement of the concentrate was demonstrated (the predicted and experimental RE values were similar). The model was then taken through five combinations of shaking table operating fac-tors to check their effects on the motion of the fine-sized soil particles (0.250–1 mm) on the deck. The results obtained from the 0.250–1 mm soil fraction and the predicted values estimated by the mathemati-cal models for the same fraction were compared for different set-tings of the operational conditions. Hence, Fig. 6 was plotted in or-der to unor-derstand if the observations made regarding the 1–2 mm soil fraction can be extrapolated to the 0.250–1 mm soil fraction. This figure presents the results (theoretical mass of medium-sized particles (1–2 mm) and experimental mass of the fine-sized particles (0.250–1 mm)) obtained from the concentrate collecting zone and un-der selected conditions. Details of the setting conditions are men-tioned in Fig. 6. Conditions 1, 2, 3, 4, and 5 are detailed in the leg-end of Fig. 6. They were selected according to the established statisti-cal model, because they gradually allow for an increase of the mass of
the concentrate collected from the 1–2 mm soil fraction. According to Fig. 6, the conditions 1, 2, 3 and 5 ensured a gradual increase of the mass removed from the 1–2 mm fraction. Likewise, a similar ten-dency was observed in the case of the 0.250–1 mm soil fraction. The collected mass of 0.250–1 mm particles increased from 3.0 to 95% under the series of conditions 1 to 5. The optimal condition (condi-tion 3) was defined to effectively separate metals from uncontami-nated particles for the 1–2 mm fraction. However, it led to a lower mass removal in the case of the 0.250–1 mm fraction of soil. Addition-ally, the condition 3 separated a lower mass of concentrate from the 0.250–1 mm fraction than that separated by using dense media sepa-ration (RE = 0.54). The effective treatment of the fine fraction conse-quently needed other adjustments of the shaking table variables. Ex-cept for the condition 5, the conditions 1, 2 and 4 led to a lower mass of concentrate for the 0.250–1 mm soil fraction compared to the re-sults predicted for the 1–2 mm soil fraction. The condition 5 promoted the total feedstock to reach the end of the deck and move to exits E4, E5, E6, and E7, indicating the limit of the separation process. Conse-quently, the statistical model developed during this study is appropri-ate for one specific contaminappropri-ated matrix with specific physical, chem-ical and mineralogchem-ical properties.
According to the results presented Table 6, condition 4 (tilt: 11°, stroke length: 11 mm, stroke frequency: 352 strokes·min−1, and wash-ing water flow: 5 L min−1) led to a satisfying mass removal of the
UNCORRECTED
PROOF
Fig. 5. 5-a: Effect of washing water flow and stroke frequency on RE. 5-b, 5-c, and 5-d:
Effect of stroke length and stroke frequency on RM(Pb), RM(Cu), and RM(Sn) respec-tively.
Table 5
Comparison of the predicted values and the experimental values using optimal condi-tions defined using Expert Design 8.0
RE Density of concentrate RM(Pb) RM(Cu) RM(Sn) Predicted data 1.00 3.50 0.80 0.80 0.80 CV-Model 21.3 10.7 10.5 19.5 19.7 Experimental data 1.19 ± 0.10 3.32 ± 0.03 0.84 ± 0.01 0.73 ± 0.08 0.62 ± 0.05
Fig. 6. Effect of selected conditions on the motion of medium- and fine-sized particles. Table 6
Physical and chemical results of the treatment of fine particles under condition 4. Parameter Density (g.cm−3) Mass(%) Contaminants (mg.kg−1)
Cu Pb Sn Input 100 343 1040 609 E1 2.35 1.92 806 1119 322 E2 2.64 40.9 384 870 384 E3 2.70 49.0 193 470 488 E4 3.20 2.74 729 2636 1701 E 567 3.84 6.91 890 10556 2336
Removal according to the mass balance
(%) 10.0 23.6 42.7 35.2
concentrate, corresponding to 10% of the input mass of the 0.250–1 mm soil fraction, and it was slightly lower than that obtained by dense media separation (13.1%). The corresponding density was around 3.63 g cm−3, reflecting the appreciated purity of the concen-trate produced. This operating condition allowed for a removal of 23.6% of Cu, 42.7% of Pb, and 35.2% of Sn. These results were lower than those obtained by dense media separation (47.5% of Cu, 57.8% of Pb, and 94.7% of Sn). Through these results, the treatment of Sn was more efficient for the 1–2 mm soil fraction than for the 0.250–1 mm soil fraction. This loss of efficiency observed for the removal of Sn from uncontaminated particles using a shaking table was previously reported by Jobin et al. (2016a) who observed that Sn removal from municipal solid waste contaminated soils dropped from 70% to 51% when the size of the particles changed from medium to fine. Accord-ing to the results presented in Table 3, the presence of particles con-taining Sn associated with silicate and calcium oxide/carbonate phases can explain these results. Indeed, the mean density of such particles can be lowered, which may hinder their movement to the concentrate zone.
Regarding the use of the shaking table, condition 4 (tilt of 11°, washing water flow of 5 L min−1, stroke length of 11 mm, and stroke
UNCORRECTED
PROOF
tion to separate Cu and Sn from uncontaminated particles of the0.250–1 mm soil fraction. Compared with the 1–2 mm soil fraction, reductions in the stroke frequency and washing water flow are neces-sary to improve contaminant removal from the 0.250–1 mm soil frac-tion. In fact, reducing the action of these factors induces lower turbu-lence inside the fluid, and therefore, decreases the coefficient of resis-tance of the liquid. Hence, according to Equation (9) (expressed for spherical particles), the drag force of the fluid is reduced (Peker and Helvaci, 2011). Fine-sized particles can therefore cross the water film sheet more effectively and move slowly to the concentrate zone.
where d is the diameter of the particle, C is the coefficient of resistance of the fluid (depending on the Reynolds number), ρfis the volumetric
mass density of the fluid, and v is the particle velocity.
Finally, improved understanding of the influence of operational factors and their interactions on the motion of particles from the 1–2 mm soil fraction allowed for the determination of the most fa-vorable operational conditions to treat the fine-sized particles (0.250–1 mm) through a single pass on the shaking table. Only the mass of the concentrate and the density were used during the optimiza-tion step for the treatment of the 0.250–1 mm soil fracoptimiza-tion, and the number of experiments was reduced from 29 to 5.
4. Conclusions
Densimetric and mineralogical characterization of soils contami-nated by the inappropriate management of municipal solid waste in-cinerator residues revealed the utility and limitations of using gravi-metric processes to treat this type of contamination. During the treat-ment of the soil using dense media separation, Pb, Cu, and Sn were highly concentrated in the heavy fraction. The concentration of Pb var-ied from 7290 mg kg−1(fraction 0.250–1 mm) to 8290 mg kg−1 (frac-tion 1–2 mm). The concentra(frac-tion of Cu varied from 1180 mg kg−1 (fraction 0.250–1 mm) to 3510 mg kg−1whereas the concentration of
Sn varied form 1930 (fraction 0.250–1 mm) to 2360 mg kg−1
(frac-tion 1–2 mm). Whereas it was more difficult to recover Zn from the uncontaminated matrix. The microscopic investigation demonstrated the mineralogical heterogeneity of the contamination and allowed for the classification of particles into various classes according to their gravimetric response during separation. Completely liberated particles and associated contaminants with heavy phases promote the separa-tion. However, associated contaminants with light phases may neg-atively affect the separation process and can explain the loss of ef-ficiency observed during the treatment using the shaking table. The shaking table was efficiently used to treat soil contaminated by mu-nicipal solid waste incineration residues and to concentrate the con-taminants into a smaller volume. For the treatment of the 1–2 mm soil fraction, RE and RM(M) ratios were calculated in order to
de-fine the best shaking table performance. A Box–Behnken method-ology was used to establish quadratic mathematical models, to pre-dict RE, RM(Pb), RM(Cu), RM(Sn), and the density of the
concen-trate depending on the operational conditions used. Tilt and washing water flow appeared to be the main parameters influencing the per-formance of the shaking table. The established mathematical model demonstrated satisfactory performance in predicting the desired re-sponses (mass and metal removals as well as the density of the con-centrate). The following were identified as optimal conditions to re-move Cu, Pb, and Sn from the 1–2 mm soil fraction:
tilt of 10.5°, washing water flow of 6.1 L min−1, stroke length of 11 mm, and stroke frequency of 432 strokes·min−1. These optimal
conditions achieved contaminant concentration within a small frac-tion (corresponding to 20.8% (w·w−1) of the initial mass of soil to be treated), with a mean density of 3.32 g cm−3. The removal yields under these optimal conditions were 67.3%, 54.5%, and 54.6% for Pb, Cu, and Sn respectively. Understanding the influence of the operational parameters and their interactions on the motion of the 1–2 mm parti-cles was useful to determine the most favorable conditions to treat the 0.250–1 mm soil fraction. The number of assays was also minimized from 29 to only 5. Indeed, it was necessary to reduce the forces of the table motion and flowing film of water to enhance the treatment of the 0.250–1 mm soil fraction. The most favorable conditions were iden-tified as follows: tilt of 11°, washing water flow of 5 L min−1, stroke
length of 11 mm, and stroke frequency of 352 strokes·min−1. The re-sults obtained under these conditions were less efficient than those ob-tained by dense media separation for the mass of the concentrate and Pb, Cu, and Sn removals, reflecting the limits of the shaking table as compared to dense media separation.
Acknowledgements
The authors thank Foncer Mine de Savoir, the Natural Sciences and Engineering Research Council of Canada (Project ID number: RDCPJ
418167-11) and Tecosol Inc. for their financial support. They also
ac-knowledge the research assistant Myriam Chartier who provided pre-cious help for the advancement of the project.
Appendix A. Supplementary data
Supplementary data related to this article can be found at https:// doi.org/10.1016/j.jenvman.2017.12.020.
Uncited references
Daniel and Cross, 2012, Design-Expert, 2017.
References
Abanades, S., Flamant, G., Gagnepain, B., Gauthier, D., 2002. Fate of heavy metals during municipal solid waste incineration. Waste Manag. Res. 20, 55–68. Alloway, B., 2013. Heavy metals in soils. In: Trace Metals and Metalloids in Soils and
Their Bioavailability, third ed. Springer, Netherlands, Netherlands, p. 614. Benschoten, J.E.V., Matsumoto, M.R., Young, W.H., 1997. Evaluation and analysis of
soil washing for seven lead-contaminated soils. J. Environ. Eng. 123, 217–224. Bisone, S., Mercier, G., Blais, J.-F., 2013. Decontamination of metals and polycyclic
aromatic hydrocarbons from slag-polluted soil. Environ. Technol. 34, 2633–2648. Burt, R., 1999. The role of gravity concentration in modern processing plants. Miner.
Eng. 12, 1291–1300.
Burt, R., Wilson, M.A., Mays, M.D., Lee, C.W., 2003. Major and trace elements of se-lected pedons in the USA. J. Environ. Qual. 32, 2109–2121.
CEAEQ, 2010. Protocole de lixiviation pour les espèces inorganiques MA. 100 – Lix.com.1.1.. Ministère du Développement durable, de l'Environnement et des Parcs du Québec, Quebec, Qc, Canada, 17.
Chandler, A., Eighmy, T., Hjelmar, O., Kosson, D., Sawell, S., Vehlow, J., Van der Sloot, H., Hartlén, J., 1997. Municipal Solid Waste Incinerator Residues, 1 ed. El-sevier, Netherlands, Netherlands, 973.
Chang, N.-B., Wang, H.P., Huang, W.L., Lin, K.S., 1999. The assessment of reuse po-tential for municipal solid waste and refuse-derived fuel incineration ashes. Re-sour. Conserv. Recycl. 25, 255–270.
Collett, R.S., Oduyemi, K., Lill, D.E., 1998. An investigation of environmental levels of cadmium and lead in airborne matter and surface soils within the locality of a municipal waste incinerator. Sci. Total Environ. 209, 157–167.
, . ,
Dermont, G., Bergeron, M., Mercier, G., Richer-Laflèche, M., 2008. Soil washing for metal removal: a review of physical/chemical technologies and field applications. J. Hazard Mater. 152, 1–31.
. (9)
UNCORRECTED
PROOF
Dong, J., Chi, Y., Tang, Y., Ni, M., Nzihou, A., Weiss-Hortala, E., Huang, Q., 2015. Partitioning of heavy metals in municipal solid waste pyrolysis, gasification, and incineration. Energy Fuels 29, 7516–7525.
Drzymała, J., Swatek, A., 2007. Mineral processing: Foundations of Theory and Prac-tice of Minerallurgy. University of Technology, Wroclaw, Poland, 507. Erikssonv, J., 2001. Concentrations of 61 Trace Elements in Sewage Sludge, Farmyard
Manure, Mineral Fertiliser, Precipitation and in Oil and Crops. Department of Soil Sciences, Swedish University of Agricultural Sciences, Swedish, 69.
Falconer, A., 2003. Gravity separation: old technique/new methods. Phys. Separ. Sci. Eng. 12, 31–48.
Ferreira, S.L.C., Bruns, R.E., Ferreira, H.S., Matos, G.D., David, J.M., Brandão, G.C., da Silva, E.G.P., Portugal, L.A., dos Reis, P.S., Souza, A.S., dos Santos, W.N.L., 2007. Box-Behnken design: an alternative for the optimization of analytical meth-ods. Anal. Chem. 597, 179–186.
Fitzpatrick, R.S., Ghorbani, Y., Hegarty, P.G.R., 2016. Quantitative Mineralogy for Improved Modelling of Shaking Tables, XXVIII International Mineral Processing Congress. Canadian Institute of Mining, Metallurgy and Petroleum, Quebec, Qc, Canada, 19.
FOREG, 2005. Forum of the European Geological Survey Directors. Geochemical At-las Europe, Geological Survey of Finland, Espoo.
FRTR, 2016. Ex situ physical/chemical treatment (assuming excavation), USA. Acces-sible at the following adress: https://frtr.gov/matrix2/section4/4-19.html. Gosselin, A., Blackburn, D., Bergeron, M., 1999. Assessment Protocol of the
Applica-bility of Ore-processing Technology to Treat Contaminated Soils, Sediments and Sludges. Environment and Climate Change Canada, Canada, 142.
Govarthanan, M., Lee, G.-W., Park, J.-H., Kim, J.S., Lim, S.-S., Seo, S.-K., Cho, M., Myung, H., Kamala-Kannan, S., Oh, B.-T., 2014. Bioleaching characteristics, in-fluencing factors of Cu solubilization and survival of Herbaspirillum sp. GW103 in Cu contaminated mine soil. Chemosphere 109, 42–48.
Guemiza, K., Coudert, L., Metahni, S., Mercier, G., Besner, S., Blais, J.-F., 2017. Treatment technologies used for the removal of As, Cr, Cu, PCP and/or PCDD/F from contaminated soil: a review. J. Hazard Mater. 333, 194–214.
Guo, X., Wei, Z., Wu, Q., Li, C., Qian, T., Zheng, W., 2016. Effect of soil washing with only chelators or combining with ferric chloride on soil heavy metal removal and phytoavailability: field experiments. Chemosphere 147, 412–419.
Harrison, R., Hester, R., 1994. Waste Incineration and the Environment. The royal so-ciety of chemistry, Thomas graham house, Science park, Cambridge, 158. Horowitz, A.J., 1991. A Primer on Sediment-trace Element Chemistry, 2 ed. US
Geo-logical Survey, USA, 142.
Hutton, M., Wadge, A., Mllligan, P.J., 1988. Environmental levels of cadmium and lead in the vicinity of a major refuse incinerator. Atmos. Environ. 22, 411–416. Iskandar, I., 2000. Environmental Restoration of Metals-contaminated Soils. Lewis
Publishers, Boca Raton, London, New York, Washington, 320.
Jin, Y., Wu, Y., Cao, J., Wu, Y., 2014. Optimizing decolorization of Methylene Blue and Methyl Orange dye by pulsed discharged plasma in water using response sur-face methodology. J. Taiwan Inst. Chem. Eng. 45, 589–595.
Jobin, P., Coudert, L., Taillard, V., Blais, J.-F., Mercier, G., 2016a. Remediation of in-organic contaminants and polycyclic aromatic hydrocarbons from soils polluted by municipal solid waste incineration residues. Environ. Tech. 37, 1983–1995. Jobin, P., Mercier, G., Blais, J.-F., 2016b. Magnetic and density characteristics of a
heavily polluted soil with municipal solid waste incinerator residues: significance for remediation strategies. Int. J. Miner. Process. 149, 119–126.
Jobin, P., Mercier, G., Blais, J.-F., Taillard, V., 2015. Understanding the effect of attri-tion scrubbing on the efficiency of gravity separaattri-tion of six inorganic contami-nants. Water Air Soil Pollut. 226, 162.
Jordão, H., Sousa, A.J., Carvalho, M.T., 2016. Optimization of wet shaking table process using response surface methodology applied to the separation of copper and aluminum from the fine fraction of shredder ELVs. Waste Manag. 48, 366–373.
Kabata-Pendias, A., 2004. Soil–plant transfer of trace elements—an environmental is-sue. Geoderma 122, 143–149.
Kabata-Pendias, A., 2011. Trace Elements in Soils and Plants, fourth ed. CRC Press, Boca Raton, Fl, USA, 534.
Kabata-Pendias, A., Dudka, S., 1991. Baseline data for cadmium and lead in soils and some cereals of Poland. Water Air Soil Pollut. 57, 723–731.
Khalid, S., Shahid, M., Niazi, N.K., Murtaza, B., Bibi, I., Dumat, C., 2017. A compari-son of technologies for remediation of heavy metal contaminated soils. J. Geochem. Explor. 182, 247–268.
Lado, L.R., Hengl, T., Reuter, H.I., 2008. Heavy metals in European soils: a geostatis-tical analysis of the FOREGS Geochemical database. Geoderma 148, 189–199. Laporte-Saumure, M., Martel, R., Mercier, G., 2010. Evaluation of physicochemical
methods for treatment of Cu, Pb, Sb, and Zn in Canadian small arm firing ranges backstop soils. Water Air Soil Pollut. 213, 171–189.
Marino, M.A., Brica, R.M., Neale, C.N., 1997. Heavy metal soil remediation: the ef-fects of attrition scrubbing on a wet gravity concentration process. Environ. Prog.Prog. 16, 208–214.
Mehrotra, A.K., Singhal, R.K., 2000. In: Environmental Issues and Waste Manage-ment in Energy and Mineral Production, Illustrated. A.A. Balkema/Rotterdam/ Brookfield, Calgary, Alberta, Canada, p. 806.
Mercier, G., 2000. Disponibilité des métaux dans les sols et prévision du rendement d'enlèvement par des techniques minéralurgiques. PhD report Department of Geol-ogy and Geological Engineering, Laval University, Québec, Qc, Canada, 293. Mercier, G., Duchesne, J., Blackburn, D., 2001. Prediction of metal removal efficiency
from contaminated soils by physical methods. J. Environ. Eng. 127, 348–358. Mocellin, J., Mercier, G., Morel, J.L., Blais, J., Simonnot, M.-O., 2015. Factors
influ-encing the Zn and Mn extraction from pyrometallurgical sludge in the steel manu-facturing industry. J. Environ. Manag. 158, 48–54.
Olawoyin, R., Oyewole, S.A., Grayson, R.L., 2012. Potential risk effect from elevated levels of soil heavy metals on human health in the Niger delta. Ecotoxicol. Envi-ron. Saf. 85, 120–130.
Park, J.H., Lamb, D., Paneerselvam, P., Choppala, G., Bolan, N., Chung, J.-W., 2011. Role of organic amendments on enhanced bioremediation of heavy metal(loid) contaminated soils. J. Hazard Mater. 185, 549–574.
Peker, S., Helvaci, S., 2011. Solid-liquid Two Phase Flow. Elsevier Science, Nether-lands, NetherNether-lands, 534.
Prasad, M.N.V., Shih, K., 2016. Environmental Materials and Waste: Resource Recov-ery and Pollution Prevention, 1 ed. Academic press, Amsterdam, Boston, 750. Santoleri, J., Theodore, L., Reynolds, J., 2000. Introduction to Hazardous Waste
Incin-eration, second ed. Wiley, Canada, 656.
Stražišar, J., Sešelj, A., 1999. Attrition as a process of comminution and separation. Powder Technol. 105, 205–209.
Shacklette, H., Boerngen, J., 1984. Element Concentrations in Soils and Other Surficial Materials of the Coterminous United States. U.S. Department of the Interior, Geo-logical Survey, United States.
Takeda, A., Kimura, K., Yamasaki, S., 2004. Analysis of 57 elements in Japanese soils, with special reference to soil group and agricultural use. Geoderma 119, 291–307.
Tanong, K., Coudert, L., Mercier, G., Blais, J.-F., 2016. Recovery of metals from a mixture of various spent batteries by a hydrometallurgical process. J. Environ. Manag. 181, 95–107.
Thornton, I., 2009. Metal Contamination of Soils in Urban Areas, Soils in the Urban Environment. Blackwell Publishing Ltd., 47–75.
Ucaroglu, S., Talinli, , 2012. Recovery and safer disposal of phosphate coating sludge by solidification/stabilization. J. Environ. Manag. 105, 131–137.
USEPA, 1995. Contaminants and Remedial Options at Selected Metal-contaminated Sites. Environmental Protection Agency, USA, 268.
Veetil, D.P., Mercier, G., Blais, J.-F., Chartier, M., Tran, L.H., Taillard, V., 2014. Re-mediation of contaminated dredged sediments using physical separation tech-niques. Soil Sediment Contam. 23, 932–953.
Wei, Y., Shimaoka, T., Saffarzadeh, A., Takahashi, F., 2011. Mineralogical characteri-zation of municipal solid waste incineration bottom ash with an emphasis on heavy metal-bearing phases. J. Hazard Mater. 187, 534–543.
Weidemann, E., 2014. Waste Incineration Residues: Persistent Organic Pollutants in Flue Gas and Fly Ash from Waste Incineration. Ph.D. report University of Amster-dam, AmsterAmster-dam, Netherlands, 92.
Wills, B.A., 2011. Wills' Mineral Processing Technology: an Introduction to the Prac-tical Aspects of Ore Treatment and Mineral Recovery. Butterworth, Amesterdam, Boston, Heidelberg, London, New York, Oxford, Paris, San Diego, San Francisco, Singapore, Sydney, Tokyo 7 ed., 456.
Yao, Z., Li, J., Xie, H., Yu, C., 2012. Review on remediation technologies of soil cont-aminated by heavy metals. Proced. Environ. Sci. 16, 722–729.
Youssef, M., Abd El-Rahman, K., Helal, N., El-Rabiei, M., Elsaidy, S., 2009. Opti-mization of shaking table and dry magnetic separation on recovery of Egyptian placer cassiterite using experimental design technique. J. Ore Dress. 11 (22), 9.