1 2
Methane and carbon dioxide emissions from thermokarst lakes on mineral
3
soils
4 5
Alex Matveev, Isabelle Laurion, and Warwick F. Vincent 6
7
A. Matveev and W.F. Vincent. Centre d’études nordiques (CEN) & Département de biologie,
8
Université Laval, Québec, Canada 9
I. Laurion. Institut national de la recherche scientifique, Centre Eau Terre Environnement
10
(INRS-ETE) and Centre d’études nordiques (CEN), Québec, Canada 11
12
Corresponding author: Alex Matveev (e-mail: [email protected]). 13
14
Abstract: Thermokarst lakes are known to emit methane (CH4) and carbon dioxide (CO2), but 15
little attention has been given to those formed from the thawing and collapse of lithalsas, ice-rich 16
mineral soil mounds that occur in permafrost landscapes. The present study was undertaken to 17
assess greenhouse gas stocks and fluxes in eight lithalsa lakes across a 200-km gradient of 18
permafrost degradation in subarctic Québec. The northernmost lakes varied in their surface-water 19
CO2 content, from below to above saturation, but the southern lakes in this gradient had much
20
higher surface concentrations that were well above air-equilibrium. Surface-water CH4
21
concentrations were at least an order of magnitude above air-equilibrium values at all sites, and 22
the diffusive fluxes of both gases increased from north to south. Methane oxidation in the surface 23
waters from a northern lake was only 10% of the emission rate, but at the southern end it was 24
around 60% of the efflux to the atmosphere, indicating that methanotrophy can play a substantive 25
role in reducing net emissions. Overall, our observations show that lithalsa lakes can begin 26
emitting CH4 and CO2 soon after they form, with effluxes of both gases that persist and increase
27
as the permafrost continues to warm and erode. 28
29
Key words: lithalsa, methane, permafrost, subarctic, thermokarst
30 31
Introduction
32
Lakes and ponds in permafrost landscapes are known to be emission sources of 33
greenhouse gases (GHG) to the atmosphere (Tan and Zhuang 2015; Holgerson and Raymond 34
2016), with potentially large feedback effects on global climate (Grosse et al. 2016; Kokelj and 35
Jorgenson 2013). Zimov et al. (1997) drew attention to the strong output of CH4 from lakes in
36
Siberia formed by thawing and collapse of ice-rich permafrost (thermokarst), and concluded that 37
the CH4 was largely derived from ancient organic carbon that had been previously stored in the
38
frozen soils. Subsequent research suggested that this process may have accelerated the 39
deglaciation during the early Holocene (Walter et al. 2007). A synthesis of data from boreal and 40
Arctic lakes noted that two thirds of the total CH4 emissions from landscapes north of latitude
41
50°N is derived from freshwater systems, with thermokarst lakes contributing about 25% of that 42
total (Wik et al. 2016). A constraint in defining the error in such estimates, however, is the poorly 43
known extent of local and regional variability in GHG fluxes, with large variations among 44
thermokarst lakes (Laurion et al. 2010; Sepulveda-Jauregui et al. 2015; Vonk et al. 2015). 45
Another major source of variability in GHG emissions from thermokarst lakes is that 46
associated with landscape evolution (Allan et al. 2014; Grosse et al. 2016; He et al. 2012; Lipson 47
et al. 2015). Fluxes of CH4 to the atmosphere are thought to be especially high in newly
48
degrading permafrost soils (Kanevskiy et al. 2014; Elvert et al. 2016), with older lakes 49
succumbing to drainage (Grosse at al. 2013; van Huissteden et al. 2011), thereby eliminating the 50
habitat for aquatic methanogens. Thermokarst lakes can also be subject to infilling by sediment 51
and fen/bog vegetation, which may cause such lakes to become net sinks of carbon (Payette et al. 52
2004; Bouchard et al. 2016). However, the exact trajectory of geomorphological change and the 53
associated biogeochemical effects remain uncertain in many regions of permafrost thaw and 54
degradation. 55
In the subarctic region of northern Québec, Canada, two types of landscape contain 56
permafrost mounds and associated thermokarst lakes (Allard and Seguin 1987). First, palsa 57
landscapes occur in organic-rich peatlands, with uplifted ice-cored mounds of frozen Sphagnum 58
and thermokarst lakes created by their permafrost thawing and collapse. The thermokarst lakes 59
associated with palsas (hereafter, palsa lakes) are typically dark-coloured because of elevated 60
concentrations of coloured dissolved organic matter (CDOM). Sunlight is strongly absorbed in 61
their near-surface waters, and the lakes are highly stratified with anoxic conditions through most 62
of the water column and during most of the year (Deshpande et al. 2017). These low or zero 63
oxygen (O2) environments are conducive to methanogenesis, and palsa lakes have strong
64
emissions of both CH4 and CO2 to the atmosphere (Matveev et al. 2016). Another type of terrain
65
occurs on mineral soils as lithalsa landscapes (Calmels et al. 2008), with frost-heaved, clayey, 66
silt-rich permafrost mounds and associated thermokarst lakes (hereafter, lithalsa lakes). Lithalsa 67
lakes are more varied in colour, from blue-green to white to brown (Watanabe et al. 2011), and 68
are also known for their stratified structure and anoxic bottom waters (Deshpande et al. 2015). 69
Like palsa lakes, they accumulate CH4 and CO2 (Laurion et al. 2010) and have high rates of
70
bacterial heterotrophic production (Breton et al. 2009; Roiha et al. 2015). 71
The aim of the present study was to provide an improved understanding of GHG stocks 72
(specifically CO2 and CH4) in lithalsa lakes, and of the emission fluxes from such lakes at
73
different stages of permafrost degradation. We hypothesized that stocks and emissions increase 74
with increasing degree of permafrost degradation, with greatest effects at the warm southern 75
margin of Arctic permafrost landscapes. This hypothesis implies that the northward contraction of 76
permafrost will be accompanied by increased rates of emission, which could continue well after 77
lake formation. We evaluated this hypothesis by making measurements at a series of lithalsa lakes 78
across a gradient of permafrost conditions in subarctic Québec, including at the southern limit of 79
current permafrost extent where thermokarst lakes have formed and persisted for at least many 80
decades. 81
Materials and methods
82
Study sites
83
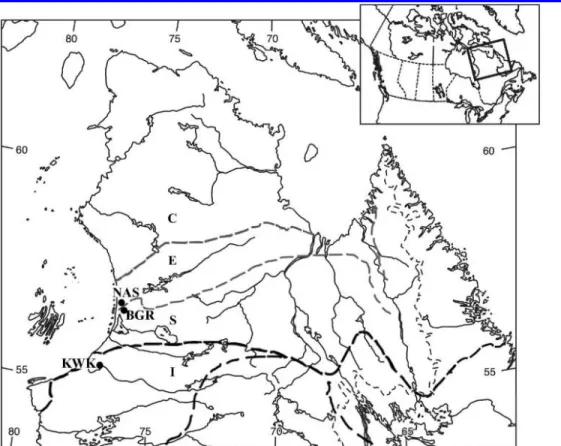
Sampling was in the western Hudson Bay area of Nunavik (Northern Quebec, Canada; 84
Fig. 1), a region experiencing rapid warming and landscape change (Bhiry et al. 2011), and the 85
location of multiple research sites within the program ‘Arctic Development and Adaptation to 86
Permafrost in Transition’ (ADAPT; Vincent et al. 2017) that this study was part of. The region 87
spans four different permafrost zones, from continuous and discontinuous widespread permafrost 88
in the north, to sporadic and isolated permafrost in the south (Allard and Seguin, 1987 Vallée and 89
Payette 2007), with mean annual air temperatures over that geographical range from –4.7 to –2.8 90
ºC. Sampling of lithalsa lakes was at three sites across this north-south gradient (Fig. 1): (a) in 91
discontinuous widespread permafrost, north of the Nastapoka River (56.9°N, 76.3°W; NAS 92
lakes); (b) in discontinuous permafrost, 20 km east of the village of Umiujaq (56.6°N, 76.2°W; 93
BGR lakes); and (c) in degraded sporadic permafrost, 13 km north of the village of 94
Whapmagoostui-Kuujjuarapik and around 200 km south of the NAS site (55.2°N, 77.5°W; KWK 95
lakes; Fig. S1 and associated video1; additional descriptions are given in Bégin and Vincent
96
2017). 97
1
Supplementary data are available with the article through the journal website.
98
Lake sampling and physical, chemical and biological properties
99
In situ measurements and samples were collected from 8 lakes at the three sites (Fig. 1, 100
Table S11) during the summer open-water period, from 2012 to 2015. Vertical profiles of
101
physicochemical properties were obtained from an inflatable boat transported to the sites by 102
helicopter, with a YSI 6000 multi-probe (Yellow Springs Instruments, Yellow Springs, OH, 103
U.S.A.) and an RBR Concerto conductivity-temperature-depth logger (RBR Ltd., Ottawa, ON, 104
Canada). The accuracy of these measurements was ±0.15 °C, ±0.2 pH units, ±0.2 mg oxygen L–1,
105
and ±0.001 mS cm–1 conductivity for the YSI; and ±0.002 °C and ±0.003 mS cm–1 for the RBR.
106
Underwater photosynthetically active radiation (PAR) irradiance was measured with a Licor 107
submersible radiometer. 108
Samples for water analysis were collected at the surface and bottom of the water 109
column, filtered at the Centre for Northern Studies (CEN) research station in Whapmagoostui-110
Kuujjuarapik, and then shipped to home facilities (Laval University and INRS, Quebec City, 111
Canada) for laboratory analysis. Samples for analysis of soluble reactive phosphorus (SRP) were 112
filtered through 0.2 µm cellulose acetate filters and then analyzed using a colorimetric method 113
(Standard Methods 4500-P.E., APHA, AWWA, and WEF 1998) and a Lachat Autoanalyzer 114
(Lachat QuikChem® 8500 Series 2 Flow Injection Analysis System, Hach Company, Loveland, 115
CO, USA). For total phosphorus (TP), unfiltered samples were acidified with 15% H2SO4, 116
digested with persulfate and analyzed for SRP as above. For dissolved organic carbon (DOC) 117
concentrations, filtered (as above) lake water samples were acidified to remove inorganic carbon, 118
and analyzed by high temperature catalytic combustion method with infrared detection (Standard 119
1
Supplementary data are available with the article through the journal website.
Methods 5310 B, APHA, AWWA, and WEF 1998) in a Shimadzu VCPH analyzer (Shimadzu 120
Scientific Instruments, Columbia, MD, USA). The total nitrogen content (TN) was measured 121
from unfiltered water samples by alkaline digestion with persulfate, followed by analysis by the 122
sulfanilamide colorimetric method after reduction with cadmium in a Lachat Autoanalyzer 123
(QuikChem® Method 10–107-04-3-A). Total suspended solids (TSS) were determined by weight 124
after filtration onto precombusted, preweighed glass fiber filters (nominal porosity of 0.7 µm). 125
chlorophyll a concentration (Chl-a) was measured by high-pressure liquid chromatography from 126
pigments extracted with 95% MeOH from the above glass fiber filters kept frozen at −80 °C until 127
analysis, as in Bonilla et al. (2005). 128
129
Automated lake surface observations
130
Automated cameras (Reconyx PC800, Holmen, WI, U.S.A.) were installed on the shores 131
of three thermokarst lakes (one per study site, respectively KWK12, BGR1 and NASa) at a 132
distance of 5–10 m from the edge of the summer water extent. The cameras recorded 6 133
photographs per 24 h period at 1-hour intervals, between 10:00 and 15:00 (Eastern Standard 134
Time, EST). The data were retrieved annually, at the end of August each year. The complete 135
dataset is archived in the Nordicana D data repository (Pienitz et al. 2017). These data were used 136
to calculate the number of days of open water for each site, including for the gas flux 137
calculations. 138
139
CH4 and CO2 measurements 140
Profiles of CH4 and CO2 concentrations were obtained from discrete depth samples, as in
141
Deshpande et al. (2017), and with continuous automated dissolved gas monitoring systems. The 142
discrete depth samples were obtained in triplicate with a thin-layer laminar-flow sampler that had 143
two plates set 63.5 mm apart (Matveev et al. 2016), at 0.1 to 0.5 m depth intervals. The samples 144
were transferred with a peristaltic pump to a 2 L pre-rinsed LDPE bottle. The lake water was then 145
equilibrated with a 20 mL air-filled headspace, and a 10 mL gas sample taken and injected into a 146
5.9 mL helium-flushed, evacuated borosilicate glass vial (Labco Exetainer®, Labco Limited, UK).
147
The gas samples were subsequently analyzed for CH4 and CO2 by gas chromatography with
148
flame ionization detection (Varian 3800, COMBI PAL head space injection system, CP-Poraplot 149
Q 25m with flame ionization detector) as in Matveev et al. (2016). 150
The surface fluxes of CH4 and CO2 were calculated from the dissolved gas concentrations
151
at the air-water interface as in Matveev et al. (2016). We used a wind-based model, with 152
correction for turbulence and low solubility gases as in Vachon et al. (2010). The gas flux Fi for
153
each gas i was expressed assuming molecular diffusion, as: 154
Fi = ki KHi ∆Pi (1),
155
where KHi is the Henry Law constant, ki is the gas transfer velocity, and ∆Pi is the gradient of the
156
gas partial pressures at the air-water interface. 157
Two automated systems were used, depending on sampling conditions: (1) a ‘CO2-box’
158
continuous GHG monitoring system that simultaneously measured dissolved CO2, CH4 and O2
159
content in a gas stream continuously equilibrated with the source water (Carignan 1998, details in 160
Laurion et al. 2010); and (2) a Franatech METS system composed of an infrared-CO2 sensor and
161
a semi-conductor CH4 sensor (Franatech GmbH, Lüneburg Germany) in separate housings and
162
assembled on a flow-through chamber with a constant water flow produced with a submersible 163
pump (model SBE-5T, Sea-Bird Electronics, Inc., Bellevue, WA, USA). The two instruments 164
were cross-calibrated and the datasets combined (an example of the consistency among methods 165
is given in Fig. S21).
166
Gas concentrations in the littoral zone were measured with the CO2-box deployed from
167
the shore (KWK12, BGR1), while concentrations in the deepest offshore water and for the NASa 168
transect were measured with the Franatech METS instrument deployed from the boat. The intake 169
of the CO2-box was submerged to 5–10 cm from the surface, with the peristaltic pump located
170
inside the instrument housing; the METS intake was a 15 cm tube connected to a submersible 171
Seabird pump, and the entire instrument was submerged at around 10 cm depth from the surface 172
for surface samples. 173
Ebullition of CH4 and CO2 was assessed at KWK and BGR sites by collecting gas
174
samples with submerged, opaque, inverted cones, with a 0.5 m2 opening at the bottom and a
175
syringe equipped with a valve at the top (details in Matveev et al. 2016). Two to three gas traps 176
per lake were installed for 1 to 30 days, depending on ebullition rates and logistic constraints. The 177
gas samples were stored in 12 mL or 5.9 mL Labco Exetainer® vials, prepared as above.
178
Sampling dates and numbers of ebullition samples for each lake are given in supplementary Table 179
S21, which also provides the sampling dates for dissolved gas concentrations measured by the
180
headspace, CO2-box and METS profiler methods, as described above.
181
The CH4 oxidation rates were calculated as a linear regression from concentrations
182
measured every 3 h by subsampling a closed vessel containing 20 L of surface lake water 183
1
Supplementary data are available with the article through the journal website.
connected to the CO2-box. The incubations were performed in the laboratory under ambient 184
temperature (ca. 15°C) and low light (< 50 µmol photons m–2 s–1).
185 186
Isotopic composition and radiocarbon
187
Samples for CO2 and CH4 radiocarbon dating (14C isotope) were collected in
helium-188
flushed, evacuated 50 mL serum bottles (Wheaton, USA) from two gas ebullition samples 189
collected from funnels installed in lake BGR1 in 2014. The 14C content of CO2 and CH4 was
190
measured by accelerator mass spectrometry in the Keck Carbon Cycle AMS Facility of the 191
University of California Irvine (CA, USA), as in Matveev et al. (2016). The 14C ages were
192
expressed as fractions of the modern standard (∆14C) following Stuiver and Polach (1977), with
193
all results corrected for isotopic fractionation. 194
The δ13C isotopic fractionation was assessed in the ebullition and the discrete depth
195
samples, all collected in triplicates by the headspace method and stored in 12 mL Exetainer®
196
vials, prepared as above. The δ13C in CH4 and CO2 was measured at the GRIL-UQAM facility
197
(Montreal, QC, Canada) by continuous-flow Cavity Ring-Down Spectroscopy (CRDS) with near-198
infrared laser source method, using a Picarro (Picarro Inc., Santa Clara, CA, U.S.A.) ‘G2201-i 199
δ13C in CH4 and CO2 Gas Analyzer’ (<0.12 ‰ δ13C-CO2 and <0.4 ‰ δ13C-CH4 precision at 1-σ,
200
1-hour window, 5-minute average). The results were expressed as the δ13Cratio of a sample
201
relative to the Vienna Pee Dee Belemnite (VPDB) international measurement standard (Coplen 202
2011). The isotope separation factor between δ13C-CO2 and δ13C-CH4 (εC) was calculated
203
according to Whiticar (1999): 204
εC = δ13C-CO2 – δ13C-CH4 (2)
205
The δ13C-CO2 – δ13C-CH4 carbon isotope partitioning resulting from microbial CH4 production 206
and oxidation was further expressed as a combination plot of the δ13C-CO2 vs. δ13C-CH4, as in
207 Fig. 8 of Whiticar (1999). 208 209 Results 210 Morphometry 211
The lithalsa lakes were all shallow, with an average (± SD) depth of 2.7 (± 1.1) m (Table 212
S11), and a distinct morphometry with steep, eroded shores (Fig. S21). The maximum depths were
213
relatively stable among sampling years at KWK and NAS from 2012 to 2015, but BGR1 214
increased by 0.6 m to a maximum of 4.4 m, while BGR2 increased by 0.25 m to a maximum of 215
1.55 m. The mean surface area of the studied lakes averaged 942 m2 with large variations among
216
sites (CV = 94%), but much less between lakes within each site (average CV = 19%). Within this 217
limited data set, the average lake area per site decreased as a function of distance (R2 = 0.88 for
218
the linear regression) southwards in the study region (Fig. S3, Table S11). There were no
219
observed changes during the period of observation in lake area at KWK and NAS sites, but the 220
BGR site showed further evidence of rapid landscape change. Some of the lithalsa mounds 221
experienced thawing and collapse (thermokarst), producing new lithalsa lakes (e.g., BGRb), and 222
there were also increases in area of some lakes (e.g., BGR1, BGR2) and fusing of adjacent water 223 bodies (Fig. 2). 224 225 1
Supplementary data are available with the article through the journal website
Ice regime and winter snow accumulation
226
The automated camera records showed the lakes were ice-covered for around 8 months 227
each year. At the lake NASa (site NAS) the lake ice formed at the beginning of November 228
(2014), with an overlying layer of snow that accumulated to a maximum thickness of 0.8 m 229
(winter 2015). The ice first broke up during the last week of April (2015), but quickly reformed, 230
with final break-up and disappearance during the first two weeks of June (2015). At the BGR site, 231
the lake ice broke up on lake BGR1 during the last week of May (2015), and the open water 232
period extended from the first week of June until the second week of October (2016). The 233
maximum winter snow accumulation was around 0.7 m (winter 2016). The ice-free period 234
recorded at the lake KWK12 (in the southern KWK valley) was about 2 weeks longer than in 235
BGR (from the last week of May to the third week of October 2016), with a maximum winter 236
(2016) snow accumulation of ca. 0.6 m. None of the three lake ice records showed any evidence 237
of persistent gas bubbling (‘bubbling hot-spots’ as in Wik et al. 2011) on images with clear ice 238
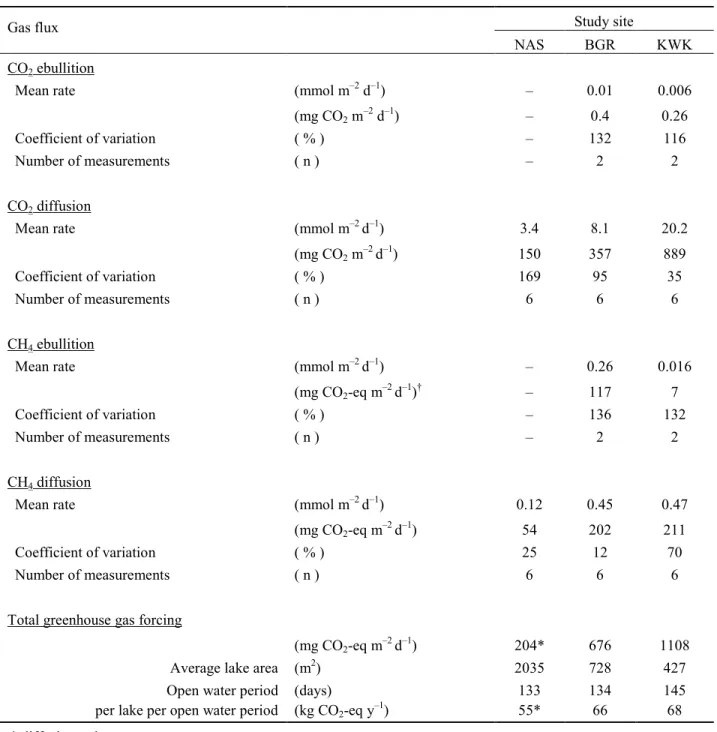
during its formation and break-up. 239
240
Limnological properties
241
All of the lithalsa lakes were thermally stratified during the period of observation, with the 242
shallowest thermocline occurring at 0.5 m depth in NASa (Fig. 3a), possibly linked to the strong 243
light attenuation in its turbid waters (surface TSS = 319 mg L–1, Table 1). The surface mixing
244
zone was 2 and 1.5 m deep in the lakes BGR1 and KWK12 respectively (Fig. 3d, g). The depth of 245
the euphotic zone (1% of surface PAR) similarly varied among the lakes, from 0.55 m in NASa 246
to 4.1 m (to the lake bottom) in BGR1 (Fig. 3a, d, g). The pH was close to neutral in most lakes 247
of NAS and BGR sites (Fig. 3b, e), while it was significantly lower in KWK lakes (P<0.0001 in 248
2-way ANOVA per site comparison), falling to acidic values of 4.6 at the bottom of KWK12 249
(Fig. 3h). Specific conductivity values varied from 2.7 to <15 mS m–1 in most lakes of different
250
permafrost regions, typically increasing with depth by about 50% (Fig. 3b, h), with the exception 251
of BGR1, where it sharply increased up to 40.1 mS m–1 below the mixing zone (Fig 3d, e).
252
TN and TP concentrations were variable among lakes in all sites (Table 1), with no 253
significant difference between the top and bottom of the water column (p>0.1, Wilcoxon test). 254
SRP averaged high values (3.5 µg P L–1), but was similarly variable in all lakes (CV = 85 %), and
255
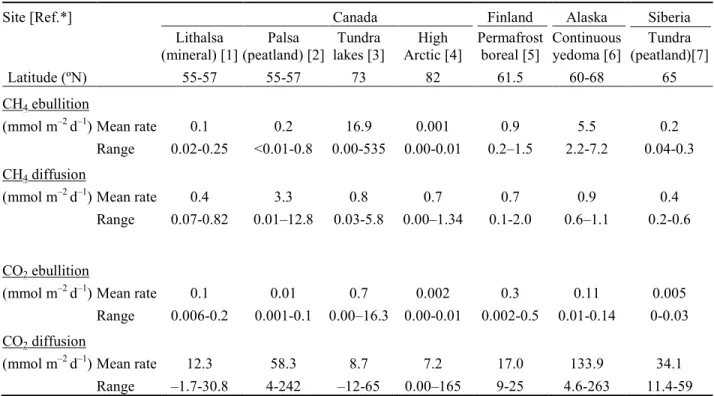
with no significant difference between the top and bottom of the water column (p=0.12, 256
Wilcoxon test). The lakes had substantial concentrations of TSS in their bottom waters, with 257
exceptionally high values throughout the water column of NASa (Table 1). DOC concentrations 258
(all depths combined) were significantly higher (p = 0.007, t-test) in the southern KWK lakes 259
versus northern lakes (BGR and NAS, Table 1), averaging 14.5 and 4.9 mg C L−1, respectively.
260
Chl-a concentrations (all depths combined) were also significantly higher (p=0.025, t-test) in the 261
southern (mean of 16.9 µg L–1) versus northern (mean of 2.5 µg L–1) lakes.
262 263
Dissolved gas concentrations
264
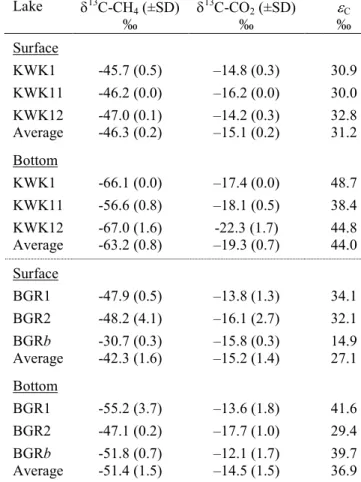
Dissolved O2 concentrations were typically at saturation at the surface of all lakes, with
265
undersaturation at depth, while CH4 and CO2 concentrations varied considerably among sites,
266
lakes and lake depths (Fig. 4). CO2 concentrations increased toward the bottom in all lakes. CH4
267
concentrations also increased with depth in KWK and BGR lakes (Fig.4c-f), but were similar 268
throughout the water column in NAS lakes (Figs 4a, b). 269
Unlike other lakes, the surface waters of lake NASa were undersaturated in CO2 to the
270
depth of 1 m (Fig. 4a) and this gas was in low concentration to 3 m in NASh (Fig. 4b). In lakes of 271
the BGR site, surface CO2 values varied from 29.9 µmol L–1 in BGR1 and 20.5 µmol L–1 in
272
BGR2, to 42.5 µmol L–1 in the newly formed lake BGRb (Table 2). All these were above the air 273
equilibrium value of about 16.7 µmol L–1 (Fig. 5). Surface CO2 concentrations were less variable
274
and generally higher in KWK lakes relative to those in the north, averaging 45.4 ±13.2 µmol L–1.
275
The CH4 concentration at the surface of NAS lakes varied from 0.027 to 0.21 µmol L–1 (Table 2),
276
all at least an order of magnitude above the air equilibrium value of about 0.0031 µmol L–1 (Fig.
277
5). The CH4 concentrations in BGR lakes were much higher, from 0.35 to 0.80 µmol L–1 (Fig. 4c,
278
d), and averaged 0.41 µmol L–1 (Table 2). KWK lakes also had high surface CH4 concentrations
279
averaging 0.43 µmol L–1, including the highest encountered in this study, and large variability
280
among lakes (CV = 78%). 281
The bottom waters of all lakes were supersaturated in CH4 and CO2, with concentrations
282
2-3 orders of magnitude higher than at the surface (Fig. 4, 5). The vertical gradients were much 283
steeper in KWK lakes compared to those in NAS lakes and in some of the BGR lakes (Fig.4); 284
BGR1 (Fig. 4c) and the newly formed BGRb (Fig. S41) also had steep gradients in CO2 and CH4
285
concentrations towards the bottom. The bottom concentrations of CH4 and CO2 were 1 or more
286
orders of magnitude higher in the lakes of the southern KWK site (mean ±SD: 1259 ±1066 µmol 287
CO2 L–1, 310 ±281 µmol CH4 L–1) relative to those of the northernmost NAS site (120 ±58 µmol
288
CO2 L–1, 0.14 ±0.08 µmol CH4 L–1). Values at the BGR sites (1081 ±1402 CO2 L–1, 162 ±165
289
µmol CH4 L–1) were similar to or below those at KWK, however the lake-to-lake variability at all
290
sites was considerable, as shown by the large SD values. 291
To examine lateral variations in GHG concentrations, we sampled one of the larger lakes 292
(NASa) in duplicate at the surface and below the surface (0.7 to 1.0 m depth) at 5 stations 293
extending from one side of the lake to the other (Fig. 6). The variation in CH4 concentrations was
294
1
Supplementary data are available with the article through the journal website.
small, with CVs of 8 % (surface) and 9 % (subsurface). The CO2 variation was slightly larger, 295
with CVs of 23 % (surface) and 20 % (subsurface), with the lowest concentrations measured in 296
the littoral zone at each end of the transect. 297
298
CH4 and CO2 fluxes 299
The diffusive CO2 flux from Nunavik lithalsa lakes gradually increased towards the south
300
in the region of study (Table 3). The values ranged from a net sink of –1.7 mmol CO2 m–2 d–1 (in
301
lake NASa) to a source of up to 30.8 mmol CO2 m–2 d–1 in lake KWK12 (Table 4), with an
302
intermediate value of 8.1 ±7.7 mmol CO2 m–2 d–1 on average in BGR lakes. Although the CO2
303
flux at NAS was on average negative, it alternated between positive and negative values both 304
within one lake and between the lakes of this site at different visits (CV = 168%). The average 305
diffusive flux of CO2 from the southern KWK lakes (20.2 ±7.1 mmol CO2 m–2 d–1) was more than
306
double that from BGR, and an order of magnitude greater than from NAS lakes. There was no 307
significant correlation between the concentrations of DOC and CO2 in these lakes (Table 1; r =
308
0.33, p = 0.42 for surface waters; r = 0.63, p = 0.2 for bottom waters). The diffusive CO2 fluxes
309
were several orders of magnitude greater than the CO2 ebullition fluxes, the latter only measured
310
in BGR and KWK lakes (Table 3). However, the CO2 ebullition flux was an order of magnitude
311
greater at the BGR site (0.01 mmol CO2 m–2 d–1) relative to KWK (0.006 mmol CO2 m–2 d–1).
312
The positive southward gradient was also observed in the CH4 diffusion rates from these
313
Nunavik lithalsa lakes (Table 3). The diffusive CH4 fluxes at the NAS site were always positive
314
(0.12 ±0.03 mmol m–2 d–1), and with low variability between the lakes (CV = 25%). Diffusive
315
emissions from BGR lakes averaged 0.45 ±0.06 mmol CH4 m–2 d–1, in the same order of
316
magnitude than from KWK lakes that showed greater variability (0.47 ±0.33 mmol CH4 m–2 d–1).
317
Similar to the observations for CO2, the mean CH4 ebullition from the BGR site on discontinuous 318
permafrost (0.26 mmol CH4 m–2 d–1) was an order of magnitude greater than that from the KWK
319
site in the largely degraded isolated permafrost region (0.016 mmol CH4 m–2 d–1). Overall, the
320
observed total CH4 fluxes from the studied lakes were within the range of values observed in
321
other thermokarst lakes in the circumpolar region, and the CO2 fluxes were at the upper limit or
322
above the values reported elsewhere (Table 4). 323
324
Isotopic fractionation and 14C-dating of greenhouse gases
325
In general, the δ13C isotopic signatures in dissolved gases were similar in surface waters
326
of the lithalsa lakes (Table 5), with the exception of a low δ13C-CH4 value in the surface water of
327
newly formed lake BGRb. The bottom water δ13C signatures differed significantly from those at
328
the surface in KWK lakes for δ13C-CH4 (paired t = 5.8, p = 0.01) but not for δ13C-CO2 (paired t =
329
2.3, p = 0.07), and for neither gas in the BGR lakes (δ13C-CH4: paired t = 1.5, p = 0.15; δ13
C-330
CO2: paired t = 0.6, p = 0.3). There was greater δ13C depletion in CH4 relative to CO2 in all
331
samples, as expected (Table 5). For all lakes, the isotope separation factor between δ13C-CO2 and
332
δ13C-CH4 (εC) averaged (±SD) -29.1 ±7.1 ‰ in the surface waters, and -40.4 ±6.5 ‰ in the
333
bottom waters (Fig. 7), and there was also a significant difference in εC between the surface and
334
bottom waters of KWK lakes (paired t = 5.5, p = 0.03) but not BGR lakes (paired t = 1.1, p = 335
0.40). The δ13C-CH4 measured in the single BGR1 ebullition sample was –65.6 ‰, which was
336
more depleted than the lowest dissolved CH4 value for this lake (δ13C-CH4 of –55.2 ‰ in the
337
bottom waters). 338
The 14C-age of the ebullition gases collected from lake BGR1 was also highly variable, 339
with the oldest carbon contained in the CO2. The ∆14C values measured in the CO2 in this lake
340
ranged from –225 ±10.6 ‰ to –517.1 ±4.7 ‰, corresponding to the age range from 1990 ±110 to 341
5790 ±80 years before present (yrs. BP) respectively. The ∆14C values measured in CH4 in this
342
lake ranged from 34.4 ±17.3 ‰ to 83.7 ±1.8 ‰, corresponding to modern age (100 to 320 yrs. 343 BP). 344 345 CH4 oxidation rates 346
Concentrations of CH4 during the two laboratory incubations of lake water decreased linearly
347
with time over the 27 to 48 h duration of the experiments, while CO2 concentrations increased
348
(Fig. 8). These net CH4 consumption rates were an order of magnitude higher for KWK (0.38 ±
349
0.02 µmol CH4 L–1 d–1, R2= 0.92) compared to NAS (0.016 ±0.002 µmol CH4 L–1 d–1, R2= 0.94).
350
These values corresponded to 5.7 % (KWK) and 0.8 % (NAS) of the measured net CO2
351 production rates. 352 353 Discussion 354
Landscape changes in the region of the present study were most evident in the BGR area, 355
with deepening, expansion and fusion of lakes, and the creation of new lakes (Fig 2). These 356
effects of the northward contraction and rapid degradation of permafrost have been well 357
documented at BGR (Calmels et al. 2008). Changes of similar origin and scale were observed in 358
the past at the southern end of our sampling region, the KWK valley site, during the period 1930 359
to 1960 (Allard and Seguin 1987). Over more recent decades, however, the total areal extent of 360
lithalsa lakes in degraded permafrost region has remained relatively constant (Bouchard et al. 361
2014). Despite the older age, the KWK lakes continued to retain water up to a depth of almost 3 362
m, with strong stratification and anoxic bottom layers indicating intense microbial activity. 363
The diffusion rates of both CO2 and CH4 were much greater in the KWK lakes than at the
364
more northerly sites where permafrost was less degraded, particularly relative to the NAS lakes. 365
The rates of high diffusion exceeded those for ebullition at all measured sites. This contrasts with 366
many reports for thermokarst lakes elsewhere, where ebullition was the dominant flux (Casper et 367
al. 2000; Bastviken et al. 2011; Wik et al. 2013; Sepulveda-Jauregui et al. 2015). It remains 368
possible that our limited sampling of ebullition missed important periods and places of intense 369
ebullition, and that the values presented here are underestimates. The largest ebullition fluxes that 370
have been observed elsewhere are persistent point sources (‘seeps’ and ‘hotspots’, as in Walter 371
Anthony et al. 2010), which are identifiable in the lake ice-cover (Wik et al. 2011; Lindgren et al. 372
2016). However, our continuous automated camera imaging of the lake surfaces did not reveal 373
any persistent point ebullition in these lakes, nor were such hotspots observed during the 374
sampling campaigns in four consecutive years. Thus, the undersampling error in our estimates of 375
the ebullition flux seems unlikely to be large. It is possible, however, that our estimates of 376
diffusion flux may have included quasi-stable microbubbles of gas (Prairie and del Giorgio 2013) 377
that form in the supersaturated bottom waters and rise up through the water column (Matveev et 378
al. 2016). 379
The total CH4 efflux rates varied among sites and, to a lesser degree, among years and
380
month of sampling, but at all locations the rates were substantial (Table 3). The maximum 381
combined emission rate per unit area of 1.2 g CO2-eq m–2 d–1 was observed in the KWK site
382
experiencing accelerated permafrost degradation. However, the larger northernmost lakes of the 383
NAS site were emitting a similar amount of gas per lake, even although only diffusive fluxes 384
were measured there (Table 3). The KWK lithalsa lakes, which lie in the most degraded 385
permafrost region, had minimal ebullition rates (7.2 mg CO2-eq m–2 d–1, versus rates of 2450 mg
386
CO2-eq m–2 d–1 for lakes elsewhere reported in Wik et al. 2016), and were the smallest of all the
387
studied lithalsa sites in terms of lake area (Table S11). Despite these features, they still emitted an
388
estimated 72.3 kg CO2-eq y–1, as high as the recently formed BGRb. The camera images also
389
indicated that they had a two-week longer open water period, which would favour a more 390
prolonged period of emission. 391
Although these rates generally fall within the range of emissions reported elsewhere, they 392
are less than those of palsa lakes in the same region (Table 4). Palsa lakes show similar pattern of 393
emissions dominated by diffusion, but their organic-rich nature and intense bacterial activity 394
(Deshpande et al. 2016) creates anoxic conditions through most of the water column (Deshpande 395
et al. 2017), with abundant methanogenic communities (Crevecoeur et al. 2016) and thus high 396
rates of methanogenesis. Even the oxygenated strata of these waters may be sites of 397
methanogenesis, as recorded in oxic environments elsewhere (Bogard et al. 2014), and CH4
398
production may be favoured by anoxic microenvironments within the organic particles that occur 399
in high concentration in these waters. 400
The gas concentrations and emission rates measured here were made during the summer 401
period of open water, and future studies will need to consider the full annual cycle. Continuous 402
oxygen data from these subarctic waters indicate prolonged anoxia under the winter ice cover, 403
with mixing of the water column that may be delayed until convective overturn in autumn 404
(Deshpande et al. 2015, 2017). Additional CH4 and CO2 sampling would therefore be of
405
1
Supplementary data are available with the article through the journal website.
particular interest during the late winter ice-cover, spring ice-out and fall cooling periods. 406
Variations are also likely at much shorter timescales. The lithalsa lakes contain moderate 407
chlorophyll a levels (Table 1), and phytoplankton as well as aquatic macrophytes may cause 408
diurnal fluctuations in O2, CO2 and possibly also CH4. Previous studies with the CO2-box on the
409
KWK lakes, for example, have provided initial indications of such diurnal cycles in all three 410
gases (see Fig. 7c in Laurion et al. 2011). Nocturnal cooling and convective mixing may also 411
influence emission rates (Walter Anthony and MacIntyre 2016). 412
413
CH4 oxidation 414
Our laboratory experiments indicate active methanotrophy taking place in these waters under 415
oxygenated conditions, as was expected from previous 16S RNA analyses showing the presence 416
of abundant methanotrophs in these waters (Crevecoeur et al. 2015). In both the KWK and NAS 417
lakes this contributed a small fraction (around 1 to 6%) of the total microbial respiration rate, 418
consistent with the high rates of bacterial heterotrophy in thermokarst waters (Deshpande et al. 419
2016, Roiha et al. 2016). It is also consistent with the 14C data that showed large differences in
420
age between the two GHG, since CO2 derived from CH4 oxidation would yield the same age (see
421
below). The CH4 oxidation rates (0.016 and 0.38 µmol CH4 L–1 d–1 respectively for NAS and
422
KWK lakes) are at the low end of the range reported in other environments, for example 0.02 to 423
1.3 µmol CH4 L–1 d–1 in the surface waters of a boreal lake in Finland (Kankaala et al. 2006).
424
Much higher rates (1.2 to 33.8 µmol CH4 L–1 d–1) were reported from Alaskan lakes across a
425
range of landscapes in summer, however these estimates were derived from longer term (10–12 426
d) incubations after CH4 enrichment (Martinez-Cruz et al. 2015). The CH4 oxidation rates
427
observed in the present study also imply that methanotrophy in lithalsa lakes is a much slower 428
loss process than efflux to the atmosphere: the turnover time for CH4 in KWK12 based on these 429
measured oxidation rates would be 4.4 days, but only 2.8 days based on emission to the 430
atmosphere from the upper 1 m of the water column; the equivalent turnover rates for NASa 431
would be 8.1 (CH4 oxidation) and 0.9 days (efflux). Rapid production and diffusion of CH4 from
432
deeper waters and sediments to the surface waters of the lake would be needed to maintain the 433
CH4 concentrations above air equilibrium, and seems unlikely to be a limiting factor for
434
methanotrophy in these waters, where inorganic nutrient supply may impose a greater constraint. 435
436
Isotopic signatures
437
The analysis of isotopic signatures of CH4 and CO2 in lithalsa lakes showed large
438
variability in their emission sources. The 14C dating of ebullition samples indicated that microbial
439
community in at least one of these lakes has access to an ancient (mid-Holocene) carbon source, 440
probably of the same postglacial origin as in the other lithalsa lakes in the region (Bouchard et al. 441
2014). The ∆14C values of CO2 emitted by ebullition from lake BGR1 varied by a factor of two,
442
with a maximum age of around 6000 years. The ∆14C values of CH4 in the same samples from
443
BGR1 also varied by about a factor of two, but corresponded to more modern ages (100 to 320 y 444
BP). This divergence in ∆14C signatures, with values corresponding to a much older age of the
445
CO2 carbon vs. that of CH4, implies at least partial separation of the pathways for production of
446
the two gases. It is important to note however that the CO2 ebullition flux measured at BGR is
447
only about 4% of CH4 ebullition flux (about 37% at KWK), so this old carbon source may have a
448
negligible impact in terms of greenhouse effect. Differences in age have been found in other 449
studies in the region and further north in the Canadian Arctic (Bouchard et al. 2015; Matveev et 450
al. 2016; Negandhi et al. 2013), and sometimes with the reverse trend showing older CH4
451
associated with methanogenesis based on old organic carbon released from degrading permafrost 452
(Matveev et al. 2016). The older CO2 measured here could potentially be derived from subsurface
453
flows into the lake that pick up this gas from soil decomposition processes, including from 454
thermokarst organic soils as described in the Alaskan tundra by Kling et al. (1991). Younger CH4
455
could be derived from vegetation that occurs at the edge of and within the lithalsa lakes, and that 456
is broken down by anaerobic processes in the bottom waters and sediments. However, the data 457
are limited and will require corroboration with more extensive sampling and analyses. 458
The analysis of the δ13C signatures showed a marked difference between the lithalsa lakes
459
in discontinuous permafrost (BGR) versus those in the largely degraded permafrost (KWK). This 460
difference was especially apparent in the bottom waters, which, in most of these lakes, would be 461
little affected by aerobic oxidation of CH4 that would deplete the δ13C of the remaining CH4.
462
More depleted (i.e., more negative) values of δ13C-CH4 have been attributed to the differential
463
use of lighter substrate carbon by methanogens (Whiticar 1999; Conrad 2005; Sanci and 464
Panarello 2015). This also leads to carbon isotope separation between CH4 and CO2, which can
465
indicate the methanogenic pathways that predominate (Whiticar 1999; Galand et al. 2010). In 466
particular, Whiticar (1999) showed that carbon isotope separation factor εC (Eq.2) in the range of
467
40 to 55‰ is most commonly associated with methylated substrate fermentation prevailing in 468
freshwater environments, while higher and lower values were linked to acetoclastic (AM) and 469
hydrogenotrophic (HM) pathways of CH4 production respectively, with some overlap on both
470
sides (Galand et al. 2010; Penger et al. 2012; Vaughn et al. 2016). The εC values observed in the
471
lithalsa lakes mostly fall at the edge between the ranges associated with HM and AM. This is in 472
line with the analysis of archaeal 16S rRNA in these lakes (Crevecoeur et al. 2016), which found 473
methanogens of the orders Methanomicrobiales (hydrogenotrophic) and Methanosarcinales 474
(multiple pathways) to co-occur in abundance as the dominant Archaea. The lower εC values 475
observed in the surface waters of the lithalsa lakes relative to those in the bottom waters (Table 3) 476
could potentially be linked to CH4 oxidation in the oxygenated epilimnion. The more depleted
477
δ13C-CH4 values observed in the bottom of the KWK lakes (Table 5) may be linked to a greater
478
degree of the substrate depletion by the methanogens. 479
Conclusions
480
Our subarctic observations indicate that lithalsa lakes begin emitting CH4 and CO2 as
481
soon as they are formed. These emissions are through ebullition and diffusion pathways, and are 482
liable to continue and accelerate, particularly via diffusive fluxes, as the permafrost continues to 483
warm and erode. CH4 oxidation appears to have a variable effect in reducing the stocks and
484
therefore diffusive transfers of this gas to the atmosphere; at NAS the oxidation rates were a 485
factor of ten less than emission rates (11% of the calculated efflux from the upper metre of the 486
water column to the atmosphere), but at KWK the oxidation rates were equivalent to around 63% 487
of emissions, indicating a substantive reduction of potential emission rates by methanotrophy. 488
Despite this effect of CH4 oxidation, the KWK lakes were stronger emitters of CH4 than at
489
northern sites, and also emitted more CO2 per unit area. Detailed surveys of lake sizes and density
490
distributions will be needed to fully extrapolate these findings to the landscape scale. However, if 491
the southern KWK lakes can be considered a space for time proxy for future change (Blois et al. 492
2013), these observations imply that thermokarst development in the lithalsa dominated 493
landscape will be accompanied by increased GHG emissions, and that the lakes will persist as 494
strong sources for at least many decades. 495
Acknowledgements
496
We acknowledge the support of the Centre d’études nordiques (CEN), the Natural 497
Sciences and Engineering Research Council of Canada (NSERC) including the Discovery 498
Frontiers project ADAPT, the Canada Research Chair program, the Canada First Research 499
Excellence Funds program Sentinel North (BOND), the Quebec Nature and Technology Research 500
funds (FRQNT), and the Northern Science Training Program. We also thank Valentin Proult for 501
permission to reproduce the bathymetric data in Fig. S31, Tursujuq National Park (Kativik
502
Regional Government) for permission to sample at BGR and NAS, two anonymous reviews for 503
their valuable comments and suggestions, and all of those who helped us in the field and 504
laboratory. 505
506
References
507
Allan, J., Ronholm, J., Mykytczuk, N.C.S., Greer, C.W., Onstott, T.C. and Whyte, L.G. 2014. 508
Methanogen community composition and rates of methane consumption in Canadian 509
High Arctic permafrost soils. Environ. Microbiol. Rep. 6: 136–144. doi: 10.1111/1758-510
2229.12139. 511
Allard, M., and Seguin, M.-K. 1987. Le pergélisol au Québec nordique: bilan et perspectives. 512
Géogr. Phys. Quat. 41: 141–152. doi:10.7202/032671ar. 513
APHA, AWWA, and WEF. 1998. American Public Health Association (APHA), American 514
Water Works Association (AWWA), and Water Environment Federation (WEF). 1998. 515
Standard Methods for the Examination of Water and Wastewater 20th Edition. United 516
Book Press, Inc., Baltimore, Maryland. 517
Bastviken, D., Tranvik, L., Downing, J.A., Crill, P.M., and Enrich-Prast, A. 2011. Freshwater 518
methane emissions offset the continental carbon sink. Science. 331: 50. doi: 519
10.1126/science.1196808. 520
Bégin, P.N., and Vincent, W.F. 2017. Permafrost thaw ponds as habitats for abundant rotifer 521
populations. Arctic Sci. 3: 354-377. doi: 10.1139/AS-2016-0017.
522
Bhiry, N., Delwaide, A., Allard, M., Bégin, Y., Filion, L., Lavoie, M., Nozais, C., Payette, S., 523
Pienitz, R., Saulnier-Talbot, É. and Vincent, W.F. 2011. Environmental change in the 524
Great Whale River region, Hudson Bay: Five decades of multidisciplinary research by 525
Centre d’études nordiques (CEN). Ecoscience. 18: 182–203. doi: 10.2980/18-3-3469. 526
Blois, J.L., Williams, J.W., Fitzpatrick, M.C., Jackson, S.T., and Ferrier, S. 2013. Space can 527
substitute for time in predicting climate-change effects on biodiversity. Proc. Natl. Acad. 528
Sci. USA. 110: 9374-9379. doi: 10.1073/pnas.1220228110. 529
Bogard, M. J., Del Giorgio, P. A., Boutet, L., Chaves, M. C. G., Prairie, Y. T., Merante, A.,et al. 530
2014. Oxic water column methanogenesis as a major component of aquatic 531
CH4 fluxes. Nat. Commun. 5: 5350. doi: 10.1038/ncomms6350.
532
Bonilla, S., Villeneuve, V., and Vincent, W.F. 2005. Benthic and planktonic algal communities in 533
a High Arctic Lake: pigment structure and contrasting responses to nutrient enrichment. J. 534
Phycol. 41: 1120–1130. doi: 10.1111/j.1529- 8817.2005.00154.x. 535
Bouchard, F., Francus, P., Pienitz, R., Laurion, I., and Feyte, S. 2014. Subarctic thermokarst 536
ponds: Investigating recent landscape evolution and sediment dynamics in thawed 537
permafrost of northern Québec (Canada). Arct. Antarct. Alp. Res. 46: 251–271. doi: 538
10.1657/1938-4246-46.1.251. 539
Bouchard, F., Laurion, I., Prieskienis, V., Fortier, D., Xu, X., and Whiticar, M.J. 2015. Modern to 540
millennium-old greenhouse gases emitted from ponds and lakes of the Eastern Canadian 541
Arctic (Bylot Island, Nunavut). Biogeosci. 12: 7279–7298. doi: 10.5194/bg–12-7279-542
2015. 543
Bouchard, F., MacDonald, L.A., Turner, K.W., Thienpont, J.R., Medeiros, A.S., Biskaborn, B.K., 544
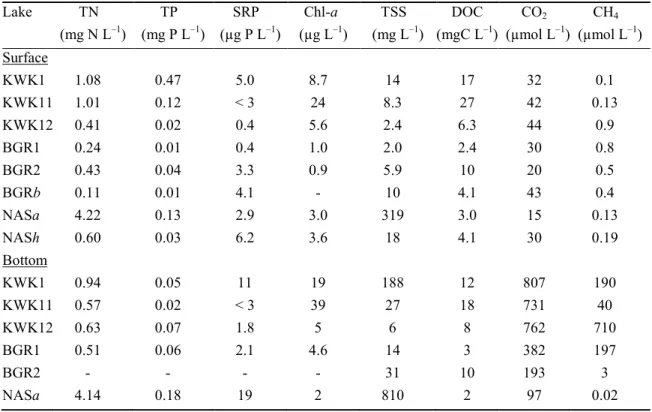
Korosi, J., Hall, R.I., Pienitz, R., and Wolfe, B.B. 2016. Paleolimnology of thermokarst 545
lakes: a window into permafrost landscape evolution. Arctic Sci. 3: 91–117. 546
doi:10.1139/as-2016-0022. 547
Breton, J., Vallieres, C., and Laurion, I. 2009. Limnological properties of permafrost thaw ponds
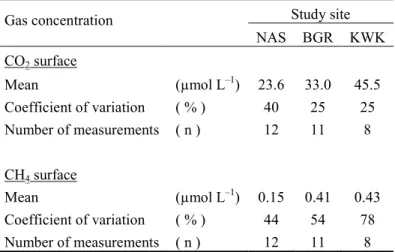
548
in northeastern Canada. Can. J. Fish. Aquat. Sci. 66: 1635–1648. doi:10.1139/F09–108.
549
Calmels, F., Allard, M., and Delisle, G. 2008. Development and decay of a lithalsa in northern 550
Quebec: a geomorphological history. Geomorphology 97: 287–299. doi:
551
10.1016/j.geomorph.2007.08.013. 552
Carignan, R. 1998. Automated determination of carbon dioxide, oxygen, and nitrogen partial 553
pressures in surface waters. Limnol. Oceanogr. 43: 969–975. doi:
554
10.4319/lo.1998.43.5.0969. 555
Casper, P., Maberly, S.C., Hall, G.H., and Finlay, B. J. 2000. Fluxes of methane and carbon
556
dioxide from a small productive lake to the atmosphere. Biogeochem. 49: 1–19.
557
doi:10.1023/A:1006269900174. 558
Conrad, R. 2005. Quantification of methanogenic pathways using stable carbon isotopic 559
signatures: a review and a proposal. Org. Geochem. 36: 739–752. doi: 560
10.1016/j.orggeochem.2004.09.006 561
Coplen, T.B. 2011. Guidelines and recommended terms for expression of stable-isotope-ratio and 562
gas-ratio measurement results. Rapid Commun. Mass Spectrom. 25: 2538–2560. doi: 563
10.1002/rcm.5129. 564
Crevecoeur, S., Vincent, W.F., Comte, J., and Lovejoy, C. 2015. Bacterial community structure 565
across environmental gradients in permafrost thaw ponds: Methanotroph-rich ecosystems. 566
Front. Microbiol. 6: 192. doi: 10.3389/fmicb.2015.00192. 567
Crevecoeur, S., Vincent, W.F., and Lovejoy, C. 2016. Environmental selection of planktonic 568
methanogens in permafrost thaw ponds. Sci. Rep. 6: 31312. doi: 10.1038/srep31312. 569
Deshpande, B.N., MacIntyre, S., Matveev, A., and Vincent, W.F. 2015. Oxygen dynamics in 570
permafrost thaw lakes: Anaerobic bioreactors in the Canadian subarctic. Limnol. 571
Oceanogr. 60: 1656–1670. doi: 10.1002/lno.10126. 572
Deshpande, B.N., Crevecoeur, S., Matveev, A. and Vincent, W.F. 2016. Bacterial production in 573
subarctic peatland lakes enriched by thawing permafrost. Biogeosci. 13: 4411–4427. doi: 574
10.5194/bg–13-4411-2016. 575
Deshpande, B.N., Maps, F., Matveev, A., and Vincent, W.F. 2017. Oxygen depletion in subarctic 576
peatland thaw lakes. Arctic Sci. 3: 406-428. doi: 10.1139/AS-2016-0048.
577
Elvert, M., Pohlman, J.W., Becker, K.W., Gaglioti, B., Hinrichs, K.-U., and Wooller, M.J. 2016. 578
Methane turnover and environmental change from holocene lipid biomarker records in a 579
thermokarst lake in arctic Alaska. Holocene. 26: 1766–1777. doi:
580
10.1177/0959683616645942. 581
Emmerton, C. A., St. Louis, V. L., Lehnherr, Graydon, J. A., Kirk, J. L., and K. J. Rondeau. 582
2016. The importance of freshwater systems to the net atmospheric exchange of carbon 583
dioxide and methane with a rapidly changing High Arctic watershed. Biogeosci. 13: 584
5849–5863. doi: 10.5194/bg–13-5849-2016. 585
Galand, P.E., Yrjälä, K., Conrad, R. 2010. Stable carbon isotope fractionation during 586
methanogenesis in three boreal peatland ecosystems. Biogeosci. 7: 3893–3900. doi: 587
10.1111/gcb.13281. 588
Grosse, G., Jones, B., and Arp, C. 2013. 8.21 Thermokarst lakes, drainage, and drained basins. In 589
Treatise on Geomorphology. Edited by J.F. Shroder. pp. 325–353. Academic Press, San 590
Diego. doi: 10.1016/B978-0–12-374739-6.00216-5. 591
Grosse, G., Goetz, S., McGuire, A.D., Romanovsky, V.E., and Schuur, E.A.G. 2016. Changing 592
permafrost in a warming world and feedbacks to the Earth system. Environ. Res. Lett. 11: 593
040201. doi: 10.1088/1748-9326/11/4/040201. 594
He, R., Wooller, M.J., Pohlman, J.W., Quensen, J., Tiedje, J.M., Leigh, M.B. 2012. Shifts in 595
identity and activity of methanotrophs in Arctic lake sediments in response to temperature 596
changes. Appl. Environ. Microbiol. 78: 4715– 4723. doi: 10.1128/AEM.00853–12. 597
Holgerson, M.A., and Raymond, P.A. 2016. Large contribution to inland water CO2 and CH4
598
emissions from very small ponds. Nature Geosci. 9: 222-226. doi: 10.1038/ngeo2654. 599
Huttunen, J.T., Alm, J., Liikanen, A., Juutinen, S., Larmola, T., Hammar, T., Silvola, J., and
600
Martikainen, P.J. 2003. Fluxes of methane, carbon dioxide and nitrous oxide in boreal 601
lakes and potential anthropogenic effects on the aquatic greenhouse gas emissions. 602
Chemosphere. 52: 609–621. doi: 10.1016/S0045-6535(03)00243–1. 603
Kanevskiy, M., Jorgenson, T., Shur, Y., O’Donnell, J.A., Harden, J.W., Zhuang, Q., and Fortier, 604
D. 2014. Cryostratigraphy and permafrost evolution in the lacustrine lowlands of west-605
central Alaska. Permafr. Periglac. Process. 25: 14–34. doi: 10.1002/ppp.1800. 606
Kankaala, P., Huotari, J., Peltomaa, E., Saloranta, T., and Ojala, A. 2006. Methanotrophic activity
607
in relation to methane efflux and total heterotrophic bacterial production in a stratified,
608
humic, boreal lake. Limnol. Oceanogr. 51: 1195–1204. doi: 10.4319/lo.2006.51.2.1195. 609
Kling, G. W., Kipphut, G.W., and Miller, M. C. 1991. Arctic lakes and streams as gas conduits to 610
the atmosphere: implications for tundra carbon budgets. Science 251: 298-301. doi: 611
10.1126/science.251.4991.298. 612
Kokelj, S.V., and Jorgenson, M.T. 2013. Advances in thermokarst research. Permafrost 613
Periglacial Process. 24: 108–119. doi:10.1002/ppp.1779. 614
Laurion, I., Vincent, W.F., MacIntyre, S., Retamal, L., Dupont, C., Francus, P., and Pienitz, R. 615
2010. Variability in greenhouse gas emissions from permafrost thaw ponds. Limnol. 616
Oceanogr. 55: 115–133. doi: 10.4319/lo.2010.55.1.0115. 617
Lindgren, P.R., Grosse, G., Walter Anthony, K.M., and Meyer, F.J. 2016. Detection and 618
spatiotemporal analysis of methane ebullition on thermokarst lake ice using high-619
resolution optical aerial imagery. Biogeosci. 13: 27–44. doi: 10.5194/bgd–12-7449-2015. 620
Lipson, D.A., Raab, T.K., Parker, M., Kelley, S.T., Brislawn, C.J., and Jansson, J. 2015. Changes 621
in microbial communities along redox gradients in polygonized Arctic wet tundra soils, 622
Environ. Microbiol. Rep. 7: 649–657. doi: 10.1111/1758-2229.12301. 623
Martinez-Cruz, K., Sepulveda-Jauregui, A., Walter Anthony, K., and Thalasso, F. 2015.
624
Geographic and seasonal variation of dissolved methane and aerobic methane oxidation in
625
Alaskan lakes. Biogeosc. 12: 4595-4606. doi: 10.5194/bg–12-4595-2015.
626
Matveev, A., Laurion, I., Deshpande, B.N., Bhiry, N., and Vincent, W.F. 2016. High methane 627
emissions from thermokarst lakes in subarctic peatlands. Limnol. Oceanogr. 61(S1): 628
S150-S164. doi: 10.1002/lno.10311. 629
Myhre, G., Shindell, D., Bréon, F.-M., Collins, W., Fuglestvedt, J. , Huang, J. , Koch, D., 630
Lamarque, J.-F. , Lee, D., Mendoza, B., Nakajima, T., Robock, A., Stephens, G., 631
Takemura T., and Zhang, H. 2013. Anthropogenic and Natural Radiative Forcing. In 632
Climate Change 2013: The Physical Science Basis. Contribution of Working Group I to 633
the Fifth Assessment Report of the Intergovernmental Panel on Climate Change. Edited 634
by T.F. Stocker, D. Qin, G.-K. Plattner, M. Tignor, S.K. Allen, J. Boschung, A. Nauels,
635
Y. Xia, V. Bex and P.M. Midgley. Cambridge University Press, Cambridge, United 636
Kingdom and New York, NY, USA. 637
Negandhi, K., Laurion, I., Whiticar, M.J., Galand, P.E., Xu, X., and Lovejoy, C. 2013. Small 638
thaw ponds: An unaccounted source of methane in the Canadian High Arctic. PLoS ONE. 639
8: e78204. doi: 10.1371/journal.pone.0078204.
640
Payette, S., Delwaide, A., Caccianiga, M., and Beauchemin, M. 2004. Accelerated thawing of 641
subarctic peatland permafrost over the last 50 years. Geophys. Res. Lett. 31: L18208. doi: 642
10.1029/2004GL020358. 643
Penger, J., Conrad, R., Blaser, M. 2012. Stable carbon isotope fractionation by methylotrophic 644
methanogenic archaea. Appl. Environ. Microbiol. 78: 7596–7602. doi:
645
10.1128/AEM.01773–12 646
Pienitz, R., Bouchard, F., Narancic, B., Vincent, W.F., and Sarrazin, D. 2016. Seasonal ice cover 647
and catchment changes at northern thermokarst ponds in Nunavik: Observations from 648
automated time-lapse cameras, v. 1.0 (2014-2015). Nordicana. D24. doi: 649
10.5885/45418AD-AF6A8064C702444B. 650
Prairie Y.T., and del Giorgio, P.A. 2013. A new pathway of freshwater methane emissions and 651
the putative importance of microbubbles. Inland Waters. 3: 311–320. doi: 10.5268/IW-652
3.3.542. 653
Proult, V. 2014. L’origine périglaciaire et son influence sur les écosytèmes thermokarstiques au 654
Nunavik: Analyse des communautés d’algues silicieuses. M. Sc. Thesis. Université Laval, 655
225 pp. 656
Repo, M. E., Huttunen, J. T., Naumov, A. V., Chichulin, A. V., Lapshina, E. D.,, Bleuten, W., 657
and Martikainen, P. J. 2007. Release of CO2 and CH4 from small wetland lakes in
658
western Siberia. Tellus Ser. B. 59: 788–796. doi: 10.1111/j.1600-0889.2007.00301.x. 659
Roiha, T., Laurion, I., and Rautio, M. 2015. Carbon dynamics in highly heterotrophic subarctic 660
thaw ponds. Biogeosci. 12: 7223–7237. doi: 10.5194/bg–12-7223-2015. 661
Sanci, R. and Panarello, H. 2015. Carbon and hydrogen isotopes as tracers of methane dynamic in 662
wetlands. Int. J. Geosci. 6: 720-728. doi: 10.4236/ijg.2015.67058. 663
Sepulveda-Jauregui, A., Walter Anthony, K.M., Martinez-Cruz, K., Greene, S., and Thalasso, F. 664
2015. Methane and carbon dioxide emissions from 40 lakes along a north–south 665
latitudinal transect in Alaska. Biogeosci. 12: 3197–3223. doi: 10.5194/bg–12-3197-2015. 666
Stuiver, M., and Polach, H.A. 1977. Discussion: reporting of 14C data. Radiocarbon 19: 355– 667
363. doi: 10.1017/S0033822200003672. 668
Tan, Z., and Zhuang, Q. 2015. Arctic lakes are continuous methane sources to the atmosphere 669
under warming conditions. Environ. Res. Lett. 10: 054016. doi: 10.1088/1748-670
9326/10/5/054016. 671
Vachon, D., Prairie, Y.T., and Cole, J.J. 2010. The relationship between near-surface turbulence 672
and gas transfer velocity in freshwater systems and its implications for floating chamber 673
measurements of gas exchange. Limnol. Oceanogr. 55: 1723–1732. doi:
674
10.4319/lo.2010.55.4.1723. 675
Vallée, S., and Payette, S. 2007. Collapse of permafrost mounds along a subarctic river over the 676
last 100 years (northern Québec). Geomorphology. 90: 162–170. doi:
677
10.1016/j.geomorph.2007.01.019. 678
van Huissteden, J., Berrittella, C., Parmentier, F.J.W., Mi, Y., Maximov, T.C., and Dolman, A.J. 679
2011. Methane emissions from permafrost thaw lakes limited by lake drainage. Nat. Clim. 680
Change. 1: 119–123. doi: 10.1038/ nclimate1101. 681
Vaughn, L.J.S., Conrad, M.E., Bill, M. and Torn, M.S. 2016. Isotopic insights into methane 682
production, oxidation, and emissions in Arctic polygon tundra. Glob Change Biol. 22: 683
3487–3502. doi: 10.1111/gcb.13281. 684
Vincent, W.F., Lemay, M., and Allard, M. 2017. Arctic permafrost landscapes in transition: 685
Towards an integrated Earth system approach. Arctic Sci. 3: 39-64. doi:
10.1139/AS-686
2016-0027.
687
Walter, K.M., Zimov, S.A., Chanton, J.P., Verbyla, D., and Chapin, F.S. 2006. Methane bubbling 688
from Siberian thaw lakes as a positive feedback to climate warming. Nature. 443: 71–75. 689
doi: 10.1038/nature05040. 690
Walter Anthony K., and MacIntyre, S. 2016. Biogeochemistry: Nocturnal escape route for marsh 691
gas. 2016. Nature. 535: 363. doi: 0.1038/535363a. 692
Walter Anthony, K.M., Vas, D.A., Brosius, L., Chapin III, F.S., Zimov, S.A., and Zhuang, Q. 693
2010. Estimating methane emissions from northern lakes using ice-bubble surveys. 694
Limnol. Oceanogr. Methods 8: 592–609. doi: 10.4319/lom.2010.8.0592. 695
Watanabe, S. Laurion, I., Pienitz, R., Chokmani, K., and Vincent, W.F. 2011. Optical diversity of 696
thaw lakes in discontinuous permafrost: A model system for water color analysis. J. 697
Geophys. Res. – Biogeosc. 116: G02003. doi:10.1029/2010JG001380. 698
Whiticar, M.J. 1999. Carbon and hydrogen isotope systematics of bacterial formation and 699
oxidation of methane. Chem. Geol. 161: 291–314. doi: 10.1016/S0009-2541(99)00092-3. 700
Wik, M., Crill, P.M., Bastviken, D., Danielsson, Å., and Norbäck, E. 2011. Bubbles trapped in 701
arctic lake ice: Potential implications for methane emissions. J. Geophys. Res. 116: 702
G03044. doi: 10.1029/2011JG001761. 703
Wik, M., Crill, P.M., Varner, R.K., and Bastviken D. 2013. Multiyear measurements of ebullitive 704
methane flux from three subarctic lakes. J. Geophys. Res. Biogeosci. 118: 1307–1321, 705
doi: 10.1002/jgrg.20103. 706
Wik, M., Varner, R.K., Walter Anthony, K., MacIntyre, S., and Bastviken, D. 2016. Climate-707
sensitive northern lakes and ponds are critical components of methane release. Nature 708
Geosci. 9: 99–105. doi: 10.1038/ngeo2578. 709
Zimov, S.A., Voropaev, Y.V., Semiletov, I.P., Davidov, S.P., Prosiannikov, S.F., Chapin III, F.S., 710
Chapin, M.C., Trumbore, S., and Tyler, S. 1997. North Siberian lakes: A methane source 711
fueled by Pleistocene carbon. Science. 277: 800–802. doi:10.1126/science.277.5327.800. 712
713
Tables
714
Table 1. Biogeochemical properties of the studied lakes, including total nitrogen (TN), total
715
phosphorus (TP), soluble reactive phosphorus (SRP), chlorophyll a (Chl-a), total suspended 716
solids (TSS), dissolved organic carbon (DOC), and dissolved CO2 and CH4 concentrations.
717
Lake TN TP SRP Chl-a TSS DOC CO2 CH4
(mg N L–1) (mg P L–1) (µg P L–1) (µg L–1) (mg L–1) (mgC L–1) (µmol L–1) (µmol L–1) Surface KWK1 1.08 0.47 5.0 8.7 14 17 32 0.1 KWK11 1.01 0.12 < 3 24 8.3 27 42 0.13 KWK12 0.41 0.02 0.4 5.6 2.4 6.3 44 0.9 BGR1 0.24 0.01 0.4 1.0 2.0 2.4 30 0.8 BGR2 0.43 0.04 3.3 0.9 5.9 10 20 0.5 BGRb 0.11 0.01 4.1 - 10 4.1 43 0.4 NASa 4.22 0.13 2.9 3.0 319 3.0 15 0.13 NASh 0.60 0.03 6.2 3.6 18 4.1 30 0.19 Bottom KWK1 0.94 0.05 11 19 188 12 807 190 KWK11 0.57 0.02 < 3 39 27 18 731 40 KWK12 0.63 0.07 1.8 5 6 8 762 710 BGR1 0.51 0.06 2.1 4.6 14 3 382 197 BGR2 - - - - 31 10 193 3 NASa 4.14 0.18 19 2 810 2 97 0.02 718 719 720
Table 2. Average (summer 2012-2015) surface CH4 and CO2 concentrations per study site. 721 722 Gas concentration Study site NAS BGR KWK CO2 surface Mean (µmol L–1) 23.6 33.0 45.5 Coefficient of variation ( % ) 40 25 25 Number of measurements ( n ) 12 11 8 CH4 surface Mean (µmol L–1) 0.15 0.41 0.43 Coefficient of variation ( % ) 44 54 78 Number of measurements ( n ) 12 11 8 723 724