Experimental investigation of water evaporation from sand and clay using an environmental chamber
340
0
0
Texte intégral
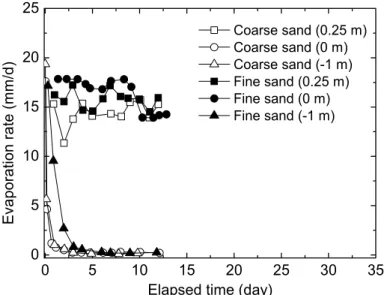
Figure

+7
Documents relatifs