Valorization of pyrolysis biochar by mild oxidation and
its application as adsorbent and catalyst support
Thèse
Raoof Bardestani
Doctorat en génie chimique
Philosophiæ doctor (Ph. D.)
Valorization of pyrolysis biochar by mild oxidation
and its application as adsorbent and catalyst support
Thèse
Raoof Bardestani
Sous la direction de:
Résumé
La conversion thermochimique de la biomasse se traduit par un sous-produit solide appelé biochar. Cette substance écologique peu coûteuse a récemment fait l’objet d’une attention croissante pour son utilisation dans plusieurs applications, en raison de ses propriétés de surface uniques, de sa stabilité physique et de son inertie. Les applications les plus courantes du biochar sont dans l’adsorption, l’amendement du sol et comme support de catalyseur. L’efficacité du biochar dans une application ciblée dépend fortement de ses propriétés de surface physicochimiques, nécessitant ainsi une modification de la surface du biochar.
Cette thèse de recherche se compose de deux parties générales. La première partie est la modification et la caractérisation de la surface du biochar.
Le chapitre 1destiné aux ingénieurs chimistes débutants, rappelle les bases de la physisorp-tion de l’azote, présentant le principe général de la déterminaphysisorp-tion de la surface spécifique (SSA) et l’estimation de la distribution de la taille des pores (PSD). Ces propriétés, c’est-à-dire SSA et PSD, représentant la morphologie des solides, jouent un rôle vital dans la performance des matériaux carbonés dans les applications susmentionnées. La SSA est géné-ralement déterminée par la théorie de Brunauer-Emmett-Teller (BET) à partir de la branche d’adsorption des isothermes d’adsorption-désorption N2, par un intervalle de pression relative de 0, 05 < P/P0 < 0, 3. La PSD est estimée en utilisant soit la méthode de Barrett-Joyner-Halenda (BJH) de la branche de désorption, soit la théorie fonctionnelle de densité non locale (NLDFT) de la branche d’adsorption. Ce dernier permet une estimation plus raisonnable de la PSD.
La modification de la surface d’un biochar obtenu par le procédé de pyrolyse de Pyrovac Inc. a été réalisée par activation à la vapeur et par oxydation ménagée à l’air. Le chapitre 2 résume ainsi les résultats, obtenus par des analyses de caractérisation de surface. Le but de ce chapitre était d’améliorer notre compréhension du contrôle des caractéristiques phy-sicochimiques de la surface du biochar lors de l’activation et de l’oxydation. Les conditions d’activation optimales en termes de combustion du biochar le plus faible avec le SSA le plus élevé ont été trouvées à 900 °C sous une pression partielle de vapeur de 53 kPa sur 60 min. Ces conditions ont conduit à un rendement de 8% (en fraction à poids basé sur la biomasse humide initiale) avec un SSA égal à 1025 m2g−1. La concentration de Boehm en groupes
fonctionnels contenant de l’oxygène du biochar a été réduite de 2.2 à 1.4 mmol g−1Biocharlors de l’activation. Les conditions optimales d’oxydation en termes de la combustion la plus faible et de concentration carboxylique de Boehm la plus élevée ont été trouvées à 200 °C pour 60 min en utilisant 164 ml min−1d’air extra sec qui en écoulement. L’oxydation du biochar a abouti à un rendement final de 18% (en fraction à poids basé sur la biomasse humide initiale), aug-mentant la concentration carboxylique du biochar de 0.4 à 4.2 mmol g−1Biochar. Les conditions de l’oxydation n’ont cependant pas pu introduire de fonctions carboxyliques à la surface du charbon actif.
Dans la deuxième partie, le biochar a été utilisé dans deux applications, reposant sur l’échange de cations. Ces applications sont l’utilisation du biochar dans l’adsorption de cations de métaux lourds des solutions aqueuses et le support de catalyseur.
Des observations détaillées faites dans Chapitre 2, ont suggéré que le biochar oxydé est une sélection plus pratique pour des applications ciblées. Chapitre 3 rapporte des observations expérimentales du comportement du biochar envers l’adsorption des cations plomb (Pb2+). Le but de ce chapitre était d’examiner la capacité du biochar pour l’échange de cations avant et après d’oxydation ménagée à l’air. Les résultats ont montré que l’oxydation de l’air améliore la capacité d’adsorption à l’équilibre du biochar de 2.5 à 44 mg g−1. En utilisant les conditions optimales d’adsorption suggérées par la méthodologie de surface de réponse (RSM), l’analyse SEM/EDX a montré que les bords défectueux du carbone avec la fraction d’oxygène la plus élevée sont les endroits favorables pour adsorber les cations de plomb.
Le biochar a été utilisé pour la préparation du catalyseur Ru/C, par échange d’ions en utilisant le précurseur Ru(NH3)6Cl2. L’analyse SEM a montré que la surface du biochar oxydé était sur-échangée avec du ruthénium après imprégnation. Les analyses TEM et H2-chemisorption ont tous les deux démontré que Ru a une dispersion plus élevée (c’est-à-dire double) sur le biochar oxydé que sur le non oxydé. D’après l’analyse XPS, il a été constaté qu’une oxydation ménagée empêche la ségrégation de Ru sur la surface du carbone. L’activité du catalyseur a été étudiée dans l’hydrogénation du furfural (FF) en alcool furfurylique (FA). Dans des conditions discontinu, Ru supporté sur le biochar oxydé a entraîné une sélectivité plus élevée en alcool furfurylique, ce qui a permis d’obtenir la valeur la plus élevée de la sélectivité 93% FA à 53% FF. L’étude de l’effet des conditions d’hydrogénation a suggéré que la dissolution ou la diffusion de H2 en phase liquide est très probablement l’étape limitante de vitesse.
Abstract
Biomass thermochemical conversion results in a solid byproduct designated as biochar. This inexpensive eco-friendly substance has recently received increasing attention for use in several applications, owing to its unique surface properties, physical stability, and inertness. The most common biochar applications are in adsorption, soil amendment, and as catalyst support. The efficacy of biochar in a targeted application strongly depends on its physicochemical surface properties, thereby requiring biochar surface modification.
This research-based thesis consists of two general parts. The first part is biochar surface modification and characterization.
Chapter 1 provides inexperienced Chemical/Material Engineers with nitrogen physisorption tutorial, presenting general principle of specific surface area (SSA) determination, and the estimation of pore size distribution (PSD). These properties, i.e., SSA and PSD, representing the morphology of solids, play a vital role in the performance of carbonaceous materials in the above-mentioned applications. SSA is usually determined by the Brunauer-Emmett-Teller (BET) theory from the adsorption branch of N2adsorption-desorption isotherms, over the relative pressure range of 0.05 < P/P0 < 0.3. PSD is estimated using either Barrett-Joyner-Halenda (BJH) method from desorption branch, or non-local density functional theory (NLDFT) from adsorption branch. The latter allows more reasonable estimation of PSD. Surface modification of a biochar obtained by the pyrolysis process of Pyrovac Inc. was achieved by steam activation and by mild air oxidation. Chapter 2 thus summarizes the re-sults, obtained by surface characterization analyses. The aim of this chapter was increasing our understanding of controlling biochar physicochemical surface characteristics upon activa-tion and oxidaactiva-tion. The optimal activaactiva-tion condiactiva-tions in terms of the lowest biochar burn-off with the highest SSA were found at 900 °C under a steam partial pressure of 53 kPa over 60 min. These conditions led to a yield of 8 wt.% (based on the initial wet biomass) with SSA equal to 1025 m2g−1. Boehm’s concentration of oxygen-containing functional groups of the biochar was decreased from 2.2 to 1.4 mmol g−1Biochar upon the activation. The optimal conditions of oxidation in terms of the lowest burn-off and the highest Boehm’s carboxylic con-centration were found at 200 °C for 60 min using 164 mL min−1 of flowing extra dry air. The oxidation of the biochar resulted in a final yield of 18 wt.% (based on the initial wet biomass),
increasing the carboxylic concentration of the biochar from 0.4 to 4.2 mmol g−1Biochar. These oxidation conditions did not however allow introducing carboxylic functional groups on the surface of the activated carbon.
In the second part, biochar was employed in two applications, relying on cation-exchange. These applications are biochar use in adsorption of heavy metal cations from aqueous solu-tions, and catalyst support.
Detailed observations carried out inChapter 2, suggested that mildly oxidized biochar is more convenient for the targeted applications. Chapter 3reports experimental observations of the biochar behavior towards lead cations (Pb2+) adsorption. The purpose of this chapter was examining the capacity of biochar for cation-exchange before and after mild air oxidation. Results showed that the mild air oxidation improves capacity of adsorption of the biochar from 2.5 to 44 mg g−1. Using the optimal conditions of adsorption suggested by response surface methodology (RSM), SEM/EDX analysis showed that defective edges of carbon with the highest oxygen fraction are the favorable places to adsorb lead cations.
The biochar was used for preparation of Ru/C catalyst, via ion-exchange using Ru(NH3)6Cl2 precursor. SEM analysis showed that surface of the oxidized biochar was over exchanged with ruthenium after impregnation. TEM and H2-chemisorption analyses both demonstrated that Ru has higher dispersion (i.e., double) on the oxidized biochar than on the unoxidized one. From XPS analysis, it was found that mild oxidation prevents Ru segregation from carbon surface. Catalyst activity was investigated in hydrogenation of furfural (FF) to furfuryl alcohol (FA). Under batch conditions, Ru supported on the mildly oxidized biochar resulted in a higher selectivity to furfuryl alcohol, with the highest value of 93% FA selectivity at 53% FF conversion obtained. Investigating the effect of the hydrogenation conditions suggested that H2 dissolution or diffusion in liquid phase is very likely the rate limited step.
Contents
Résumé iii
Abstract v
Contents vii
List of Tables xi
List of Figures xii
List of Schemes xiv
Acknowledgment xvi
Foreword xviii
Introduction 1
I Outlines . . . 1
II Biochar production . . . 2
III Surface modification of biochar . . . 5
III.1 Activation . . . 6
III.1.1 Physical activation . . . 6
III.1.2 Chemical activation . . . 9
III.2 Functionalization . . . 10
IV Biochar applications . . . 12
IV.1 Biochar as cation adsorbent . . . 13
IV.2 Biochar as catalyst supports . . . 15
IV.2.1 Catalyst preparation. . . 15
IV.2.1.1 Impregnation . . . 15
IV.2.1.2 Adsorption . . . 16
IV.2.1.3 A brief comparison between the methods . . . 16
IV.2.2 Catalytic hydrodeoxygenation of furfural . . . 17
V Research objectives . . . 21
VI Bibliography . . . 24
1 Experimental methods in chemical engineering: Specific surface area and pore size distribution measurements—BET, BJH, DFT 35 1.1 Résumé . . . 35
1.3 Introduction. . . 36
1.4 Theory. . . 41
1.5 Applications. . . 44
1.6 Uncertainties . . . 46
1.6.1 Sources of error and limitations . . . 46
1.6.2 Detection limits. . . 48
1.7 Summary . . . 49
1.8 Bibliography . . . 51
2 Steam activation and mild air oxidation of vacuum pyrolysis biochar 57 2.1 Résumé . . . 57
2.2 Abstract . . . 58
2.3 Introduction. . . 58
2.4 Material and methods . . . 60
2.4.1 Materials preparation . . . 60
2.4.2 Bulk characterization . . . 61
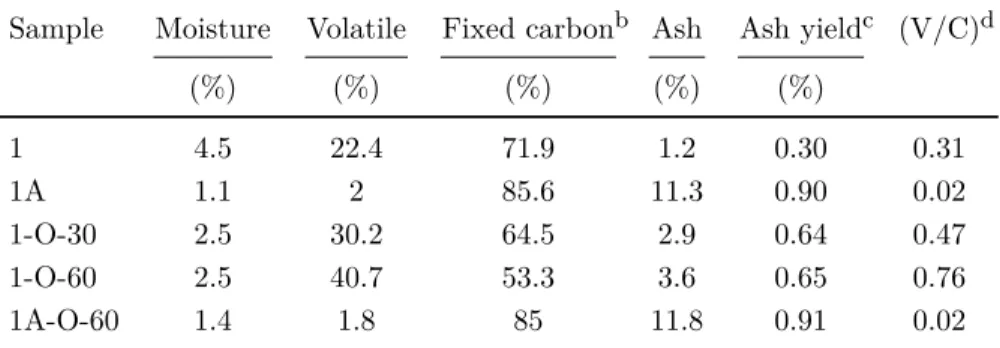
2.4.2.1 Proximate analysis . . . 61
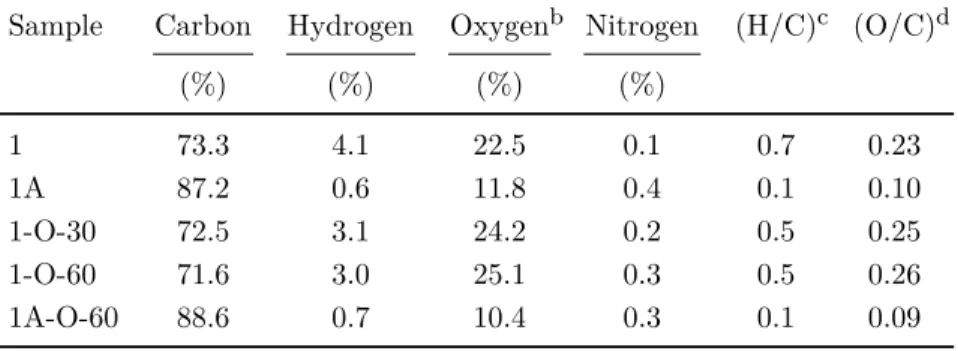
2.4.2.2 Elemental analysis . . . 61
2.4.3 Surface physical characterization . . . 61
2.4.3.1 Nitrogen adsorption-desorption analysis . . . 61
2.4.3.2 SEM/EDX and TEM analyses . . . 62
2.4.4 Surface chemical characterization . . . 62
2.4.4.1 Boehm titration . . . 62
2.4.4.2 Attenuated total reflective Fourier transform infrared spec-troscopy (ATR-FTIR) . . . 63
2.4.4.3 X-ray photoelectron spectroscopy (XPS) . . . 63
2.5 Results and discussion . . . 63
2.5.1 Bulk characterization . . . 63
2.5.1.1 Proximate analysis . . . 63
2.5.1.2 Elemental analysis . . . 64
2.5.2 Surface physical characterization . . . 66
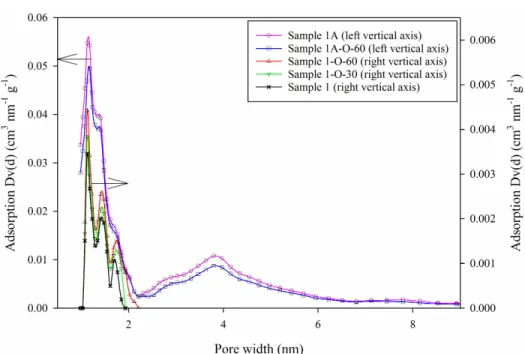
2.5.2.1 Nitrogen adsorption-desorption analysis . . . 66
2.5.2.2 SEM/EDX and TEM analyses . . . 68
2.5.3 Surface chemical characterization . . . 69
2.5.3.1 Boehm titration . . . 70
2.5.3.2 Attenuated total reflective Fourier transform infrared spec-troscopy (ATR-FTIR) . . . 73
2.5.3.3 X-ray photoelectron spectroscopy (XPS) . . . 74
2.5.3.4 Comparison between external and bulk surface functional groups. . . 77
2.6 Summary . . . 78
2.7 Bibliography . . . 80
3 The effect of biochar mild air oxidation on the optimization of lead(II) adsorption from wastewater 85 3.1 Résumé . . . 85
3.2 Abstract . . . 86
3.4 Experimental . . . 89
3.4.1 Materials and methods. . . 89
3.4.1.1 Chemicals. . . 89
3.4.1.2 Pyrolysis . . . 89
3.4.1.3 Oxidation . . . 89
3.4.1.4 Adsorption . . . 90
3.4.1.5 Experimental design, empirical modeling, and optimization 90 3.4.2 Analyses. . . 92
3.4.2.1 Nitrogen physisorption . . . 92
3.4.2.2 Proximate and elemental analyses . . . 92
3.4.2.3 Boehm titration and pH at the point of zero charge . . . . 92
3.4.2.4 ICP analysis . . . 93
3.4.2.5 Scanning electron microscopy (SEM) and energy dispersive X-ray (EDX) analysis . . . 93
3.4.2.6 X-ray photoelectron spectroscopy (XPS) . . . 94
3.4.2.7 Graph plotting . . . 94
3.5 Results and discussion . . . 94
3.5.1 Characterization of biochar before and after oxidation . . . 94
3.5.2 Adsorption optimization using response surface methodology (RSM) 99 3.5.2.1 Modeling . . . 99
3.5.2.2 Three-dimensional response surfaces . . . 104
3.5.2.2.1 Effect of pH. . . 104
3.5.2.2.2 Effect of agitation time. . . 107
3.5.2.2.3 Effect of adsorbent mass. . . 107
3.5.2.2.4 Effect of adsorbate concentration. . . 107
3.5.2.3 Optimization and adsorption equilibrium . . . 108
3.5.3 Characterization of oxidized biochar before and after adsorption . . 110
3.5.3.1 Surface morphology . . . 110
3.5.3.2 X-ray photoelectron spectroscopy (XPS) . . . 112
3.6 Summary . . . 117
3.7 Bibliography . . . 118
4 Hydrogenation of furfural over Ru particles supported on mildly oxi-dized biochar 131 4.1 Résumé . . . 131
4.2 Abstract . . . 132
4.3 Introduction. . . 132
4.4 Experimental . . . 134
4.4.1 Materials and methods. . . 134
4.4.2 Catalysts preparation and reaction procedures . . . 135
4.4.3 Analyses. . . 135
4.5 Results and discussion . . . 137
4.5.1 TPR, nitrogen physisorption, and elemental analyses . . . 137
4.5.2 SEM/EDX, TEM, and chemisorption analyses . . . 141
4.5.3 X-ray Photoelectron Spectroscopy (XPS) . . . 143
4.5.4 Hydrogenation of furfural to furfuryl alcohol over Ru/C . . . 146
4.6 Summary . . . 151
Conclusion 159
I Conclusion . . . 159 II Future perspectives. . . 160
List of Tables
I Common yields of biochar found for thermochemical processes in representative
references. . . 3
II The results of furfural hydrogenation found in representative works (literature data). . . 19
1.1 Examples of mesostructured silica, freed of template either by ozone treatment (-oz) or air calcination (-cal). . . 43
2.1 Proximate analysis.. . . 64
2.2 Elemental analysis. . . 66
2.3 Nitrogen adsorption-desorption isotherms analysis. . . 68
2.4 The concentration of functional groups determined by Boehm titration. . . 70
2.5 The concentration of total acidic functional groups determined by Boehm titra-tion found in the literature. . . 72
2.6 O1s XPS analysis. . . 76
3.1 Experimental levels of the adsorption variables obtained by the central com-posite design (CCD). . . 91
3.2 Characterization of the samples. . . 97
3.3 The analysis of variance (ANOVA) for the obtained quadratic model. . . 101
3.4 The central composite experiment design (CCD) with predicted and experi-mental values of the response. . . 102
3.5 The effect of biochar modification on the equilibrium adsorption capacity of lead (literature data). . . 111
4.1 Characterization of the samples. . . 140
4.2 The results of XPS survey (atomic percentages). . . 143
List of Figures
I Yields of pyrolysis process using lignocellulosic biomass. . . 5
II Common approaches in biochar surface modification. . . 7
III Surface functinal groups: (a) nitrogen containing groups; (b) oxygen contain-ing groups. . . 11
IV Conceptual model representing the mechanisms of cations sorption.. . . 13
V Mechanism of catalysts preparation via adsorption. . . 16
VI The effect of carbon nanotubes—CNTs and carbon black as Pd supports on liquid-phase hydrogenation of furfural under batch conditions.. . . 20
1.1 Gas physisorption apparatus to obtain adsorption-desorption isotherm (vacuum (VAC), calibration (CAL), adsorbate (ADS), pressure gauge (P), V1 to V7 valves). . . 38
1.2 Nitrogen adsorption-desorption isotherms. . . 39
1.3 Types of hysteresis loops obtained by nitrogen physiorption.. . . 40
1.4 Example of BET plot to derive β0 and β1.. . . 42
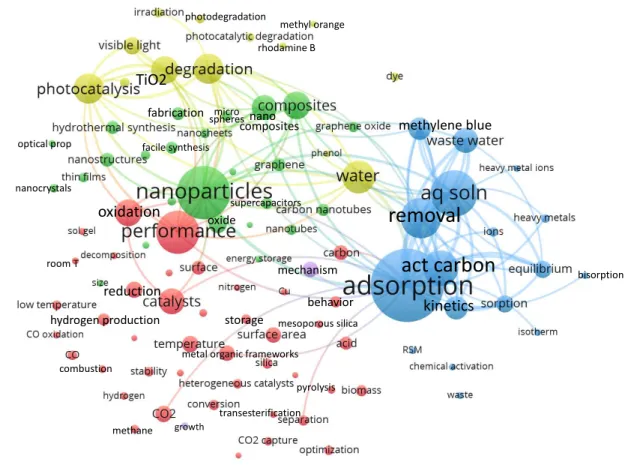
1.5 Bibliometric map of keywords created with VOSviewer software based on the 10 000 most cited articles in 2016 and 2017. . . 47
2.1 TG and DTG curves under nitrogen of (a) Samples 1, 1-O-30, 1-O-60; (b) Samples 1A, 1A-O-60. . . 65
2.2 Nitrogen adsorption-desorption isotherms of samples.. . . 67
2.3 NLDFT pore size distribution (PSD) of samples. . . 67
2.4 Scanning electron microscope (SEM/EDX) images of (a) Sample 1; (b) Sample 1A.. . . 68
2.5 Transmission electron microscope (TEM) images of (a) Sample 1; (b) Sample 1A.. . . 69
2.6 Schematic of various oxygenated functional groups on the surface of carbon . . 70
2.7 Oxygen weight fraction obtained by Boehm and elemental analysis.. . . 73
2.8 FTIR spectra of (a) Samples 1, 1-O-30, 1-O-60; (b) Samples 1A, 1A-O-60. . . 75
2.9 C1s photoelectron spectroscopy spectra (XPS) of (a) Sample 1; (b) Sample 1-O-30; (c) Sample 1-O-60; (d) Sample 1A; (e) Sample 1A-O-60.. . . 76
2.10 Atomic ratio of oxygen to carbon (O/C) obtained by XPS and elemental anal-ysis on the external surface and in the bulk, respectively. . . 78
3.1 Nitrogen adsorption-desorption analysis resulted in (a) iostherms, (b) pore size distribution obtained by non-local density functional theory (NLDFT). . . 95
3.2 (a) The concentration of oxygen-containing functional groups obtained by
Boehm titration; (a0) Surface acidic density along with oxygen mass fraction,
obtained by Boehm titration; (b) The variation of equilibrium pH for
deter-mining the pHpzc using mass the titration method. . . 99
3.3 The 3D surfaces showing the effects of adsorption parameters.. . . 105
3.4 The amphoteric behavior of a biochar, depending on pHpzc. . . 106
3.5 (a) The equilibrium adsorption (isotherm) of lead using sample OBC; (b) The anticipated mechanisms of lead adsorption over biochar. . . 109
3.6 SEM images and EDX spectra of sample OBC (a) before adsorption; (b-d) and (g) after the adsorption of lead under the conditions of pH = 5, m = 0.5 g, CPb2+ = 100 g m−3, and t = 5 h, designated as sample ‘O-i’; (e-f) and (h) after the adsorption of lead under the conditions of pH = 5, m = 0.5 g, CPb2+ = 1000 g m−3, and t = 50 h, designated as sample ‘O-f ’. . . . 113
3.7 XPS analysis: (a) full-range surveys of sample OBC, samples ‘O-i’ ‘O-f ’; (b) C1s spectra of sample OBC before adsorption; (c) Pb4f spectra of sample ‘O-i’; (d) C1s spectra of sample ‘O-i’; (e) Pb4f spectra of sample ‘O-f ’; (f) C1s spectra of sample ‘O-f ’. . . . 114
4.1 (a) TPR analysis; (b) Nitrogen physisorption analysis. . . . 138
4.2 SEM/EDX analysis. . . 142
4.3 TEM analysis. . . 144
4.4 XPS analysis. . . 145
List of Schemes
‘Dedicated to Maestro Mohammad Reza Shajarian’
Acknowledgment
I would like to convey my gratitude and appreciation to all people who have made this dissertation possible.
My deepest gratitude goes first and foremost to my supervisor, Professor Serge Kaliaguine, for giving me the opportunity to undertake this Ph.D., for his patience, continuous support, encouragement and immense knowledge. It definitely was an honor for me to be a part of his research group. During my Ph.D., his guidance and mentoring helped me to significantly improve my skills and in learning the fundamentals of conducting scientific research.
I would like to thank Professor Gaétan Laroche for useful discussions and his invaluable comments about on ATR-FTIR analysis. I thank Professor Manuel Garcia-Perez and Dr. Filip Stankovikj of Washington State University for CHN analysis.
I acknowledge all the people at Laval University, especially Dr. Alain Adnot for his generous support in XPS analysis, Mr. Richard Janvier for TEM analysis, Dr. Marc Choquette and Ms. Suzie Côté for TEM analysis, Mr. Alain Brousseau for ICP, Mr. Guillaume Labrecque for elemental analysis, Mr. Yann Giroux for TGA analysis, Mr. Pierre Audet for GC-MS, Ms. France Cayouette, Ms. Nadia Dumontier, Ms. Ann Bourassa for administrative support, Mr. Jérôme Nöel, Mr. Jean-Nicolas Ouellet, and Mr. Marc Lavoie for their technical supports. I would like to thank Dr. Patrick Atheba for interesting discussion at the early stage of this research. My sincere gratefulness to all my friends, an inspiring group of people especially Dr. Ommolbanin Ali Zadeh Sahraei, Dr. Ali Eslami, Dr. Shahab Boroun, Dr. Arsia Afshar-Taromi, Dr. Mahmood Reza Karimi Estahbanati, Dr. Luc Charbonneau, Ms. Sara Madadi, Ms. Mahsa Loloei, Mr. Rouholamin Biriaei, Mr. Chi-Cong Tran, Mr. Sooran Noroozi, and all my dear colleagues Mr. Soheil Akbari, Mr. Hossein Rahmani, Mr. Hossein Hassanzadeh. I would like to thank the BioFuelNet Center of excellence (Task force 4E) and the Natural Science and Engineering Council of Canada (NSERC) for financial support.
I would like to acknowledge the support of my brother, Mohammad and his wife, Najmeh, Mr. Ali Abrari and his lovely family Gandom, Rozhan, and Nariman, and Mr. Alborz Fazaeli, for their endless love and support during the time of this study.
Moreover, I would like to acknowledge my kind parents and my lovely family who stood by me and supported all my ideas and dreams, for strongly encouraging me to pursue my Ph.D. I love you dearly. Thank you a million times.
Special thanks to my best friend Mr. Mohsen Ghofrani Jahromi for his continuous support. And last but not least, I thank my lovely sister Ghazaleh, and my sweet niece Maryam, for their infinite support.
Foreword
This thesis starts with an introduction, addressing biochar production processes and the methods of surface modification, for application in adsorption and catalyst preparation. The introduction ends with a presentation of the objectives of the thesis. This dissertation contin-ues with four chapters, which are presented as articles in the insertion form. Three chapters of this thesis including Chapter 1, Chapter 2, and Chapter 3, have been already published. Chapter 4 was submitted. The articles are listed below:
Chapter 1: Bardestani, R., Patience, G. S., and Kaliaguine, S. (2019). Experimental methods in Chemical Engineering: Specific surface area and pore size distribution—BET, BJH, DFT, Can. J. Chem. Eng. 97(11): 2781 – 2791.
Chapter 2: Bardestani, R. and Kaliaguine, S. (2017). Steam activation and mild air oxidation of vacuum pyrolysis biochar, Biomass Bioenergy 108: 101 – 112.
Chapter 3: Bardestani, R., Roy, C., and Kaliaguine, S. (2019). The effect of biochar mild air oxidation on the optimization of lead(II) adsorption from wastewater, J. Environ. Manage.
240: 404 – 420.
Chapter 4: Bardestani, R., Biriaei, R. A., and Kaliaguine, S. (2019). Hydrogenation of fur-fural to furfuryl alcohol over Ru particles supported on mildly oxidized biochar, submitted. The thesis ends with a general conclusion, summarizing the main results of this study, and presents some recommendations for future work. The introduction and conclusion sections are originally written by Raoof Bardestani and they have never been published before. This project was supervised by Prof. Serge Kaliaguine.
In addition, some of the extracted results were presented in the following refereed conference proceedings:
à Kaliaguine, S. and Bardestani, R. (August 20– 25, 2017). Activation and mild oxidation of vacuum pyrolysis biochar, ECI Conference: ‘Biochar: Production, characterization, and applications, Alba, Italy’.
à Kaliaguine, S. and Bardestani, R. (June 16 – 21, 2019). The application of pyroly-sis biochar for wastewater treatment, ECI Conference: ‘Pyrolypyroly-sis and liquefaction of
Introduction
I
Outlines
The current demand for energy is the inevitable result of the rapid population growth, as well as the global economic development. The total world energy consumption has been estimated to exceed 900 EJ in the year 2040 (Kambo and Dutta,2015). Presently, fossil fuels are the principal sources of energy. The worldwide request for energy, however, could not be accomplished only using these limited reservoirs. It is also a well-known fact that fossil fuels have raised serious environmental concerns such as the greenhouse effect, resulting in climate change (Dincer and Rosen,1999). With great effort, researchers are thus seeking for adequate alternatives, particularly the renewable resources such as solar energy, hydro and wind powers, fuel cells, and biomass. The latter is the only source to store energy in the form of materials (Afshar-Taromi and Kaliaguine,2018). Lignocellulosic biomass is the most economical type, found abundantly as virgin biomass, e.g., trees and grass, or waste biomass from agricultural activities such as forestry and agriculture (Qian,2014). These sources have been vastly used for biochar production (Brick and Lyutse,2010).
Pyrolysis is one of the most successful processes of agricultural biomass conversion into high value-added chemicals referred to as ‘bio-oil’, containing a variety of biochemicals such as fur-fural. While carbonization has been conventionally used to produce charcoal for a long time, fast pyrolysis is a recent approach with the aim of bio-oil production, usually performed at moderate temperature (450 to 650 °C) and under restricted oxygen concentration ( Bridgwa-ter,2012). Whatever the method of biomass conversion, biochar would be a valuable byprod-uct/product, implemented as adsorbents, soil amendments, catalysts/catalyst supports, and in other relevant applications such as hydrogen storage (Cha et al.,2016). Depending on the targeted applications, biochars need to be treated in order to improve their physicochemi-cal properties. Biochar modifications in terms of surface activation, i.e., producing a highly porous material, or functionalization, i.e., introducing oxygen or nitrogen-containing func-tional groups, have attracted much attention from researchers due to their simplicity and efficiency (Shafeeyan et al.,2010;Bridgwater,2012;Cha et al.,2016).
cat-alyst support in hydrogenation of an aldehyde, namely the conversion of furfural to furfuryl alcohol. To achieve this purpose, the surface of biochar first needs to be modified. With this regard, biochar production is first explained in the next section, followed by a discussion on the approaches implemented by researchers for improving its surface properties. Based on the highlights found in literature, biochar surface modification pursued in this thesis is surface functionalization using mild air oxidation. Before catalyst preparation using expen-sive precious metals, the cation-exchange capacity of the oxidized biochar is examined by the adsorption of lead cations from aqueous solutions. Therefore, a literature review of biochar application in cation-exchange is provided. The successful hydrogenation processes of furfural using carbon supported catalysts are then investigated. This section is completed by listing the detailed objectives of this thesis.
Following the above-mentioned sequence, Chapter 1 of this thesis provides a tutorial in the measurement of the specific surface area and pore size distribution of porous materials by nitrogen physisorption. Chapter 2presents results of experimental biochar activation and ox-idation, which were obtained using different characterization analyses. InChapter 3, oxidized biochar is applied in the adsorption of lead cations, under different experimental conditions. This part allows finding the optimal conditions of lead cations remediation from aqueous so-lutions. The biochar is then used as ruthenium catalyst supports. Its activity is examined in the selective hydrogenation of furfural to furfuryl alcohol, and the results and discussion are presented in Chapter 4. This thesis is brought to an end by a Conclusion section, followed by highlighting the novel contributions of the thesis and future perspectives.
II
Biochar production
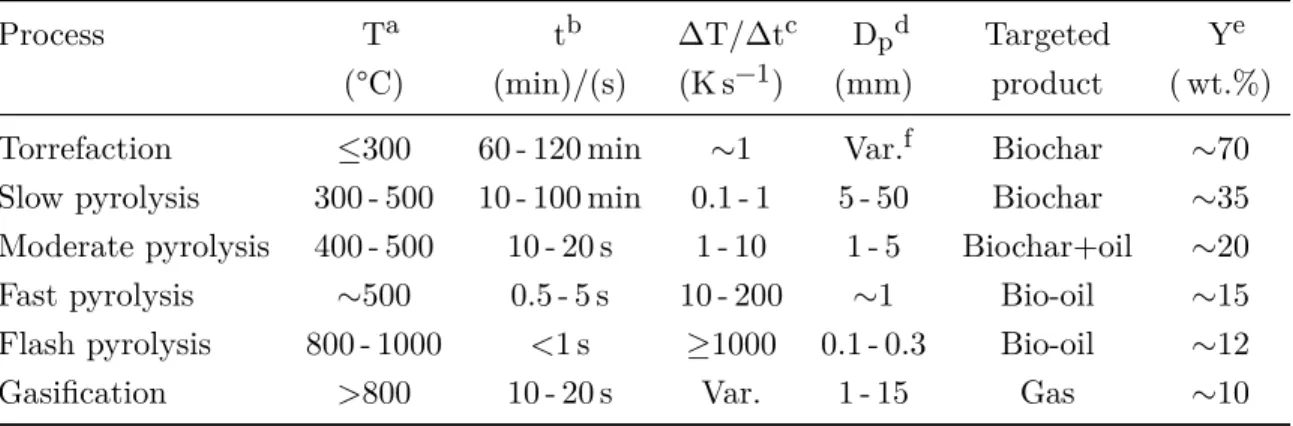
The origin of biochar dates back to ‘Amazonian Dark Earth’ also called Terra Preta de Indio, where high content of pyrogenic carbon leads to an excellent soil fertility. This probably comes from in-field burning of organic wastes by indigenous peoples (Lehmann,2009). According to the International Biochar initiative, biochar is nowadays defined as a material produced by thermochemical biomass conversion under a restricted concentration of oxygen (IBI, 2015). This substance is produced in the form of a solid using torrefaction, pyrolysis, and gasification. Some researchers have however introduced a distinctive definition for biochar, associated to its targeted application. For instance,Lehmann and Joseph (2015) have designated the solid product of torrefaction as charcoal which is implemented for producing fuel and energy, while that produced in pyrolysis mainly has environmental applications, thus is defined as biochar. Product distributions of biomass conversion strongly depend on the type of biomass, process temperature, biomass particle size, and residence time (Demirbas,2004). The possible yields of biochar for lignocellulosic biomass and process conditions are listed in Table I (Mohan et al.,2006;Maschio et al.,1992;Bolan et al.,2013;Scott and Piskorz,1982;Waluyo et al., 2018;Bergman et al.,2005;Horne and Williams,1996;Tinaut et al.,2008).
Table I Common yields of biochar found for thermochemical processes in representative
refer-ences (Mohan et al.,2006;Maschio et al.,1992;Bolan et al., 2013; Scott and Piskorz,1982;Waluyo et al.,2018;Bergman et al.,2005;Horne and Williams,1996;Tinaut et al.,2008).
Process Ta tb ∆T/∆tc Dpd Targeted Ye
(°C) (min)/(s) (K s−1) (mm) product ( wt.%)
Torrefaction ≤300 60 - 120 min ∼1 Var.f Biochar ∼70
Slow pyrolysis 300 - 500 10 - 100 min 0.1 - 1 5 - 50 Biochar ∼35 Moderate pyrolysis 400 - 500 10 - 20 s 1 - 10 1 - 5 Biochar+oil ∼20
Fast pyrolysis ∼500 0.5 - 5 s 10 - 200 ∼1 Bio-oil ∼15
Flash pyrolysis 800 - 1000 <1 s ≥1000 0.1 - 0.3 Bio-oil ∼12
Gasification >800 10 - 20 s Var. 1 - 15 Gas ∼10
aTemperature.
bBiomass residence time. c Reactor heating ramp. dSolid particle size.
e Biochar yield on wet basis. f Variable.
As reviewed byvan der Stelt et al.(2011), torrefaction is usually considered as a pre-treatment of biomass implemented prior to conversion techniques, such as gasification, which requires a higher temperature. Comparing with raw form, torrefied biomass has lower mass and volatiles, and about 90% of raw biomass initial energy content is preserved in the solid product. This makes biochar more attractive for transportation and energy storage (Uslu et al., 2008). Chen et al. (2015) have listed four advantages of torrefied biochar in comparison with raw biomass, as follows: I) higher heating value, II) lower O/C, higher H/C ratios, and lower moisture content, III) higher hydrophobicity, leading to a considerable resistance to water, IV) improved uniformity, reactivity, grindability. As summarized in Table I, this process is performed under very mild conditions of temperature in an inert atmosphere, using an average heating ramp of 1 K s−1. Owing to this temperature range, some researchers such as Demirbas (2009) have designated this process as mild pyrolysis. Boateng and Mullen(2013), however, have mentioned that mild pyrolysis is normally performed at a temperature higher than 300 °C where severe decomposition of biomass occurs, thereby resulting in much lower biochar yield (compare the values of Y in Table I). Pimchuai et al. (2010) investigated the effect of temperature on energy density of produced biochar. They have reported that a temperature increase from 250 to 300 °C, reduces both energy density and biochar yield, but more significantly for the latter. As a consequence, their ratio, i.e., Energy densityBiochar yield , increased by 16%. Also, Ferro et al. (2004) have reported that increasing temperature from 230 to 280 °C produces about 10 wt.% more oil than biochar. Researchers have also reported different ranges of biomass particle size in torrefaction. Bergman et al.(2005) reported that increasing biomass particle size from 0.2 to 1.2 mm, significantly reduced the energy consumption of
woodcuttings torrefaction by ∼75%.
Among various techniques of biomass thermal conversion, pyrolysis has been found as a versatile method, producing higher yields of value-added chemicals (Mohan et al., 2006). Biochar produced by pyrolysis is the focus of this thesis. According to the review published by Parthasarathy and Narayanan (2014), the product distribution of pyrolysis of lignocellulosic biomass could be presented as in Fig. I. Sohi et al. (2010) reported that biomass with high content of lignin yields higher biochar. Biomass extractives are referred to the nonstructural components such as fats, phenolics, resin acids, and waxes, which could be separated by solvent extraction (Thammasouk et al., 1997; Pecha and Garcia-Perez, 2015). The mass percents of the other products, however, depend on pyrolysis conditions. Thus, pyrolysis is categorized into four types including slow, moderate, fast, and flash pyrolysis. One of the main parameter differentiating those is biomass residence time. As presented in Table I, biomass is usually held within 10 to 100 min in a pyrolyzer under slow pyrolysis conditions. Reducing the residence time thus changes products distribution. After torrefaction with biochar yield of ∼70 wt.%, the highest yield can be obtained under slow conditions of pyrolysis, resulting in a yield of ∼35 wt.%. This yield is respectively reduced to 20 and 15 wt.%, keeping biomass under residence time of moderate and fast pyrolysis. This reduction favors bio-oil production. Suliman et al. (2016) have mentioned that slow pyrolysis is considered as a traditional method of biochar production, while fast pyrolysis has been designed for biomass conversion into liquid fuels. Using different sources of biomass, they have reported the highest biochar yield of 39 wt.% using temperature range of 400 to 600 °C. Other parameters listed inTable Isuch as heating ramp (∆T/∆t) and biomass particle size also affect product yields. By increasing heating ramp and using finer biomass size the process produces lower yield of biochar. Fast pyrolysis could rarely be performed at extreme temperature (800 - 1000 °C) with a very high pyrolyzer heating ramp (≥1000 K s−1), resulting in lower yield of biochar. Under those conditions, biomass is crushed into very fine particles such as dust (100 - 300 µm). Gasification might also be considered as a pyrolysis process but carried out at much higher temperature. However, the main difference is the targeted product, which are liquid and gas in pyrolysis and gasification, respectively. Also, gasification is sometime designated as com-bustion, while these two processes do not have same concept. Generally speaking, gasification is employed to produce valuable gaseous products, which might be used either for combus-tion, or to be reserved for other application such as the Fischer–Tropsch process, whereas combustion is mainly for heat generation. As an environmental benefit, the former emits lower content of toxic gases and also yields more biochar (Speight,2016;Zhang et al.,2010).
Biomass pyrolysis Extractives Organic liquids Cellulose (32 - 45%) Non-condensable gas Water Organic liquids Char Hemicellulose (19 - 25 %) Non-condensable gas Water Organic liquids Lignin (14 - 26 %) Non-condensable gas Organic liquids Char Ash
Fig. I Yields of pyrolysis process using lignocellulosic biomass (Redrawn from (Parthasarathy and Narayanan,2014)).
III
Surface modification of biochar
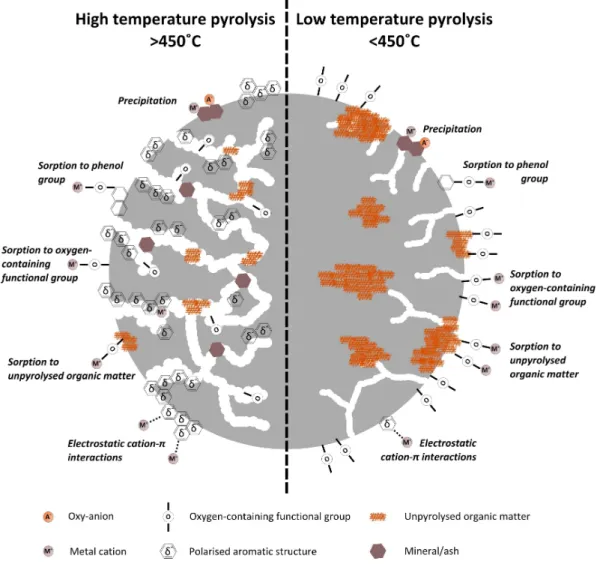
The performance of biochar in most applications depends on its surface characteristics. Those characteristics could be listed as follows: specific surface area, type of pores, hydrophobicity, thermal and mechanical stability, and last but not least surface functional group specia-tion and density. These properties depend on biochar producspecia-tion condispecia-tions. For instance, pyrolysis at a temperature higher than 500 °C results in a fully carbonized biochar with a higher surface area, microporosity, hydrophobicity, and lower oxygenated surface function-alities. This type of biochar, has been reported as a proper adsorbent in aqueous solutions contaminated with chemicals, owing to its higher surface area. On the contrary, biochar produced at a lower pyrolysis temperature (<500 °C) is partially carbonized with higher sur-face density of oxygen-containing functional groups, favoring adsorption of aqueous cations via cation-exchange (Uchimiya et al.,2013;Keiluweit et al.,2010;Kong et al.,2011;Ahmad et al.,2014). Researcher have thus suggested biochar post-treatment via activation and func-tionalization as shown inFig. II, allowing a higher efficiency in targeted applications (Sizmur
et al.,2017).
In the following sections, a literature review is provided, stating the details in activation and functionalization processes, as well as the characterization methods implemented in the literature.
III.1 Activation
The aim of biochar activation is increasing its specific surface area (SSA) and pore volume. Several characterization analyses have been used to evaluate outcomes of activation methods such as nitrogen physisorption, as well as scanning and transmission electron microscopy (SEM and TEM). A tutorial on the former, i.e., nitrogen physisorption is presented in Chapter 1 of this thesis. According to the literature, activation is divided into physical and chemical methods (Jung and Kim,2014;Azargohar and Dalai,2008).
III.1.1 Physical activation
In this type of activation, a physical agent in gaseous form is used to react with carbonized biochar. Implementing high temperature, surface porosity is developed in the form of micro and/or mesopores. As described by Cha et al. (2016), physical activation takes place as follows. First, partially carbonized parts of biochar are converted to fully carbonized, under treatment at high temperature. The unstructured carbonized parts are then decomposed by introducing a physical agent, thereby opening some pores. Those parts are depleted upon a longer time of activation, thereby introducing larger pores and developing porosity.
Steam and carbon dioxide are mainly used in physical activation (Nabais et al.,2008;Zhang et al., 2004). The reaction between the gases and carbon is endothermic, requiring a source of heat provided at temperature range of 500 to 1000 °C. According to a review published by Hadi et al. (2015), steam and CO2can react with carbon as follows:
C(s) + H2O(g) ∆H = 132 kJ mol−1 CO(g) + H2(g) (1 (a)) C(s) + CO2(g) ∆H = 173 kJ mol
−1
2 CO(g) (1 (b))
The characteristics of an activated carbon depend on the nature of the biomass, activation conditions, and activating gas. Cha et al.(2010) performed steam activation of two pyrolyzed chars obtained from rice straw and sludge. Activation was performed at 700 °C for 1 h, using a mixture of steam (40 vol.%) and N2. They have reported that the type of biomass affects SSA. The activation increased SSA of rice straw and sludge based biochar from 140 to 363 m2g−1, and 18 to 64 m2g−1, respectively. González et al. (2009) found that steam activation at 850 °C for 0.5 h results in SSA of 601, 813, and 1080 m2g−1 for almond shell, olive stone, and almond tree pruning, respectively.
Bio char mo dification Activ ation Pre & p ost-p yrolysis Chemical activ ation Acids/Bases e.g., H3 PO 4 , K OH Salts e.g., ZnCl 2 P ost-p yrolysis Ph ysical activ ation Steam CO 2 F unctionalization Post-p yrolysis Nitrogenation Ammonia & its deriv ativ es e.g., CH 3 NH 2
Oxidation Oxidizing agen
ts e.g., O2 , O3 , H2 O2 , HNO 3 Bio char-based comp osites Pre & p ost-p yrolysis Metal o x ides e.g., F e2 O3 Pre-p yrolysis Electro-mo dification Mineral cla y s P ost-p yrolysis Organic compl e x es e.g., Chitosan Micro organisms Fig. I I Common approac hes in bio char surface mo dification (Redra wn from ( S izm ur et al. , 2017 )).
Zhang et al. (2004) studied the effect of activation temperature (700 - 800 °C) and duration (1 - 2 h) on a biochar porosity using CO2. They first implemented fast pyrolysis to produce biochar from three different types of biomass including oak wood waste, corn hulls, and corn stover. For all produced biochars, SSA and micropore volume increased with activation temperature. Increasing activation time, however, showed different effects depending on the type of biomass. The value of SSA increased with activation duration for the biochar produced from oak wood waste, while it decreased for the other two samples. They reported burn-off values in the range of 32 to 50 wt.%, based on the initial mass of biochar. Guo et al. (2009) also investigated the effects of the same parameters, on the CO2-activation of a biochar produced by pyrolysis of coconut shell at 600 °C. It was found that using an activation temperature lower than 900 °C, an increase in temperature enhanced SSA and micropore volume. Increasing activation temperature above 900 °C decreased both SSA and micropore volume, but increased mesopore volume.
Some researchers have reported different effects of steam and carbon dioxide activation in the development of biochar surface area and porosity. Lussier et al. (1994) studied physical activation of cherry stone hulls (hard outer portion of the fruit stone) using steam and CO2. Steam activation was performed at 800 °C for 2 h, and a yield of activated carbon equal to 10 wt.% was reported (wet basis on the initial feedstock). The SSA of the produced activated carbon was equal to 920 m2g−1 (measured by nitrogen physisorption). They have reported that a higher temperature is required to obtain the same value of SSA using CO2, which is associated with lower reactivity of CO2, thus requiring a higher reaction enthalpy (see Eq. 1 (b)). Yang et al. (2016) performed activation of walnut shells at 850 °C for 2 h using steam or CO2. Their objective was the investigation of activated carbon performance in SO2 adsorption from a synthetic flue gas. They have reported a higher SSA using steam, with SSA values of 771 and 552 m2g−1 respectively achieved upon steam and CO2 activation. Using SEM analysis, Linares-Solano and Cazorla-Amorós(2013) have mentioned that carbon activated by CO2has a moderately homogeneous distribution of porosity within carbon bulk, while steam activation develops pores mainly on the outer part of carbon particles. They also stated that carbons physically activated by gases have essentially micropores. Nabais et al. (2008) studied the activation of a pyrolyzed biochar obtained from coffee hulls. They performed activation for 1 h at 600 and 700 °C using steam and CO2, respectively. Burn-off values equal to 40 and 45 wt.% were obtained, resulting in SSA of 554 to 630 m2g−1, respectively. Rodríguez-Reinoso et al.(1995) found that physical activation with pure steam results in an activated carbon with lower micropore volume than CO2. But, it produces pores with larger diameter than CO2, thereby exhibiting a wider pore size distribution. This observation might be useful for researchers who use activated carbon in supported catalyst preparation via methods relying on pore size and pore volume such as incipient wetness impregnation.
III.1.2 Chemical activation
Performing biochar activation using a chemical is designated as chemical activation. The common chemicals are acids, bases, and salts such as H3PO4, KOH, and ZnCl2, respec-tively (Ioannidou and Zabaniotou,2007). Linares-Solano et al.(2007) have listed the advan-tages of chemical activation over physical activation, as follows: I) requires lower temperature and process duration, II) usually consists of one step, III) results in a higher yield of acti-vated carbon. However, chemical activation has also some demerits. Chemically actiacti-vated biochars always contain high concentration of the chemical used for the treatment, thereby requiring repeated washing step. Moreover, performing chemical activation simultaneously with pyrolysis or carbonization (considered as a single step activation) results in corrosion on equipment. That thus limits the use of chemical activation in large scale.
In addition to the parameters affecting both physical and chemical activation, the type and the amount of chemical affect activated carbon. Ros et al.(2006) have reported a systematic investigation on activation of sewage sludge-based char. They first produced the char using a lab-scale pyrolyzer for 30 h at 700 °C and heating ramp of 15 K min−1. Physical activation performed using CO2at 750 °C for 3 h, led to an activated carbon with SSA of 62 m2g−1. A burn-off around 17 wt.% based on the initial char was also reported. They then used H3PO4, NaOH, and KOH for chemical activation. Chemical activation was performed in two steps. In the first step, separated mixtures of the char and the chemicals were prepared. In the case of activation with the acid, 15 g of the char was mixed with with 30 mL of H3PO450 wt.%, In activation with bases, the char was mixed with ground solid NaOH or KOH using a certain weight ratio of the char to the chemicals. The dried mixtures were then heated at 700 °C for 1 h, using the same pyrolyzer. For H3PO4, the produced activated carbon just showed SSA of 17 m2g−1, where 20 wt.% burn-off was reported. The char mixed with NaOH and KOH at a weight ratio of one, resulted in SSA of 689 and 853 m2g−1, respectively. About 35 wt.% burn-off was reported in both cases. Increasing the mass ratio of NaOH or KOH to the char from 1 and 3 increased SSA to 1224 and 1686 m2g−1, respectively. The change in the burn-off value was not reported.
Angın et al. (2013) chemically activated a biochar produced by pyrolysis of safflower seed at 500 °C under N2flow. They have indeed studied the effect of activation temperature and impregnation ratio of ZnCl2to biochar on activation yield, SSA, and total pore volume (Vt). Using an impregnation ratio of 4, temperature increase from 600 to 900 °C changed yield, SSA, and Vt from 75 to 30 wt.%, 250 to 802 m2g−1, and 0.15 to 0.4 cm3g−1, respectively. They also reported that the activation burn-off is dependent to impregnation ratio if it would be performed at a temperature higher than 600 °C. Using an activation temperature of 900 °C, increasing the impregnation ratio from 1 to 4 increased SSA and Vt from 620 to 802 m2g−1, and from 0.33 to 0.4 cm3g−1, respectively. The yield based on the initial weight of the biochar was so reduced from 40 to 30 wt.%.
Tay et al.(2009) prepared activated carbon from a waste obtained in soybean oil production. Using a pyrolysis process performed at 800 °C, resulted in a biochar with dry basis yield of 27.8 wt.% (based on dried biomass) and SSA of 6 m2g−1. They then implemented a one-step chemical activation. The biomass was first mixed with K2CO3or KOH for 24 h. The mixture was washed and dried, followed by the pyrolysis. They have found that K2CO3 is a better choice to produce an activated carbon with higher SSA, also resulting in a higher yield. The biochar activated with K2CO3 showed SSA of 1353 m2g−1 with a yield of 11.7 wt.%, while KOH resulted in SSA of 619 m2g−1 and yield of 4.2 wt.%.
III.2 Functionalization
Functionalization is mainly defined as introducing either nitrogen or oxygen-containing func-tional groups on the surface of biochar. This modification has drawn considerable attention especially when biochar is applied as adsorbent. Shafeeyan et al. (2010) mentioned that chemical features of biochar are mostly determined by a certain degree of surface chemical heterogeneity, originating from heteroatoms such as nitrogen, oxygen, sulfur, and phospho-rus. Snoeyink and Weber (1967) have stated that the type of heteroatom and its surface concentration are derived from the nature of raw feedstock implemented in biochar produc-tion, but could be introduced or amplified by functionalization processes. As discussed by Montes-Morán et al. (2004), nitrogen and oxygen containing functional groups are the most versatile ones, which improve biochar performance in the applications requiring surface func-tionalities. Various types of nitrogen and oxygen containing surface functional groups are presented in Fig. III. These groups are usually located either on the outer surface of carbon or the edges of basal planes (Shafeeyan et al.,2010;Jia et al.,2002). Some observations were also reported, indicating that SSA of a porous carbon decreases upon functionalization. This has been attributed to the formation of functional groups near the pore openings, thereby partially blocking the pore entrance (Aburub and Wurster,2006).
Nitrogen containing functional groups could be introduced on carbon surface using reaction with nitrogen containing chemicals such as NH3, HNO3, amines, CH3CN, and their deriva-tives (such as polyacrylamide and tetraethylenepentamine) (Stoeckli et al., 1996; Pittman et al.,1997; Carrott et al.,2001). These functionalities lead to carbon surface basicity, thus improving the adsorption of trace amounts of acidic gases (e.g., SO2and H2S) from gaseous media. Another source of carbon surface basicity is resonating π-electrons of carbon aro-matic rings of graphene layers. These aroaro-matic rings are mainly formed by nitrogenation at high-temperature treatments. The combination of nitrogenous functionalities with carbon aromaticity indeed facilitates the above-mentioned application (Barton et al., 1997; Pérez-Cadenas et al., 2003; Przepiórski et al., 2004). As an example, carbonaceous materials en-riched with nitrogen containing functional groups were vastly used in CO2capture (Arenillas et al.,2005;Drage et al.,2007;Gray et al.,2004;Maroto-Valer et al.,2005). The adsorption
(a)
(b)
N O N H2 C N N H3 C CH3 N H N N H H N H N O O + N − O H O N C O N H2 (I) (II) (III) (IV) (V) (VI) (VII) (VIII) (IX) (X) (XI) (XII) C O O C O CH3 O OH O C O C O O C OH O O H O (i) (ii) (iii) (iv) (v) (vi) (vii) (viii)Fig. III Surface functional groups: (a) nitrogen containing groups: (I) pyridone, (II)
pyridine-N-oxide, (III) nitro, (IV) pyrrole, (V) primary amine, (VI) quaternary nitrogen, (VII) secondary amine, (VIII) tertiary amine, (IX) pyridine, (X) imine, (XI) nitroso, (XII) amide; (b) oxygen containing groups: (i) phenol, (ii) carboxyl, (iii) lactone, (iv) lactol, (v) chromene, (vi) pyrone, (vii) ketone, (viii) ether, (Redrawn from (Shafeeyan et al.,2010)).
mechanism is mainly explained by the interaction of nitrogenous functionalities and/or the π-electrons as weak Lewis bases with CO2 as weak Lewis acid. For example, Pevida et al. (2008) treated a commercial activated carbon with ammonia. Results of TPD equipped with FTIR analyzer, as well as XPS analysis, demonstrated that the treatment at temperatures higher than 600 °C incorporates nitrogen mainly into aromatic rings such as pyridinic and pyrrole functionalities (moieties IV, IV, or IV presented in Fig. III (a)). Lower temperature results in the formation of labile nitrogen bonds such as amide-like functionalities where ni-trogen is not a part of the ring (moieties VIII or XII shown in Fig. III (a)). As a conclusion, they mentioned that CO2 capture capacity is not directly associated with the total nitrogen content, but with specific nitrogen containing functionalities in particular pyridine, increasing the physical interaction between CO2 and adsorbent.
Oxidation is defined as introducing oxygen-containing functional groups, normally performed at mild temperatures. These groups are categorized into acidic types including phenolic, carboxylic, and lactonic/lactolic groups, as well as basic groups such as chromenes, pyrones, ketones, and ethers, as illustrated inFig. III (b). Comparing with nitrogen containing groups, the above-mentioned basic oxygenated functionalities are not considered as the primary source of surface basicity. Salame and Bandosz (2003) mentioned that oxidation reduces the aro-maticity of carbon by lowering the density of π-electron density in the graphene layers, thereby
decreasing surface basicity. Different oxidizing agents such as HNO3, H2O2, and air have been used by researchers. However, the cost, availability, and simplicity of use of an agent are im-portant. For example, ozone is much more expansive than air. It is also decomposed at a temperature higher than 150 °C, limiting its use (Gómez-Serrano et al.,2002). Depending on the agent type, oxidation conditions, and the nature of carbonaceous materials, various types of oxygen containing surface functionalities could be introduced on the surface of carbon. For instance, Álvarez et al.(2005) reported that ozone oxidation at 25 °C mainly resulted in car-boxylic groups, while a combination of all acidic oxygenated functionalities were introduced at 100 °C. There are some evidences that oxygenated functionalities could react together un-der some conditions, resulting in carbon surface with an certain type of the groups (Boehm, 1994). For instance, adjacent carboxyl groups may give carboxylic anhydrides. Carbonyl groups close to hydroxyl or carboxyl groups may form lactones or lactols. Julien et al.(1998) reported that hot nitric acid oxidation of an activated carbon with mainly basic oxygenated functionalities, results in the conversion of chromene or pyrone groups into the acidic ones via heterocycle opening mechanism. Aburub and Wurster (2006) performed oxidation of an activated carbon using sodium borohydride, and reported that this chemical reduces ketones to phenol groups.
Materials characterization is still a challenging part to increase our understanding of surface functionalization. In the investigation of carbonaceous materials, there is a simple and inex-pensive method in the quantification of oxygen containing functionalities. This method based on acidimetric titration has been invented by the German chemist Hanns-Peter Boehm. The theory behind Boehm titration is based on the difference in the acidic strength of oxygenated groups (carboxylic>lactonic>phenolic) (Shafeeyan et al.,2010;Boehm,1994). As a compari-son, the results of nitrogenation could only be verified using sophisticated methods of charac-terization such as electrokinetic measurements, TPD, FTIR, and XPS analyses (Stein et al., 2009;Boehm,2002). For acidic oxygen containing functional groups with certain concentra-tions, they are simply quantified by Boehm titration, using bases with different strengths (Ren et al.,2019). The experimental procedure of Boehm titration is fully explained Section 2.4.1 of Chapter 2.
IV
Biochar applications
Considering nitrogenation as an approach to increase surface basicity, oxidation significantly improves ion-exchange capacity of biochar via formation of acidic functional groups. A strong affinity of the oxygen containing functional groups for the adsorption of ions in aqueous solutions (cations and anions), leads to a vast application of biochar as adsorbent. This approach can also be implemented in the preparation of carbon supported catalysts. In this thesis, two biochar applications are experimentally investigated, first the remediation of wastewater from lead cations, and second the preparation of Ru catalyst supported on
Fig. IV Conceptual model representing the mechanisms of cations sorption (Adapted from (Sizmur et al.), copyright2017by Elsevier).
biochar. The following sections are thus presented to briefly provide a literature review. IV.1 Biochar as cation adsorbent
Rapid industrialization has led to great environmental concerns about releasing inorganic con-tamination into human and aquatic life. These concon-tamination consist of heavy metals in the form of cations such as Pb2+, Cu2+, Cd2+, Hg2+, and Ni2+. The toxins are often disposed by waste disposal from mining, smelting, sewage treatment, the manufacturing of batteries, pig-ments and dyes, electronics, and alloys. Biochar is known as a primary adsorbent for cations remediation, owing to its porous structure and numerous oxygenated functionalities (Oliveira et al.,2017).
As shown inFig. IV, cation adsorption is the result of three mechanisms (Sizmur et al.,2017): (I) stoichiometric cation-exchange, (II) electrostatic interaction, and (III) surface
precipita-tion. In mechanism (I), oxygenated functional groups such as carboxylic release their protons and adsorb cations. Since this mechanism is stoichiometric, adsorption is pH-dependent and thus controlled by the pH of aqueous solutions. Adsorption mechanism (II) occurs by cation-π interactions, where cations with positive charges attach to the delocalized electrons associated with aromatic rings. Biochars with a high mineral ash content adsorb cations via the third mechanism where cations react with minerals by precipitation. Mechanisms (II) and (III) are independent of the pH of solution.
Pyrolysis conditions of biochar production have serious impacts on its physicochemical prop-erties, thereby affecting the adsorption capacity. Several researchers have found that ad-sorption via ion-exchange in aqueous solution is the dominant mechanism of heavy metal remediation, where cations interact with biochar acidic functional groups (e.g., R COOH and R OH) (Uchimiya, Klasson, Wartelle and Lima, 2011; Uchimiya, Chang and Klasson, 2011;Lu et al.,2012). Leng and Huang (2018) and Ahmad et al. (2012) have demonstrated that biochar produced at low pyrolysis temperature (< 500 °C) has higher content of oxy-gen containing functional groups, thereby facilitating the adsorption of cations. Ding et al. (2014) reported that increasing pyrolysis temperature of a bagasse reduced the concentration of oxygenated functionalities. As a result, they achieved a lower lead (Pb2+) adsorption ca-pacity, using a pyrolyzed biochar produced at high temperature. Wang et al.(2015) observed that ion-exchange is the main mechanism in Pb2+cations adsorption for a biochar pyrolyzed at a temperature lower than 500 °C. Yuan et al. (2011) have reported that raising pyrolysis temperature increases the aromaticity of biochar in terms of C C moieties, as well as its min-erals content in the form of inorganic carbonates. In this regard, Wang et al.(2015) showed for high-temperature biochars (T > 500 °C), Pb2+ adsorption via ion-exchange is reduced. Instead, the cations are more extracted via precipitation with minerals, and less by Pb2+–π interaction. Zhou et al. (2016) have found that in the adsorption of Cr6+ from aqueous so-lutions, the cations adsorption is governed by cation-exchange with carboxyl and hydroxyl groups for lower-temperature pyrolyzed biochar, while aromatic structure controls the process conducted with biochar pyrolyzed at higher-temperature. However, in all above-mentioned cases, total adsorption capacity of biochar was reduced by increasing pyrolysis temperature. On the contrary, some works have reported that biochar capacity toward cations adsorption increases upon pyrolysis temperature. For instance, Chen et al. (2014) have reported that pyrolysis temperature indeed decreased the yield and the concentrations of oxygen containing surface functional group a biochar, but increased its ash content and surface porosity. The highest Cd2+ adsorption capacity was found if pyrolysis is performed at 900 °C. Zhou et al. (2018) associated this contradiction to the type of cations, targeted for adsorption using a cer-tain biochar. They evaluated the effect of pyrolysis temperature and time on the adsorption of three cations including Cu2+, Pb2+, and Cd2+, using a biochar produced from tobacco stems. The highest adsorption capacity of copper was found if the biomass is pyrolyzed at 400 °C for 2 h. They explained that oxygenated functionalities are responsible for Cu2+adsorption,
which have the highest concentration under the above-mentioned pyrolysis conditions. The best biochar performance in the adsorption of lead cations was obtained using a biochar py-rolyzed at 700 °C for 2 h. They postulated that the primary mechanism in lead adsorption is precipitation with minerals. Increasing pyrolysis temperature forms mineral carbonates, thereby improving for Pb2+adsorption. In addition, under these conditions, the biochar still has some recalcitrant oxygenated functionalities (e.g., R C OH), which contribute to the adsorption. In the case of Cd2+ cations, the best adsorption performance was observed for the biomass pyrolyzed at 700 °C for 4 to 6 h. These conditions produce a biochar with low oxygenated functionalities, low polarity, and low minerals content, but with high aromaticity, which are more favorable in the adsorption of the cations, governed by the interaction between cations and π electrons of aromatic rings.
IV.2 Biochar as catalyst supports
IV.2.1 Catalyst preparation
Catalytic activity closely depends on the carbon support preparation. Exponential increase in the number of scientific papers is an effort to transform the art of catalyst preparation into a science. The aims of these investigations are to improve activity, selectivity, and stability of catalysts in targeted reactions. This thesis is focused on hydrodeoxygenation of aldehydes. Hydrogenation is usually performed via heterogeneous catalysis, using supported catalysts. Different materials have been used as catalysts support, such as TiO2, γ-Al2O3, hydrotalcite, mesoporous silica, and carbonaceous materials. The latter have interesting properties and advantages as follows: inertness, hardness and mechanical strength, stability under reaction conditions, porosity and surface area, and oxygenated functionalities (Mehrabadi et al.,2017). Having all above-mentioned benefits, biochar with low cost, is produced as byproduct of fast pyrolysis. Impregnation is the usual method in the preparation of noble metals (e.g., ruthe-nium, palladium, and platinum) catalysts supported on carbon. Many researchers, however, have suggested catalyst preparation via adsorption (Jiao and Regalbuto,2008b,a; Toupance et al.,2000,2002). In the following sections, the concepts of impregnation and adsorption are briefly explained, then compared.
IV.2.1.1 Impregnation
Impregnation followed by drying is a frequently used method in catalysts preparation, owing to its simplicity. The first step is contacting a support with a volume of precursor solution pre-pared using inorganic or organic metal salts (e.g. metal nitrates and metal acetylacetonates) dissolved in water or an organic solvent (such as acetone). The solution is prepared with concentrations below metal supersaturation, to prevent premature deposition of the metal precursor in bulk solution. The impregnated support is then washed with solvent and dried. The washing step is sometime ignored when higher loading are required, thus all precursor ends up on the support. Impregnation is classified into wet (WI) and pore volume
impregna-Fig. V Mechanism of catalysts preparation via adsorption (Adapted from (Mironenko et al.), copyright 2015by Elsevier).
tion (PVI) (Munnik et al.,2015). In the former, an excess amount of solution is used, while a certain solution volume equal to pore volume of the support is used in the latter, which is mostly known as incipient wetness impregnation (IWI).
IV.2.1.2 Adsorption
Adsorption from aqueous solutions is based on ion-exchange (IE), mainly performed using an excess volume of aqueous solution when low metal loading is targeted (Munnik et al., 2015). According to the literature, several names have been used for catalysts synthesis via adsorption method, namely strong electrostatic adsorption (SEA) (Cho and Regalbuto,2015), ion adsorption (IA) or exchange (IE) (Genna et al.,2013), and equilibrium deposition filtration (EDF) (Kady et al., 2010), nevertheless, all have the same general fundamentals (Bourikas et al.,2006). As depicted inFig. V, the pH of the solution containing metal precursors needs to be different from the pHpzc of carbon support (Jiao and Regalbuto,2008b). For anionic form of precursors (e.g., Na2[PdCl4] in water results in [PdCl4]2–) solution pH needs to be lower than pHpzc, thereby providing interactions between the anions and protonated carboxyl group ( CO OH2+). For cationic form of precursors (e.g., [Pt(NH3)4]Cl2in water results in [Pt(NH3)4]2+), adsorption should be conducted at a pH higher than pHpzc, thereby providing interactions between the cations and deprotonated carboxyl group ( CO O–).
IV.2.1.3 A brief comparison between the methods
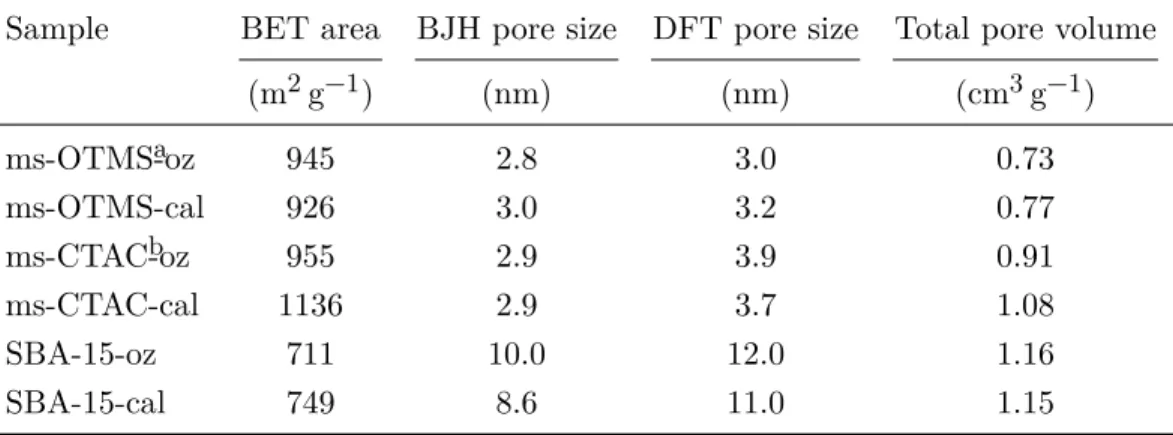
The type of pores and their volume are crucial properties for catalysts preparation via im-pregnation method. Adsorption, on the other hand, relies on ion-exchange, thus requires surface functionalities. Based on a brief literature review, mesoporous supports have been largely used in catalysts preparation using incipient wetness impregnation (IWI). However, researchers are confronted with some complexity and difficulties in the preparation of carbon-based mesoporous supports. Ryoo et al.(1999) was the first to synthesize ordered mesoporous carbons (OMCs). Seo et al. (2015) listed the following steps in the preparation of OMCs. The first step is the impregnation of a mesoporous silica template with an organic compound. In the next step, the impregnated silica is heated at a very mild temperature, e.g., 100 °C,
with the aim of polymerizing the organic compound within the mesopores. Joo et al. (2001) reported that furfuryl alcohol is one of the most convenient organic compounds that can be easily impregnated into silica mesopores. This compound can form cross-linked solid poly-mers. Carbonization of the polymer is obtained by pyrolysis at high temperature, e.g. 900 °C. The key in this step is to control the carbonization process to occur inside the template meso-pores. The silica template can be removed after carbonization with hydrofluoric acid or a sodium hydroxide solution. A successful synthesis of hard template carbonaceous materials thus depends on the details of the above-mentioned protocol. Fuertes and Álvarez-García (2004) synthesized SBA-15 silica using a mixture of tetraethyl orthosilicate (TEOS), Pluronic P123, HCL, and H2O with mole ratio of 1, 0.017, 5.7, and 193, respectively. The mixture was agitated for 24 h, and calcined at 600 °C for 4 h. The silica was then filled with a solution consisting of 85 wt.% polyvinyl chloride and 15 wt.% 1-methyl-2-pyrrolidinone, using IWI, and then carbonized at 800 °C for 1 h under nitrogen. This process was repeated for several times, and the final carbonized sample was immersed in HF 48 wt.% for 15 h to remove silica template, followed by washing with distilled water and drying. The obtained mesoporous carbon has a specific surface area of 930 m2g−1, pore size distribution in range of 3 to 7 nm, and pore volume of 1.1 cm3g−1. Reporting higher metal dispersion and necessarily smaller particle size, some researchers have suggested using adsorption instead of the impregnation. For instance, Zhang et al. (2014) synthesized 2 wt.% Pd supported on CNTs with a SBET of 250 m2g−1 and 1.5 mmol g−1 of total acidic surface functional groups. They reported values of 19 and 43% for Pd dispersion using IWI and IE, respectively. Jiao and Regalbuto(2008b) reported TEM analysis average particle size of Ru supported on SiO2 (catalyst loading of 3 wt.%), equal to 4.7 and 2.1 nm respectively for IWI and IE methods, using Ru(NH3)6Cl2 precursor.
IV.2.2 Catalytic hydrodeoxygenation of furfural
Among the variety of aldehydes, furfural has been found as one of ‘Top 10’ bio-based key chemical (Bozell and Petersen, 2010). The concentration of furfural in bio-oil depends on the type of biomass and pyrolysis conditions. For instance, Lyu et al. (2015) reported that pine pyrolysis bio-oil obtained at 550 °C contains 0.5 wt.% of furfural. Chen et al. (2017) implemented fast pyrolysis of cellulose at 550 °C with feedstock residence time of 10 s over GaN catalyst (catalyst/biomass mass ratio of 2), resulting in furfural yield of 29 wt.%. Using FeCl3 and acetic acid in co-catalyzed hydrolysis, Mao et al.(2012) reported furfural yield of 68 wt.% from corncob.
Furfuryl alcohol has been reported as the common product of furfural hydrogenation, which is implemented in resins, adhesives, and plastics manufacturing, as well as pharmaceutical and agricultural activities (Nakagawa et al., 2013). As reviewed by Mamman et al. (2008), about 60% of total 200 000 t furfural in 2008 has been converted to furfuryl alcohol.