Users’ groups Interpreted Through the Lens of the Users’ Needs
and Motivation
Isabelle WALSH* and Mireille GETTLER SUMMA**
*Associate Professor, Ecole de Management de Strasbourg. Université de Strasbourg. CESAG (EA1347).
**Associate Professor, Centre de Mathématiques de la Décision, Université Paris-Dauphine, CNRS, CEREMADE (UMR 7088).
___________________________________________________________________________
ABSTRACT
___________________________________________________________________________ This article proposes a users’ typology grounded in the users’ needs and motivation. We apply cluster analysis, a multivariate technique seldom applied in IS research, to the data obtained from a purposely diversified population of 247 respondents. The three-stage research design is carefully laid out and justified: different procedures are detailed and applied in order to limit possible bias and maximize the stability and reproducibility of the resulting IT-users’ typology. Through this validation-oriented design, the proposed typology is inferred from our quantitative results which confirm and refine a users’ taxonomy previously brought to light through qualitative methods. Our results open the way to the investigation of a new second order formative construct which may be an antecedent of two well established constructs in IS research: perceived usefulness and perceived ease of use. They also lead to corporate applications involving the customization of IT-training depending on users’ profiles in order to facilitate new IT implementation.
Keywords: Cluster Analysis, Users’ Needs, Users’ Motivation, Users’ Typology. RESUME
___________________________________________________________________________ Cet article propose une typologie d’utilisateurs ancrée dans les besoins et motivations des utilisateurs. Nous appliquons des méthodes d’analyse de nuages statistiques à des données issues d’une population volontairement diversifiée de 247 participants. Ces méthodes d’analyse multivariée restent peu mobilisées en recherche en SI, L’architecture de recherche en trois étapes est détaillée et appliquée afin d’éliminer des biais possibles et afin de maximiser la stabilité et reproductibilité de la typologie en résultant. Au travers de cette architecture axée sur la validation des résultats, la typologie proposée est inférée de nos résultats quantitatifs qui confirment et affinent une taxonomie d’utilisateurs précédemment mise en exergue au travers de méthodes qualitatives. Les résultats obtenus ouvrent la voie à l’étude d’un nouveau construit formatif de second ordre qui pourrait être un antécédent de deux des construits les plus établis en SI : l’utilité perçue et la facilité d’utilisation perçue. Ils mènent également à des applications pratiques impliquant l’adaptation des formations proposées en entreprise aux profils des utilisateurs, afin de faciliter l’implémentation de nouvelles technologies.
Mots clés : Analyse de nuages et méthodes de classification statistiques, Besoins, Motivation,
1. Introduction
The present article proposes a users’ typology grounded in the users’ needs and motivation. Though the concept of needs can be found implicitly or explicitly in most works in IS research, needs theory (Alderfer, 1969, Herzberg, Mausner and Snyderman, 1959; Mc Clelland, 1965; Maslow, 1943, 1957; Winter, 1996; etc.) is seldom explicitly called upon. This theory relies on the fact that when a need is not satisfied, the individual will act in such a way that he/she will be able to satisfy that need. Needs are thus seen as an internal force which guides behaviors (Maslow, 1954). Au, Ngai and Cheng (2008) show that IS end users have different needs; they also show that the fulfilment of these needs is an antecedent to the users’ satisfaction which is critical to successful IS implementation.
Most need theorists also call upon the concept of motivation (e.g. Maslow whose ambition in his work on needs was to formulate a “positive theory of motivation”: Maslow, 1954), and motivated behaviors have been shown to fulfill needs of competence, autonomy and relatedness (Ryan and Deci, 2000). Motivation is a psychological process which results from the interaction between an individual (hence his/her needs) and his/her environment (Latham and Pinder, 2005). As a concept it has been defined as “the hypothetical construct used to describe the internal and/or external forces that produce the initiation, direction, intensity, and persistence of behavior (Vallerand and Thill, 1993). Concretely, motivation concerns the active directing of behavior towards some preferential categories of situations or objects1 (Nuttin, 1980). Self-determination theory (Deci and Ryan) shows that, as long as people’s needs are satisfied through some activities, they will be motivated to engage in these activities without external prodding and through their own choosing. Motivation theory was applied in IS to attempt to understand IT-adoption and usages (Davis, Bagozzi and Warshaw, 1992; Venkatesh and Speier, 1999). However motivation theory has considerably evolved in the last two decades and all dimensions of motivation, as brought to light in the recent socio-psychological literature, do not appear to have been exploited in IS-research.
A qualitative study, preliminary to the present article (Walsh and Kefi, 2008; Walsh, Kefi and Baskerville, being reviewed) was conducted. The results of this study show that users’ profiles appear differentiated by the users’ varying needs and motivation. The present article is a follow-up study; its primary objective is to investigate empirically and through quantitative methods the users’ groups, if any, which reveal themselves through the users’ needs and motivation. The secondary objective of this article is the comparison of the results obtained through quantitative methods with those obtained through qualitative methods. Hence the research question addressed in the present study is: can we propose a users’ typology grounded in the users’ needs and motivation?
As grounding for our work, we first present some IT users’ typologies previously proposed in the literature. We then use scales specifically designed for our purpose and we apply a three-stage cluster analysis to the data obtained from a purposely diversified population involving 247 participants. We discuss our results and compare them with previously obtained qualitative results. Finally, we investigate the limitations of our work and its possible corporate applications as well as possible future venues for research, before concluding.
1. IT-users’ investigated typologies
The typological effort is omnipresent in the literature and the related works adopt very different levels of analysis and methodologies. The review of previous typologies does not pretend to be exhaustive; we focused on typologies that could appear as built upon some of
1 « Concrètement, la motivation concerne la direction active du comportement vers certaines catégories
the users’ needs and motivations, as this theoretical lens has been little used in the existing literature. Though extremely useful and providing some grounding for our own work, these typologies do not fill the gap in the study of users’ profiles through the lens of needs and motivations.
Roger’s (1962, 1995, 2003) typology proposes five users ‘profiles (innovators, early adopters, early majority, late majority and laggards) differentiated by their innovativeness expressed through their delay in the adoption of innovations. It could be argued that Rogers’ typology implicitly takes into consideration and studies users’ needs and motivation expressed through this delay of adoption. However, and though valuable for rupture innovations, Rogers’ innovation approach might prove insufficiently refined to identify all IT users’ profiles for incremental innovations (i.e. innovations which are built upon and in the continuity of preceding innovations) perceived by users as mandatory tools in day-to-day life.
Jouët’s (1987) typology brings to light extremely well the quest for social identity through IT usage, but she only implicitly approaches the users’ fundamental needs at the source of this quest. Furthermore IT have evolved at a fast rate. Therefore users’ profiles brought to light by Jouët (rational, programmer, and messenger) might not be adapted to today’s IT and might have neglected new emerging users’ profiles.
Lawless and Price (1992) propose a dichotomous differentiation between users; they concentrate mainly on those users they name “technological champions” who are proposed as agents for other users; however, to be an adequate transmission vector of a third party’s requirements, we argue that it is quite essential to have the same needs; this does not appear to be the case in this instance.
Boullier’s (1997) typology chooses Chinese portraits to synthesize IT-usages (brown bear, dolphin, beaver and seagull). This typology is tied to a very specific IT (mobile technology) and a specific population (high mobility profiles) with very specific, mobility induced, needs. Agarwal and Prasad’s (1998) typology is limited to a population of highly educated profiles (MBA professional students) and takes an innovation approach. It measures Personal Innovativeness in IT (PIIT) i.e. the willingness to try out any new technology and conscious intended use, hence only conscious needs.
Kellman’s (1958) work brings the categorization “conforms, identifies and internalizes” close to the self determination continuum proposed by Ryan and Deci (2000) and Gagné and Deci (2005) ranging from extrinsic to intrinsic motivation. However Malhotra and Galetta (1999), when applying this framework, use it to complete the TAM (Technology Acceptance Model: Davis 1986); they do not attempt to identify users’ groups. We argue that users’ groups need identification within the boundaries of the IT domain in order to help IS design.
Prensky’s (2001) typology (digital natives and digital immigrants) takes only the demographic variable “age”, and resulting needs/motivation, into consideration; though needs and motivation clearly evolve with age, they do not appear to rely only on this variable.
Finally, Raz and Goldberg’s (2006) typology (tayloristic, expert and innovator) results in fairly low R² (explained variance); this can be explained by the fact that these authors only take into consideration expected usage within corporate settings, hence expected needs; for their analysis, these authors rely exclusively on users’ occupations and organizational stereotypes resulting from users’ hierarchical positions within the organizations. They therefore only take into consideration the users’ organizational needs and motivation due to their positions in firms; they also use an innovation approach.
All typologies that were investigated involve specific technologies and/or specific populations of users; hence they do not take into consideration all possible IT users. We argue that settings and populations should be aimed at being as diversified as possible so as to take into account as many users’ profiles as possible. Some of the investigated typologies also adopt a diffusion of innovation approach but many IT have today reached the status of ordinary objects blended
in social practices (Jouët, 2000). In corporate settings, IT implementations are nowadays often considered change management issues rather than adoption of innovation issues. We therefore also argue that an innovation approach for studying users’ profiles might have become, at least in some instances, redundant.
In the present article we propose to develop a users’ typology grounded in users’ fundamental needs, IT-needs and IT-motivation. Our typology takes into consideration all known dimensions of the construct of motivation. It is brought to light in a population as diversified as possible and does not use an innovation approach.
2. Methodology
In this section we detail the various methods applied and our research design. 2-1. Sampling
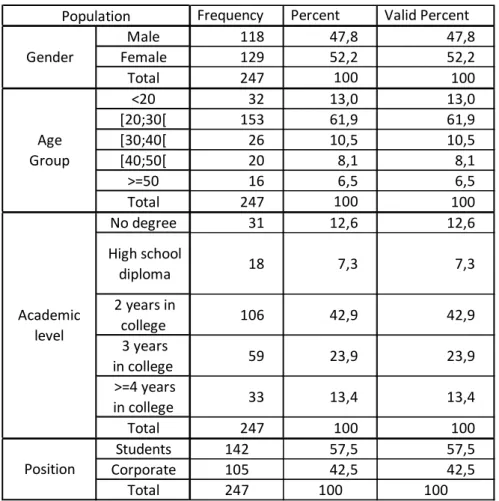
Table 1: Demographic statistics
The population of 247 respondents included inhabitants of low rent dwellings, university and business school students (including a group of 18 Chinese students on an exchange program), business school and university administrative staff, members and staff of a sports center, various professionals from diverse organizations taking courses in a business school.
As it is common in cluster analysis we had no census of the population to use, no statistical reference (Hair et al, 2006). However, as we wanted to include and study as many users’ profiles as possible, our main concern was to diversify the studied population as much as possible in terms of all socio-demographic variables (see Table 1: details of investigated population). Therefore the sampling method we used is not a standard one such as, for
Frequency Percent Valid Percent
Male 118 47,8 47,8 Female 129 52,2 52,2 Total 247 100 100 <20 32 13,0 13,0 [20;30[ 153 61,9 61,9 [30;40[ 26 10,5 10,5 [40;50[ 20 8,1 8,1 >=50 16 6,5 6,5 Total 247 100 100 No degree 31 12,6 12,6 High school diploma 18 7,3 7,3 2 years in college 106 42,9 42,9 3 years in college 59 23,9 23,9 >=4 years in college 33 13,4 13,4 Total 247 100 100 Students 142 57,5 57,5 Corporate 105 42,5 42,5 Total 247 100 100 Population Age Group Academic level Position Gender
example, randomized sampling. It is closer to a ‘strata’ (students versus corporate) and ‘quota’ (gender, age, academic level) approach. Our sampling design being aimed at maximum diversification, this diversification design was even applied within the ‘strata’: in the corporate population, diversified hierarchical levels were included (top management, middle management, employees) as well as occupations (accountancy, engineering, teachers, etc.); active and unemployed / retired people were also included; in the student population, foreign students were included.
2-2. Instrument used to assess users’ needs and motivations
No valid and reliable scales within the IS field were identified to measure the constructs under scrutiny. Scales currently being developed in the field of social psychology were studied and specific scales were developed (Walsh, 2009).These scales were designed to assess the users’ fundamental needs satisfied through IT usage, perceived IT needs and IT motivation. The various constructs involved in these scales are:
- Extrinsic motivation to use IT through identified regulation (EXTMOTID): Through self-determined choice, one uses IT because one knows it is important for oneself in order to achieve other purposes considered important for the self; IT-usage(s) is (are) congruent with one’s goals and values.
- Extrinsic motivation to use IT through external regulation (EXTMOTEXT): One knows that one has to/ is compelled to use IT by one’s boss/ teachers, family, entourage. Usage(s) is (are) not performed through one’s free will. Usage(s) is/are not self-determined.
- Power need satisfied through IT-usage(s) (POWNEE): need to have prestige, to influence other people’s actions and well-being through one’s knowledge and mastery of IT.
- Accomplishment need satisfied through IT usage(s) (ACCNEE): need to overcome obstacles, to do what one is good at, is satisfied through the use of some IT.
- Primary need satisfied through IT usage(s) (PRIMNEE): need which is close to an addiction; passion for IT.
- Affiliation need satisfied through IT usage(s) (AFFNEE): need to socialize and to share with others through an IT medium.
- Intrinsic motivation to know IT (INTMOTKNO): IT-usage(s) is (are) motivated to surpass oneself and adequately master one’s IT-tools.
- IT-needs (ITNEE): perceived at three levels: situational (one perceives the need for specific IT in order to fulfill some given tasks), contextual (one perceives the need to use IT globally in some context(s) e.g. work, leisure, academic), global (one perceives the need for IT in all aspects of one’s everyday life. If compelled, one might do without it but with difficulty and discomfort).
Except for ITNEE which was assessed through a multi-choice item (1 to 4), all other constructs were assessed through 7 point Likert scales (1 to 7).
Using SPSS 17 software, what Straub, Boudreau and Gefen (2004) named “mandatory validities” (i.e. discriminant, convergent and factorial validities) of the scales used, administered to 247 respondents, were verified through principal components factor analysis (PCA) with varimax rotation with Kaiser Normalization.
2-3. Three-stage clustering research design
Applying the scales developed for our purpose, we collected data from 247 respondents. It was decided not to use e-questionnaires. If we were to attempt to capture the full array of possible IT-users profiles and also include those respondents who have no particular
perceived IT-needs or those who are not IT-motivated, we were compelled not to use e-questionnaires. Therefore all questionnaires were hand filled by the respondents and answers were hand computed. This eliminated a possible method bias.
From the 7 factors identified in the PCA, we created 7 new variables equal to the means of the main items in each factor with a standardized coefficient of 1 for each item. We then proceeded through cluster analysis of the available data. Cluster analysis is a statistical data analytic method viewed mainly as an exploratory technique (Hair and Black, 1998); this technique is commonly used in other fields (econometrics, psychology, biology, engineering, marketing, etc) but, to our knowledge, it is seldom used in IS research. Its main purpose is “to group [in clusters] objects based on the characteristics they possess” (Hair et al, 1995 page 423). High within-cluster homogeneity and between-cluster heterogeneity is aimed at. In its search for structure, cluster analysis could be compared to factor analysis but it groups objects/cases whereas factor analysis groups variables (Hair et al, 1995). It is an empirical and primarily inductive method (Gerard, 1957; Punj and Stewart, 1983). Although we had preliminary qualitative results available, our research was conducted in an exploratory mode and no hypothesis was laid down. Our purpose was to obtain a statistical clustering of cases in groups based on the users’ needs and motivations and investigate the resulting typology. The first group identified through our data was the group which included individuals who declared they had strictly no perceived IT- needs: ITNEE= 1, which we name dodgers 1. In our limited sample of 247 respondents, we only identified two of them. As the number of respondents identified in this group was too small to proceed with a proper analysis of the other variables, these two cases were removed from the subsequent cluster analyses. Even though we had taken the precaution not to use e-questionnaires to avoid discouraging dodgers, we faced several people during questionnaire administration, who simply refused to fill the questionnaires as soon as they knew it was to do with IT. A qualitative study (which would allow one-to-one, in-depth, personalized exchanges) centered only on these users would probably be extremely useful.
Therefore a total of 245 respondents with the categorical variable ITNEE at the values of 2 (situational perceived needs), 3 (contextual perceived needs) or 4 (global perceived IT-needs) were included in the subsequent analyses.
We used both hierarchical and non-hierarchical methods of clustering to obtain different information from each method (Hair, Anderson, Tatham and Black, 1995). The clustering research design and the various clustering procedures applied are described hereafter.
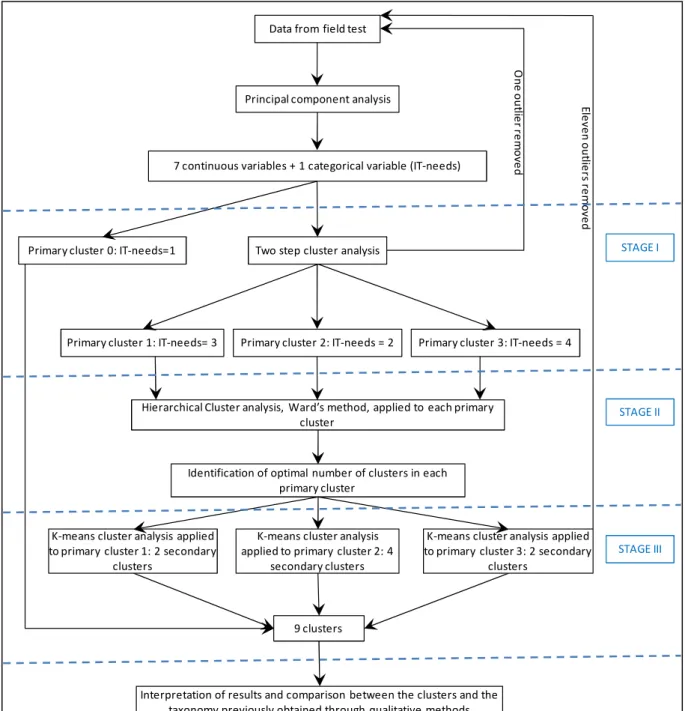
We were aware that cluster analysis procedures are not grounded on probabilistic statistics and that, consequently, several solutions could result from our analysis (Singh, 1990); and “arbitrarily selecting a single clustering method can result in structures that are method and sample specific, and cannot be replicated” (Loo, 2004: page 159). We therefore designed a three-stage approach to analyze our data (see figure 1). It must be underlined that the original number of respondents was 259. The data from 12 participants had to be deleted at subsequent stages of the research: two were deleted because information was incomplete and ten were deleted as they resulted in single element clusters or clusters containing two or three cases. Once these outliers were identified and the corresponding data deleted, the full research design was carried out again from the beginning.
Figure 1: Research design
As we had both categorical and continuous variables in our research design, we first applied two-step clustering which confirmed that the categorical variable “perceived IT-needs” (ITNEE) was of utmost importance in the clusters formation; this was consistent with our qualitative results and allowed us to identify three primary clusters, having taken away the data corresponding to the “no perceived IT-needs” respondents (which represented data from only two individuals and was deemed insufficient to conduct a proper analysis).
We then applied agglomerative hierarchical cluster analysis, Ward’s method, to each primary cluster identified through the two-step clustering procedure, in order to determine the optimal number of clusters in the final solutions. Finally we proceeded with k-means cluster analysis for each primary cluster, once the optimal number of sub-clusters in each primary cluster was known. E le v e n o u tli e rs r e m o v e d O n e o u tli e r r e m o v e d
Data from field test
Principal component analysis
7 continuous variables + 1 categorical variable (IT-needs)
Two step cluster analysis
Hierarchical Cluster analysis, Ward’s method, applied to each primary cluster
Identification of optimal number of clusters in each primary cluster
K-means cluster analysis applied to primary cluster 1: 2 secondary
clusters
Interpretation of results and comparison between the clusters and the taxonomy previously obtained through qualitative methods
Primary cluster 1: IT-needs= 3 Primary cluster 2: IT-needs = 2 Primary cluster 3: IT-needs = 4
K-means cluster analysis applied to primary cluster 3: 2 secondary
clusters K-means cluster analysis
applied to primary cluster 2: 4 secondary clusters
9 clusters
Primary cluster 0: IT-needs=1 STAGE I
STAGE II
3. Results
The results obtained through the three stages of the research design in the cluster analyses are detailed hereafter.
STAGE I: Two-step Cluster analysis
Using SPSS 17 software, we chose to proceed with two step clustering as we have a categorical variable (ITNEE, “perceived IT-needs” which appeared to be a determinant variable in the taxonomy brought to light in the preliminary qualitative part of the research) mixed with continuous variables (the seven variables derived from the PCA detailed in the first part of this article). The two-step cluster analysis algorithm proposed by the software includes both hierarchical and non-hierarchical clustering procedures. Log-likelihood criterion was used as we have a mixture of continuous and categorical variables. To eliminate a possible bias, we did not specify the number of clusters required, leaving the algorithm select the optimal number based on the Schwartz Bayesian Criterion (BIC: the algorithm used by the software includes an index which takes into account the statistical goodness of fit as well as the number of parameters that have to be estimated in order to achieve this degree of fit). We did not use the option (which was offered by the software) to create a separate cluster for cases that did not fit well into any other cluster as we had, a priori, eliminated outliers.
Three clusters which we name primary clusters, were identified by the software and followed the categorization given by the variable IT-needs. All individuals in primary cluster 1 have contextual perceived IT-needs; in primary cluster 2, all individuals have situational perceived IT-needs; finally in primary cluster 3, all individuals have global perceived IT-needs. The two-step clustering procedure thus indicated that the categorical variable ITNEE (IT-needs) is a determinant variable. The two-step clustering procedure showed that besides the categorical variable IT-needs, all variables except power needs satisfied through IT (POWNEE), were relevant in the differentiation of the cluster in the two-step analysis. We therefore did not include the variable POWNEE in the subsequent hierarchical and K-means analyses.
In order to obtain a sufficiently refined reading of users’ profiles, and to attempt to identify all users’ groups, we applied both hierarchical and k-means clustering to each of the three primary clusters identified through the two-step clustering procedure. We did not proceed immediately with k-means clustering as in this method the number of clusters has to be pre-determined. We therefore first went through a hierarchical clustering procedure in order to determine the optimal secondary clusters’ solution for each primary cluster.
STAGE II: Hierarchical cluster analysis
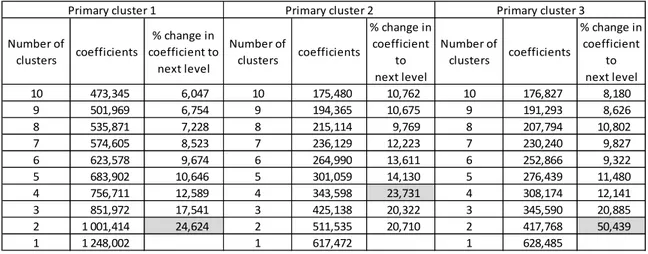
We first used a hierarchical agglomerative clustering method in order to establish the number of clusters which best fitted our data and to produce centroïd estimates2. Ward’s method was used as it is reliable3: it maximizes intercluster variance, it tends to produce clusters similar in size and it is less sensitive to outliers than other methods (Loo, 2004; Jobson, 1992). In this method, similarity between clusters is assessed through the sum of square distances within the clusters summed over all studied variables (Hair, Black, Babin, Anderson, and Tatham, 2006). In order to separate each primary cluster previously identified, we successively filtered cases through the primary clusters membership variable (which is automatically created by the software) and we proceeded to apply the hierarchical procedure to each of the three resulting sets of data. From the software we extracted the clustering agglomeration coefficients for each set of data resulting from the primary clusters (1, 2 and 3) previously identified and we
2 Cluster centroïds are the mean values of the observations on the seven variables in the cluster variate.
3 Loo (2004) cites studies which evaluate as many as 35 clustering methods and which show that Ward’s method
calculated the percentage change in the clustering coefficients for two to ten clusters solutions; we selected the cluster solutions for which the largest increases were observed (see table 2)
Table 2: Clustering agglomeration coefficients for each primary cluster
- For primary cluster 1, the largest increase in the clustering coefficients occurred between one and two clusters. We therefore selected the two cluster solution. - For primary cluster 2, the largest increase in the clustering coefficients occurred
between three and four clusters. We therefore selected the four cluster solution. - For primary cluster 3, the largest increase in the clustering coefficients occurred
between one and two clusters. We therefore selected the two cluster solution.
Once optimal solutions for each primary cluster were identified, hierarchical procedures were run again with the number of required clusters informed; resulting cluster membership was saved and centroïds for each cluster thus obtained were calculated through data aggregation procedure using a mean function and cluster membership as break variable. However, in hierarchical methods, some cases may be wrongly grouped at an early clustering stage and there is no procedure to reallocate them at a later stage. Therefore we proceeded through k-means clustering to refine our results.
STAGE III: K-means cluster analysis
K-means cluster analysis uses an iterative algorithm which allows shifting individuals from one cluster to another until convergence criteria are reached, thus minimizing within cluster distances and maximizing between cluster distances (Loo, 2004; Johnson and Wickern, 1982; Sireci, Robin and Patelis, 1999); after iterations are completed and convergence is reached, centroïds are calculated again. We wanted to minimize possible bias; thus this method could not be used prior to hierarchical analysis as the number of clusters has to be informed and cluster seed points (initial starting point for each cluster) have to be preferably specified to allow replication across samples.
We again filtered our data successively using primary cluster membership as break variable; we then performed K-means cluster analysis on the three resulting sets of data, for the optimal solutions/number of clusters which had been pre-determined through hierarchical clustering (stage II in research design described above); we used as seed points the provisional cluster centroïds also identified at stage II of our research design. We let the program iterate until convergence was reached (convergence criterion = 0) and final cluster centers were provided by the software.
Table 3: Final cluster centers
Number of clusters coefficients % change in coefficient to next level Number of clusters coefficients % change in coefficient to next level Number of clusters coefficients % change in coefficient to next level 10 473,345 6,047 10 175,480 10,762 10 176,827 8,180 9 501,969 6,754 9 194,365 10,675 9 191,293 8,626 8 535,871 7,228 8 215,114 9,769 8 207,794 10,802 7 574,605 8,523 7 236,129 12,223 7 230,240 9,827 6 623,578 9,674 6 264,990 13,611 6 252,866 9,322 5 683,902 10,646 5 301,059 14,130 5 276,439 11,480 4 756,711 12,589 4 343,598 23,731 4 308,174 12,141 3 851,972 17,541 3 425,138 20,322 3 345,590 20,885 2 1 001,414 24,624 2 511,535 20,710 2 417,768 50,439 1 1 248,002 1 617,472 1 628,485
The results of k-means procedure applied to the three primary clusters are summarized in table 3. Concerning the final clusters code numbers, the first digit indicates the primary cluster to which it belongs and the second digit indicates the sub-cluster number.
4. Discussion
In the qualitative preliminary phase of our research, a users’ taxonomy (Marradi, 1990) was brought to light: three attitudinal reference groups were first identified; these three attitudinal groups were then subdivided into nine archetypal users’ profiles sub-groups.
o The refusal group who perceives no IT-needs: this group includes users we named dodgers who refuse anything to do with IT. Use of IT is avoided as this group has no perceived need for IT and is indifferent to IT.
o The pro-active group: in corporate settings this group is perceived by project managers as a facilitating influence in the adoption process. If they are allowed to do so, these users voluntarily involve themselves in new corporate IT projects from the pre-implementation stage when business requirements are being studied; they also often participate in the choice of specific software and in subsequent software adaptation to other users’ specific needs. This group includes four archetypal profiles: passionate, interested, dangerous and studious. All users of this attitudinal group appear to have global perceived IT-needs and some intrinsic motivation but of different kinds; however they satisfy different fundamental needs through IT-usage: interested users only satisfy their affiliation needs through IT usage; dangerous users also fulfill their power needs whereas studious users also satisfy self-accomplishment needs; passionate users, who enjoy using IT and also fulfill primary needs through IT, appear to be either studious or dangerous or interested.
o The passive group: users in this group only intervene in an IT-project when they are confronted with mandatory use of IT. In order to primarily fulfill their affiliation needs and to conform to their reference groups, users belonging to this group will use new IT-tools that they are compelled to use and will apply what they have been taught; they will not, however, try and go beyond this prescribed IT-usage unless they have an urgent concrete need to do so to fulfill their mandatory tasks. This group includes four archetypal profiles: disciplined, frightened, disenchanted, constrained. The motivation of the members of this group is extrinsic and their perceived IT-needs are either contextual (for the first two sub-groups) or situational (for the last two sub-groups).
We identified the clusters brought forward with quantitative methods through their centroïd (table 3). We then proceeded to compare the results obtained through cluster analysis to the taxonomy previously brought to light through qualitative methods.
We semantically interpreted quantitative results in terms of the knowledge we had acquired through the preliminary qualitative investigation. In the interpretation of our quantitative results, we paid particular attention to 4 as a mark up level: as all original variables (except IT-needs) were estimated through a Likert scale from 1 to 7, 4 was the middle position of the answering scales and clearly defined as “approximately true”. To give some examples: a
Final Clusters 1_1 1_2 2_1 2_2 2_3 2_4 3_1 3_2 EXTMOTEXT 1,50 2,21 1,64 4,27 1,71 1,72 1,23 1,65 EXTMOTID 4,98 4,64 5,31 4,83 2,34 3,40 6,28 5,07 ACCNEE 4,68 3,81 4,72 3,02 3,33 2,53 5,78 3,39 PRIMNEE 5,71 3,18 3,88 3,40 1,88 5,25 5,69 3,81 AFFNEE 6,07 5,35 4,54 5,00 3,88 6,17 6,43 5,80 INTMOTKNO 5,57 4,66 5,79 3,77 4,13 5,04 6,14 4,69 Number of cases 55 71 17 14 8 8 40 32 % of total participants 22 29 7 6 3 3 16 13
Number of cases with POWNEE > 4 8 12 3 3 0 0 15 1
Final Cluster Centers
passionate user would be inferred by a score on the PRIMNEE variable greater than 4. A constrained user who only uses IT through obligation and constraint would have a score greater than 4 on the EXTMOTEXT variable.
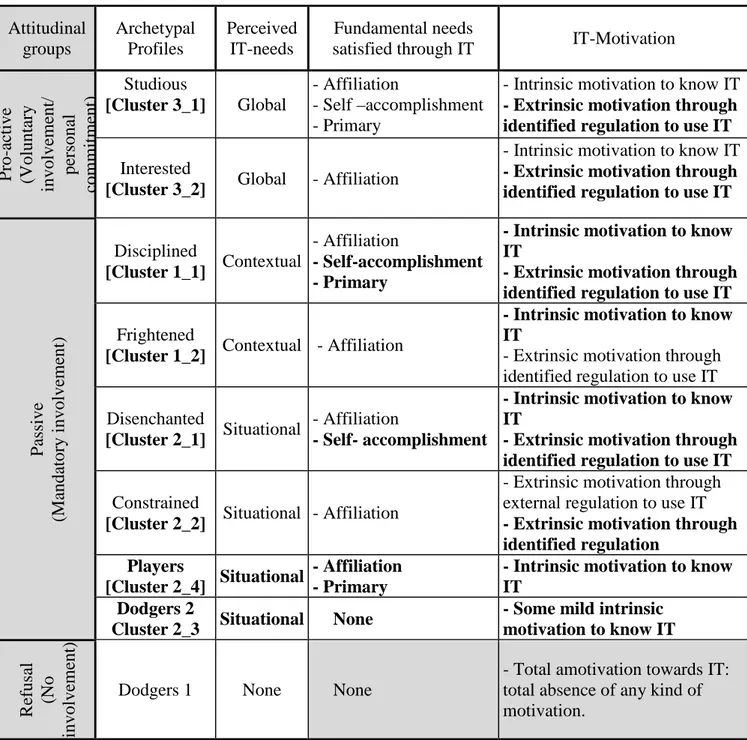
Table 5: Comparison between cluster analysis results and qualitative taxonomy4
Attitudinal groups Archetypal Profiles Perceived IT-needs Fundamental needs
satisfied through IT IT-Motivation
P ro -a ct iv e (V o lu n ta ry in v o lv em en t/ p er so n al co m m it m en t) Studious [Cluster 3_1] Global - Affiliation - Self –accomplishment - Primary
- Intrinsic motivation to know IT
- Extrinsic motivation through identified regulation to use IT
Interested
[Cluster 3_2] Global - Affiliation
- Intrinsic motivation to know IT
- Extrinsic motivation through identified regulation to use IT
P as si v e (M an d at o ry i n v o lv em en t) Disciplined [Cluster 1_1] Contextual - Affiliation - Self-accomplishment - Primary
- Intrinsic motivation to know IT
- Extrinsic motivation through identified regulation to use IT
Frightened
[Cluster 1_2] Contextual - Affiliation
- Intrinsic motivation to know IT
- Extrinsic motivation through identified regulation to use IT Disenchanted
[Cluster 2_1] Situational
- Affiliation
- Self- accomplishment
- Intrinsic motivation to know IT
- Extrinsic motivation through identified regulation to use IT
Constrained
[Cluster 2_2] Situational - Affiliation
- Extrinsic motivation through external regulation to use IT
- Extrinsic motivation through identified regulation
Players
[Cluster 2_4] Situational
- Affiliation - Primary
- Intrinsic motivation to know IT
Dodgers 2
Cluster 2_3 Situational None
- Some mild intrinsic motivation to know IT R ef u sa l (N o in v o lv em en t)
Dodgers 1 None None
- Total amotivation towards IT: total absence of any kind of motivation.
Attitudinal groups were not investigated in the present research. A typology (Marradi, 1990) of nine users’ groups is identified. Two new groups were brought to light and two groups which had been identified in the qualitative part of the research had to be amended and refined.
4 In this table, elements to be further investigated have grey background, new elements resulting from
quantitative results, are written in bold type; the remaining elements were found in the qualitative part of the research and confirmed through cluster analysis.
Through quantitative methods, two extra groups were found with situational perceived IT-needs: a second group of dodgers (which we name Dodgers 2) was identified; contrary to Dodgers 1 who perceive no IT-needs, Dodgers 2 perceive situational IT-needs. Dodgers 2 also are the only users who do not satisfy affiliation needs through IT and have extremely low scores (in most instances, the lowest) on all variables; they however show some intrinsic motivation to know IT. A second group previously unidentified (which we name Players), was also brought to light. Like the Dodgers 2, Players have very low scores on all variables except that they fulfill affiliation needs through IT and they have a fairly high level of intrinsic motivation to know IT and passion for IT; as most of the respondents belonging to these two groups were young students, we surmised that their situational perceived IT- needs probably result from computer games practice, but these two groups should be further investigated with larger populations.
Two main elements resulting from the qualitative part of the research had to be amended and refined.
- We saw through STAGE I of the research design that POWNEE (“power needs satisfied through IT”) was not significant in the clustering processes, thus not significant to differentiate users’ groups. Therefore the dangerous users’ group, previously differentiated from other users with global perceived IT needs through their high level of power needs satisfied through IT, could not be confirmed as such but rather as a sub group of other groups. This brought us to investigate the variable POWNEE for all users’ groups as well as the number of cases with POWNEE > 4 in each of the final users’ groups (see table 3). Users which could be considered as dangerous were found in all final clusters except in the dodgers and the players groups.
- We had found in the preliminary qualitative study that passionate users (i.e. with high primary needs satisfied through IT usage) were studious, interested or dangerous. However, through quantitative methodology, we found that passionate users were either studious, disciplined or players. But we have seen that dangerous users constitute a subgroup of several other groups including the studious group and the group of players is a group which had not been previously identified through qualitative methods. Concerning the disciplined group which has replaced the interested group, the IT- motivational scores of the two groups are extremely close; however the two groups differ through their fundamental needs satisfied through IT usage and perceived IT-needs. The quantitative results appear more plausible as, from the various scores of the disciplined group compared with those of the studious group, one could interpret the users of these two groups as being extremely close and differing only in their perceived IT-needs (contextual versus global) .
Concerning the disciplined and interested users, their IT- motivational scores are extremely close; however the two groups differ mainly through their fundamental needs satisfied through IT usage and perceived IT-needs. The disciplined users will use IT in some situations whereas the interested users will use IT in all aspects of their lives and would be uncomfortable when they cannot do so. From the various scores of the disciplined group compared with those of the studious group, one could interpret the users of these two groups as being extremely close and differing only in their perceived IT-needs (contextual versus global) indicating a significant difference in the intensity of their usage.
All other elements pertaining to users’ profiles, which had been brought to light by the preliminary qualitative work, were confirmed. The comparison between qualitative and quantitative results is summarized in Table 5.
5. Limitations, future directions and corporate applications
From a methodological perspective, the main limitation of the present research is the fact that the population on which the instrument was tested is not sufficiently diversified. The questionnaire used should be administered to populations which respect the natural demographic and social equilibrium found naturally in the country in which it is being tested. It would be interesting to investigate populations from different countries and compare results obtained.
We effected a semantic cross validation of our results through their comparison with our preliminary qualitative results. Other statistical cross-validation methods could be applied in subsequent research with a greater number of participants. We applied a three-stage approach to cluster analysis, in order to have a sufficiently refined reading of users’ profiles, which resulted in nine clusters. In consequence the number of cases was insufficient to adequately apply the cross-validation approach proposed by McIntyre and Blashfield (1980) and confirmed by Punj and Stewart (1983); particularly the number of cases in the two new groups brought to light, dodgers 2 and players, was considered too low (8 for each group) to allow us to do so. This cross-validation approach involves randomly splitting the sample in half, carrying out the cluster analysis on each half of the observations and on the full set in order to verify the level of stability of the cluster solutions through a kappa coefficient of agreement; in subsequent research, we would propose to increase the number of respondents to at least 500, in order to be able to do so; alternatively one could use the “bootstrap” technique.
In future research, the seven constructs which have allowed us to bring forward the proposed users’ typology grounded in the users’ needs and motivation could be brought together and investigated as possibly constituting a new second order formative construct which could enrich our acceptance models. This new composite construct could be investigated as a possible antecedent to the well-established constructs “perceived usefulness” and “perceived ease of use” (Davis, 1989). Such an investigation is currently being conducted by the first author of the present article.
A Human Resource instrument could be proposed to allow the ex ante identification of IT-users’ profiles before and during new IT-implementations in corporate settings. In managerial terms, this may help the customization of IT-training sessions in order to fulfill adequately users’ needs which have been shown to vary depending on users’ profiles. To give an example, a user whose fundamental needs include the absolute and passionate need to use IT in his/her everyday life would require a very different training on a new IT tool than a user who will approach any IT with a negative stance (which may be due, for example, to unsuccessful previous IT experiences) or than a user with a deeply ingrained fear of IT. Such an instrument has been developed and has been tested in one of the biggest French multinational corporations with extremely encouraging results.
6. Conclusion
In this study, we have shown that IT-users’ groups emerge as differentiated by the users’ needs and motivation. Through a three-stage designed cluster analysis of the data collected from a purposely diversified population including 247 participants, we confirmed and refined a users’ taxonomy previously brought to light through qualitative methods which may help towards users’ profiling during new IT implementation. This profiling allows the customization of users’ IT training and may guide IS design. This study opens the way to
further research which may bring forward some antecedent to the well established construct of perceived usefulness, as deemed important by some in our field (Benbasat & Barki, 2007).
References
Alderfer, C. P. (1969). “An Empirical Test of a New Theory of Human Needs,” Organizational Behavior and Human Performance (4), pp.142-175.
Au N., Ngai E, and Cheng T. (2008). “Extending the Understanding of End user Information Systems Satisfaction Formation : An Equitable Needs Fulfillment Model Approach”. MIS Quarterly. Vol.32 No.1, pp 43-66.
Benbasat I. and Barki H. (2007). “Quo vadis, TAM” Journal of the Association for Information Systems. Volume 8, Issue 4, Article 3, pp 221-218.
Davis, F., Bagozzi, R. P., and Warshaw, P. R. (1992). “Extrinsic and Intrinsic Motivation to Use Computers in the Workplace” Journal of Applied Social Psychology (22:14), pp. 1111-1132.
Davis, F. (1989) “Perceived Usefulness, Perceived Ease of Use, and User acceptance of Information Technology”. MIS Quarterly. Vol. 13, No. 3, pp. 319-340.
Davis, F. (1986). A Technology Acceptance Model for Empirically Testing New End-User Information Systems: Theory and Results. Doctoral Dissertation, MIT Sloan School of Management, Cambridge, MA.
Deci E., and Ryan, R. (2008). “Facilitating optimal motivation and psychological well-being across life’s domains”. Canadian Psychology. Vol. 49, pp. 14-23
Deci E. and Ryan R (1985). Intrinsic motivation and self determination in human behavior. New York: Plenum.
First Author (2009). (2009) “Development of an Instrument to Assess Individual IT-Culture”. AMCIS Proceedings. (Americas Conference on Information Systems). Août 2009.
Garland K. and Noyes J. (2008) “Computer attitude scales: How relevant today?” Computers in Human Behavior. Vol. 24 n.2, pp.563-575.
Hair J., Anderson R., Tatham R., and Black W., (1995). Multivariate Data Analysis with Readings. MacMillan, Fourth edition.
Hair J. and Black W. (1998). “Cluster Analysis” in Multivariate Data Analysis by J.H. Hair, Jr., R.E.Anderson, R.L.Tatham, and W.C.Black, pp 469-518 by Prentice-Hall Inc.
Hair J., Black W., Babin B., Anderson R. and Tatham R. (2006). Multivariate Data Analysis. Pearson Education International. Sixth Edition
Herzberg, F., Mausner, B., and Snyderman, B. (1959). The Motivation to Work, New York: John Wiley.
Johnson, R.A. and Wickern, D.W. (1982), Applied Multivariate Statistical Analysis, Prentice-Hall, Englewood Cliffs, CA.
Jobson, J.D. (1992). Applied Multivariate Data Analysis Vol. 2 Categorical and Multivariate Method. Springer-Verlag, New York, NY.
Latham P. and Pinder C. (2005). “Work Motivation Theory and Research at the Dawn of the Twenty-First Century”. Annual Review of Psychology Vol.56. pp.485–516.
Loo R. (2004). “A typology of burnout types among police managers”. Policing: An International Journal of Police Strategies and Management. Vol. 27 No. 2, pp. 156-165
Markus L. and Saunders C. (2007). “Looking for a Few Good Concept and Theories for the Information Systems Setting”. MIS Quarterly Vol. 31 No. 1 pp. iii-vi/March.
Marradi A. (1990). “Classification, Typology, Taxonomy”. Quality and quantity. Vol. 24, No. 2, pp. 129-157
Massit-Folléa F. (2002) « Usages des Technologies de l’Information et de la Communication : acquis et perspectives de la recherche ». Le Français dans le Monde: « Apprentissage des langues et technologies : des usages en émergence ». pp 1-10.
Maslow, A. H. (1954). Motivation and personality (pp. 19-59, 72-75, 149-200). New York: Harper.
Maslow, A. H. (1943). “A Theory of Human Motivation”. Psychological Review (50:3), pp. 370-396.
Mc Clelland, D. C. (1965) “Toward a Theory of Motive Acquisition,” American Psychologist (20), pp. 321-333.
McIntyre, R. and Blashfield R. (1980), "A Nearest- Centroid Technique for Evaluating the Minimum-Variance Clustering Procedure". Multivariate Behavior Research. Vol. 15, pp. 225-38.
Nunnally J . (1967). Psychometric theory. New York: McGraw Hill.
Punj, G. and Stewart, D.W. (1983), “Cluster analysis in marketing research: review and suggestions for application”, Journal of Marketing Research, Vol. 20, pp. 134-48.
Ryan R. and Deci E. (2000). “Intrinsic and Extrinsic Motivation: Classic Definitions and New Directions”. Contemporary Educational Psychology 25, 54–67.
Sireci, S., Robin, F. and Patelis, T. (1999), “Using cluster analysis to facilitate standard setting”, Applied Measurement in Education, Vol. 12, pp. 301-25.
Straub D., Boudreau M-C. and Gefen D. (2004). “Validation Guidelines for IS Positivist Research”. The Communications of the Association for Information Systems. 13 :24, pp.378-427.
Vallerand, R. J., et Thill, E. (1993). Introduction à la psychologie de la motivation. Montréal : Editions Etudes Vivantes. Competitive organizations ».
Venkatesh, V., and Speier, (1999) C. “Computer Technology Training in the Workplace: A Longitudinal Investigation of the Effect of the Mood”. Organizational Behavior and Human Decision Processes (79:1), pp. 1-28.
Ward, J. (1963), “Hierarchical grouping to optimize an objective function”, Journal of the American Statistical Association, Vol. 58, pp. 236-44.
___________________________________________________________________________
Following elements are available on request:
- Questionnaire used
- Results of the principal components factor analysis done on final scale - Cluster distribution and frequencies
- Cluster wise variables importance, within cluster variations in STAGE I (two step clustering)
- Centroïds of each cluster used as seeds in K-means cluster analysis resulting from STAGE II - Iterations in final cluster centers available in STAGE III (K-means) are all available upon request.