Comparison between Thermal Airborne Remote Sensing, Multi-depth Electrical Resistivity Profiling and Soil Mapping
Texte intégral
Figure
Documents relatifs
The Liege group also continues a ground based spectral survey from the ground using a high resolution infrared interferometer, which has provided unique data on
By combining laser- induced fluorescence (LIF), sun-induced fluorescence (SIF) and canopy height distribution, the new instrument will allow the simultaneous
Two E–related variables that can be retrieved through remote sensing are essential in approaches based on re- mote sensing: the land surface temperature (LST) - derived from
For active remote sensing, different studies have shown a considerable potential for the characterization of different soil parameters: moisture, roughness, and texture.. Active
Land Surface Temperature (LST) map obtained with the Temperature and Emissivity Separation (TES) algorithm applied to Airborne Hyperspectral Scanner (AHS) data in the SEN2FLEX
Thresholds of the detection methods used in the study, namely spectral distance similarity (SDS), spectral correlation similarity (SCS), spectral similarity value (SSV), spectral
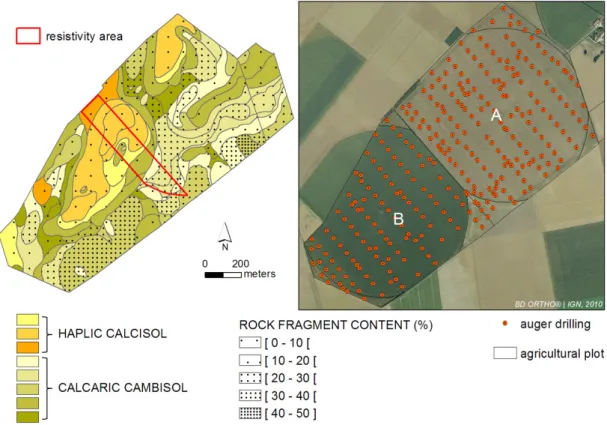
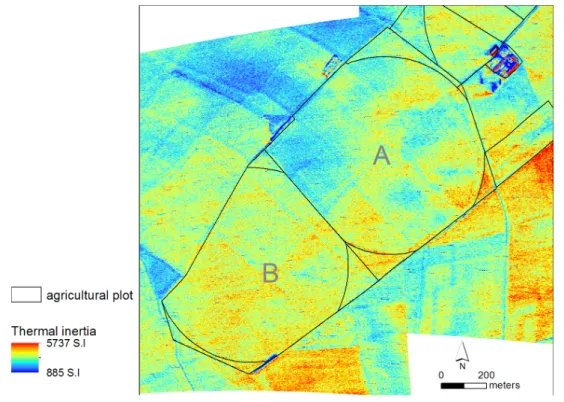
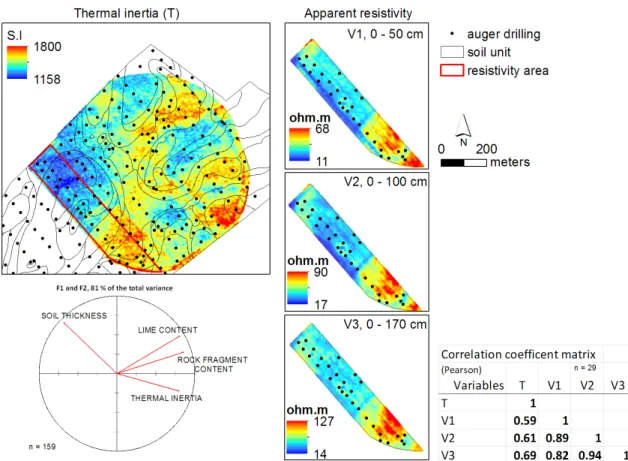
Com- parison between thermal airborne remote sensing, multi-depth electrical resistivity 1 profiling and soil mapping: an example in Beauce (Loiret, France).. Remote 15..
If source and de- tector are kept opposite to each other while the sample is scanned one consequently finds a phase change by about 30 degrees as the hole passes by (curve for
