HAL Id: hal-01142113
https://hal.sorbonne-universite.fr/hal-01142113
Submitted on 14 Apr 2015HAL is a multi-disciplinary open access archive for the deposit and dissemination of sci-entific research documents, whether they are pub-lished or not. The documents may come from teaching and research institutions in France or abroad, or from public or private research centers.
L’archive ouverte pluridisciplinaire HAL, est destinée au dépôt et à la diffusion de documents scientifiques de niveau recherche, publiés ou non, émanant des établissements d’enseignement et de recherche français ou étrangers, des laboratoires publics ou privés.
Comparison between Thermal Airborne Remote
Sensing, Multi-depth Electrical Resistivity Profiling and
Soil Mapping
C. Pasquier, I. Cousin, M. Séger, Michel Dabas, J. Thiesson, A. Tabbagh
To cite this version:
C. Pasquier, I. Cousin, M. Séger, Michel Dabas, J. Thiesson, et al.. Comparison between Thermal Airborne Remote Sensing, Multi-depth Electrical Resistivity Profiling and Soil Mapping. Near Surface Geoscience 2013 : 19th European Meeting of Environmental and Engineering Geophysics, Sep 2013, Bochum, Germany. �hal-01142113�
We S2b 14
Comparison between Thermal Airborne Remote
Sensing, Multi-depth Electrical Resistivity
Profiling and Soil Mapping
C. Pasquier (INRA), I. Cousin (INRA), M. Seger (INRA), M. Dabas (Géocarta), J. Thiesson (UPMC) & A. Tabbagh* (University Pierre et Marie Curie-Paris 6)
SUMMARY
Brightness temperature of the ground surface measured by airborne remote sensing after a cold wave in December 2002 has a sufficient depth of investigation to inform about the thermal inertia of the subsoil layer. The comparison of this thermal property to the soil map and to resistivity maps confirms this depth of investigation and shows the ability of the thermal property to distinguish between calcisol and cambisol.
Introduction
Soil physical characteristics, soil thickness, pebble density and their spatial variability are among the main parameters determining the agronomic potentiality of cultivated fields that need to be recorded at high resolution, metric or decametric, using non-destructive methods. To that aim a wide panel of remote sensing and ground based methods has been developed: remote sensing enable the estimation of soil parameters over large areas but are often limited to the estimation of the soil surface parameters, while ground based methods enable to derive soil parameters over the whole soil thickness, but they hardly can be run on large areas. The present study focuses on the assessment of one of them: the thermal airborne remote sensing that can both investigate over the whole soil thickness, and cover large areas. In one case example located in the Beauce agricultural region the surface temperature variations are compared with a series of reference data stored in a GIS: observations on soil thickness and soil content in gravel and stones achieved by auger drilling that allowed identifying haplic calcisols and calcaric cambisols, and electrical resistivity mapped over three different depths of investigation.
Soil surface temperature
The absolute value of the surface temperature of a bare soil depends on all the parameters that determine the heat balance at ground surface and it is impossible to control all of them but lateral changes in underground thermal properties may generate observable variations in surface temperature which reflect the ease with which the heat (positive or negative) can be moved downward by the subsoil. For a homogeneous solid and unsteady heat inputs, the temperature changes are inversely proportional to the thermal inertia:P KCv , where K is the thermal conductivity and Cv the
volume heat capacity. It is thus usual to express the results of a thermal prospection in terms of variations in apparent thermal inertia (Price 1977) of the ground. However the compaction plays a great role in the thermal properties, for bare soils tillage of the cultivated layer tends to homogenise the surface temperature of each parcel. Consequently it is important to evaluate the conditions under which the depth of investigation of the method will overpass the first layer (Scollar et al. 1990). This depth does not depend on the choice of a frequency or of other instrument parameters but on the history of the heat exchange at ground surface before the measurement time: if the duration of a transient input of heat (respectively output) stayed one or two days the depth of investigation would be limited to roughly 25 cm while it would reach 1m if the transient input stayed one week or more. Material and methods
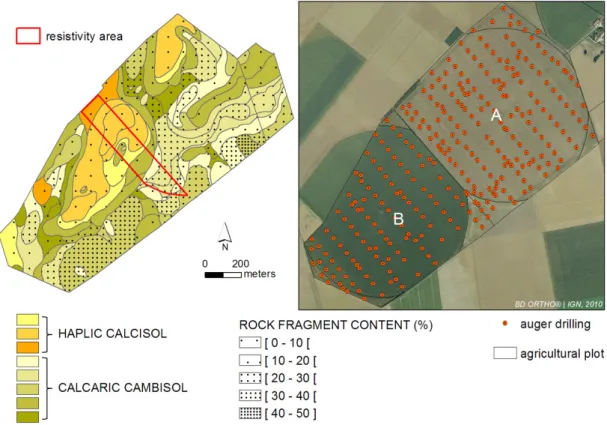
The study area is located in the Beauce region (Villamblain, Eure et Loir, France) where the loamy clayed soil has a thickness varying from 0.3 to 1.2m over the tertiary Beauce limestone. Soils are either haplic calcisol or calcaric cambisol depending on the stone content, the type of calcareous – cryoturbated or not- and the depth of the bedrock (Nicoullaud et al. 2004). Figure 1 presents the sampling pedological scheme for augering and the resulting soil map. The study area then consists of two parcels, named A and B in the following.
Over parts of the study area, a series of multi-depth resistivity maps at different dates from 2000 to 2012 by the MUCEP or ARP© devices have been performed. Both MUCEP and ARP© systems include one injection dipole and three V-shaped measuring dipoles corresponding to increasing depths of investigation from roughly 50cm to approximately 2 m (Panissod et al., 1997). The results obtained for measurements achieved in 2012 are presented in Figure 5 (for the area contoured in red in Figures 1 and 5).
The ARIES radiometer used possesses two numerical channels one in visible and near infra-red, 0.5-1 µm, the other in thermal infra-red (Hg-Cd-Te detector), 10.5-12.5µm. Two internal blackbodies allow translating the recorded video signal in brightness temperature. The data acquisition took place on December 11, 2002 at 10h 40 U.T. with a flight altitude of 1006 m, an ‘Instantaneous Field Of View’ of 2.82 m at nadir while the sampling step along a line was 1.75 m. The mirror rotated at 36.4 Hz and the speed of the plane was 56.6 ms-1. In the temperature signal the least significant bit corresponds to
0.044 K. The data were corrected for pitch and roll (using data from the gyroscope) and anamorphic distortion before a last geometric rectification in the GIS.
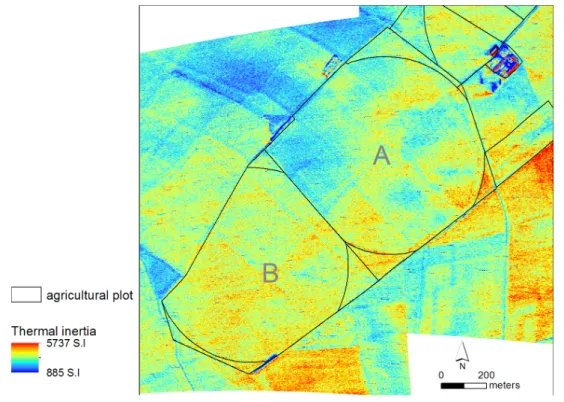
The heat flux variations at ground surface were calculated from the soil temperature data recorded at the nearby Bricy meteorological station at 10, 20, 50 and 100cm depth using the algorithm described in Scollar et al. (1990). They are presented in Figure 2 from the 15th of November. It can be observed that the cooling of the ground was significant especially in the six days preceding the flight. The depth of investigation can thus be considering as greater than the thickness of the ploughed layer. If we assume that this layer is homogenized by agricultural work, the surface temperature will reflect the thermal inertia of the subsoil beneath and will be higher if the thermal inertia is higher and lower if the thermal inertia is lower. Consequently it is possible to translate video values in terms of apparent thermal inertia of the subsoil located below the first overburden cultivated layer of 25cm thickness, 1.2 W m-1K-1 conductivity, 0.48 m2s-1 diffusivity and 1732 S.I. thermal inertia. The apparent temperature is shown in Figure 3 after transformation in subsoil apparent thermal inertia map.
Figure 1 Soil map (left) and location of auger drilled holes used to establish the soil map (right) of the A and B agricultural parcels.
Figure 2 Flux of heat in the ground at Bricy meteorological station from November 15, 2002 to December 15, 2002, the arrow indicates the measurement time.
Figure 3 Apparent thermal inertia of the subsoil layer deduced from brightness temperature in the 10.5 – 12.5 µm channel.
Comparison with auger drilling on parcel A
Around each auger drilling point on parcel A, inside a 5 m radius area, one took the median of the apparent thermal inertia values and compared it to soil classification (Figure 4). It appears that the haplic calcisol, non-calcareous, deep and unstony have apparent thermal inertia significantly different from the calcaric cambisol.
Figure 4 Apparent thermal inertia values versus soil classification: cambisols are of higher inertia than calcisols.
Comparison with resistivity mapping
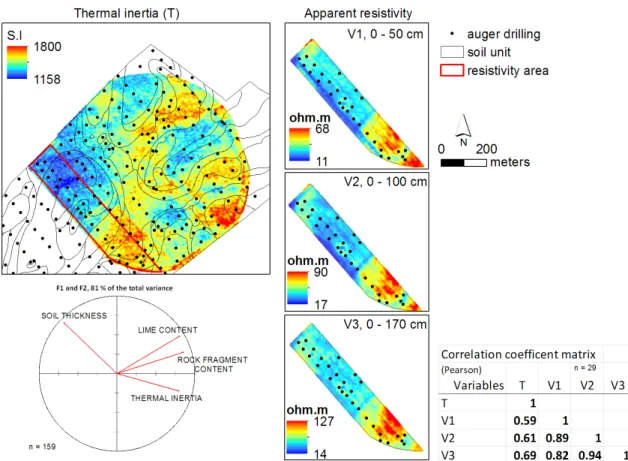
The electrical resistivity measurements achieved in 2012 are presented in Figure 5: the shallowest soils are in the South-East area, with the highest electrical resistivity values. The spatial organisation of the thermal inertia map resembles the spatial organisation of the 0-170 cm resistivity map, suggesting that the depth investigation of the two methods is similar (correlation 0.69).
Figure 5 Thermal inertia and resistivity maps (A parcel), correlation between them and first two axes of the principal component analysis results.
Conclusions
Thermal inertia mapping exhibits a good ability to distinguish between haplic calcisol and calcaric cambisol in the Beauce region context and the depth of investigation obtained for the December 2002 experiment is comparable with the one of the ARP© multi-depth system (the correlation is slightly better with V3 than with V1 or V2). Thermal airborne remote sensing presents all the advantages of airborne methods it merits, as well as ground ones, to be considered and developed in soil studies. References
Nicoullaud, B., Couturier, A., Beaudoin, N., Mary, B., Coutadeur, C. and King D. [2004] Modélisation spatiale à l'échelle parcellaire des effets de la variabilité des sols et des pratiques culturales sur la pollution nitrique agricole. In: Organisation spatiale des activités agricoles et
processus environnementaux. P. Monestiez, S. Lardon, B. Seguin (eds). Coll. Science Update, INRA
Editions, 143-161.
Panissod, C., Dabas, M., Jolivet, A. and Tabbagh, A. [1997] A novel mobile multipole system (MUCEP) for shallow (0-3m) geoelectrical investigation: the ‘Vol-de-canards’ array. Geophysical
Prospecting, 45, 983-1002.
Price, J.C. [1977] Thermal inertia mapping: a new view of the earth. Journal of Geophysical
Research, 82(18), 2582-2590.
Scollar, I., Tabbagh, A., Hesse, A. and Herzog, I. [1990] Archaeological prospecting and remote