HAL Id: hal-01611417
https://hal.archives-ouvertes.fr/hal-01611417
Submitted on 5 Oct 2017
HAL is a multi-disciplinary open access
archive for the deposit and dissemination of
sci-entific research documents, whether they are
pub-lished or not. The documents may come from
teaching and research institutions in France or
abroad, or from public or private research centers.
L’archive ouverte pluridisciplinaire HAL, est
destinée au dépôt et à la diffusion de documents
scientifiques de niveau recherche, publiés ou non,
émanant des établissements d’enseignement et de
recherche français ou étrangers, des laboratoires
publics ou privés.
Database Used for FLINT WP5 Activities: Description
and Quality Assessment
Laure Latruffe, Yann Desjeux, Pierre Dupraz
To cite this version:
Laure Latruffe, Yann Desjeux, Pierre Dupraz. Database Used for FLINT WP5 Activities: Description
and Quality Assessment. [Contract] FLINT D5.1, auto-saisine. 2016, 77 p. �hal-01611417�
DATABASE USED FOR
FLINT WP5 ACTIVITIES:
DESCRIPTION AND
QUALITY ASSESSMENT
Laure LATRUFFE
1, Yann DESJEUX
1, Pierre DUPRAZ
11
INRA, SMART, 35000, Rennes, France
31 December 2016
Public
D5.1
ABOUT THE FLINT PROJECT
FLINT will provide an updated data-infrastructure needed by the agro-food sector and policy makers to
provide up to date information on farm level indicators on sustainability and other new relevant issues.
Better decision making will be facilitated by taking into account the sustainability performance of farms
on a wide range of relevant topics, such as (1) market stabilization; (2) income support; (3) environmental
sustainability; (4) climate change adaptation and mitigation; (5) innovation; and (6) resource efficiency.
The approach will explicitly consider the heterogeneity of the farming sector in the EU and its member
states. Together with the farming and agro-food sector the feasibility of these indicators will be
determined.
FLINT will take into account the increasing needs for sustainability information by national and
international retail and agro-food sectors. The FLINT approach is supported by the Sustainable Agriculture
Initiative Platform and the Sustainability Consortium in which the agro-food sector actively participates.
FLINT will establish a pilot network of at least 1000 farms (representative of farm diversity at EU level,
including the different administrative environments in the different MS) that is well suited for the
gathering of these data.
The lessons learned and recommendations from the empirical research conducted in 9 purposefully
chosen MS will be used for estimating and discussing effects in all 28 MS. This will be very useful if the
European Commission should decide to upgrade the pilot network to an operational EU-wide system.
PROJECT CONSORTIUM:
1
DLO Foundation (Stichting Dienst Landbouwkundig Onderzoek)
Netherlands
2
AKI - Agrargazdasagi Kutato Intezet
Hungary
3
MTT Agrifood Research Finland
Finland
4
IERiGZ-PIB - Instytut Ekonomiki Rolnictwa i Gospodarki
Zywnosciowej-Panstwowy Instytut Badawcy
Poland
5
INTIA - Instituto Navarro De Tecnologias e Infraestructuras Agrolimentarias
Spain
6
ZALF - Leibniz Centre for Agricultural Landscape Research
Germany
7
Teagasc - The Agriculture and Food Development Authority of Irelan
Ireland
8
Demeter - Hellenic Agricultural Organization
Greece
9
INRA - Institut National de la Recherche Agronomique
France
10 CROP-R BV
Netherlands
11 University of Hohenheim
Germany
MORE INFORMATION:
Drs. Krijn Poppe (coordinator)
e-mail: krijn.poppe@wur.nl
Dr. Hans Vrolijk
e-mail: hans.vrolijk@wur.nl
LEI Wageningen UR
phone: +31 07 3358247
P.O. Box 29703
2502 LS The Hague
www.flint-fp7.eu
The Netherlands
TABLE OF CONTENTS
List of tables ... 5
List of figures ... 6
List of acronyms... 7
1
Introduction ... 8
2
General description of the database ... 9
2.1
Structure of the database ... 9
2.2
Some important notes before using the data ... 10
3
Description of the variables in the 5 datasets ... 11
3.1
The ‘FADN dataset’ ... 11
3.2
The ‘FLINT dataset’ ... 11
3.3
The ‘Indicator dataset’ ... 12
3.4
The ‘Standard Results dataset’ ... 17
3.5
The ‘Typology dataset’ ... 17
4
Strengths and weaknesses of the data in the ‘FLINT dataset’ and ‘Indicator dataset’ ... 18
4.1
Strengths of the FLINT test project: evidence of the usability of the data ... 18
4.2
Limits in the usability of the data: lessons for future replications of the FLINT test project .... 19
4.2.1
Missing data ... 19
4.2.2
Range of observations and problematic values ... 25
4.2.3
Comparability across and within countries ... 28
5
Conclusion ... 31
References ... 32
Appendix A : Summary list of FLINT data collected (‘FLINT dataset’)... 33
Appendix B : Detailed list of variables, from ‘FLINT dataset’ and ‘Indicator dataset’, used in WP5 case study
analyses ... 38
Appendix C : Basic statistics for non-boolean ‘FLINT dataset’ variables ... 45
Appendix D : Basic statistics for ‘Indicator dataset’ variables ... 61
LIST OF TABLES
Table 1: Number of farms in the whole FLINT database, per EU country ... 10
Table 2: FADN data tables (‘FADN dataset’) ... 11
Table 3: FLINT data tables (‘FLINT dataset’) ... 12
Table 4: Description of FLINT indicators available in the ‘Indicator dataset’ ... 12
Table 5: Number of ‘FLINT dataset’ and ‘Indicator dataset’ variables directly used in WP5 analyses (case
study deliverables D5.2) ... 19
Table 6: Statistics on the percentage of valid observations (i.e. non NA) of ‘FLINT dataset’ variables per
theme ... 21
Table 7: Statistics on the percentage of valid observations (i.e. non NA) for ‘Indicator dataset’ variables
... 22
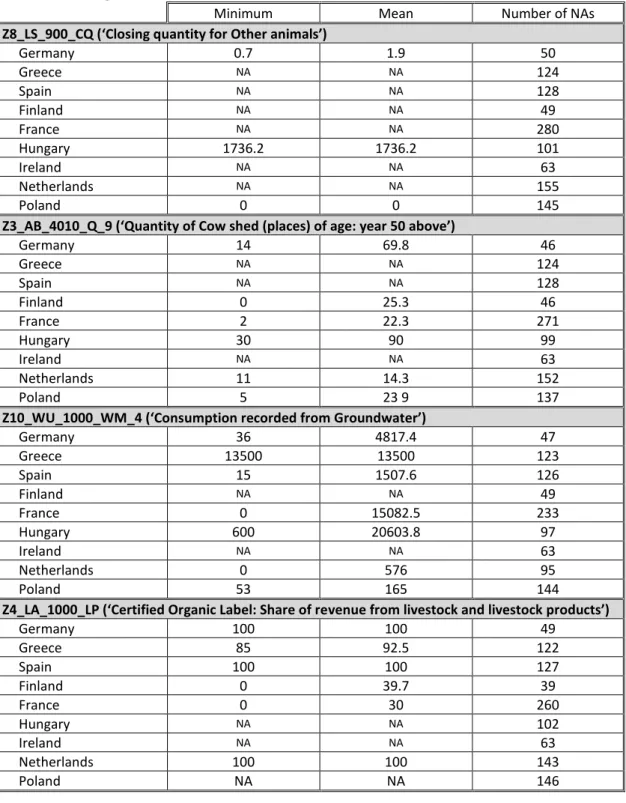
Table 8: Descriptive statistics of four variables highlighting the different strategies of FLINT partner
countries with regard to 0 values ... 25
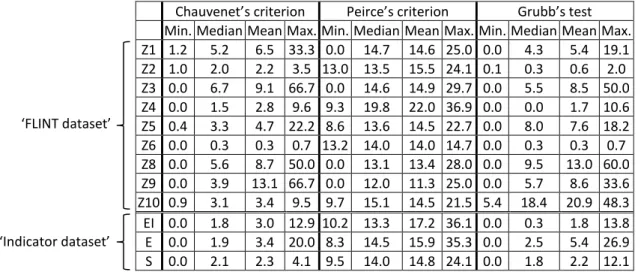
Table 9: Summary statistics on percentages of detected outliers per ‘FLINT dataset’ Z variables and per
‘Indicator dataset’ thematic variables ... 27
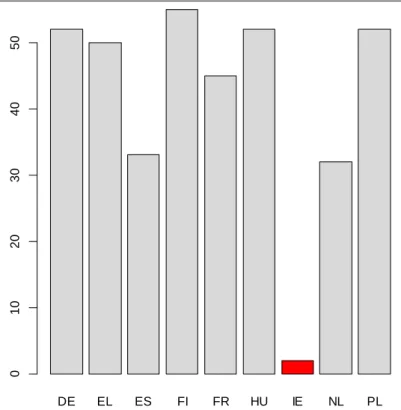
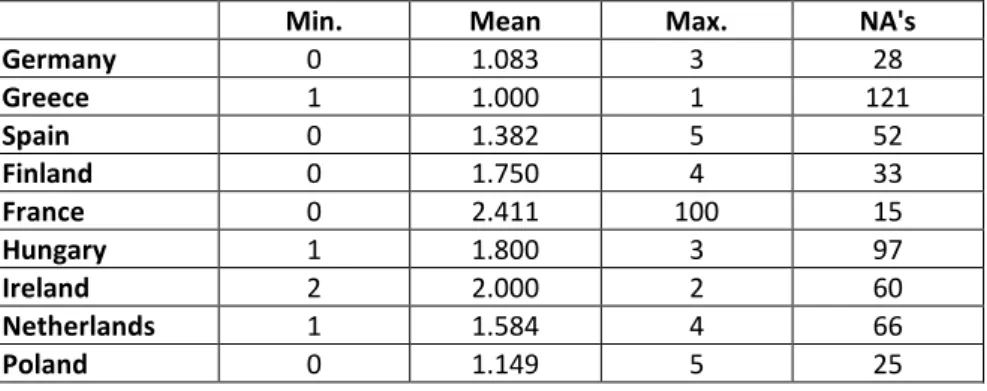
Table 10: Summary statistics, per country, on number of agricultural (related) businesses the farmer is
involved in (‘FLINT dataset’ variable Z1_OS_4010_Q) ... 30
LIST OF FIGURES
Figure 1: Workflow diagram per country ... 9
Figure 2: Density of valid observations for ‘FLINT dataset’ variables ... 21
Figure 3: Share of farms having implemented at least one innovation within the last three years, per
country in the FLINT pilot network ... 29
LIST OF ACRONYMS
CAP
Common Agricultural Policy
CU
(National) Currency Unit
EC
European Commission
EFA
Ecological Focus Area
EU
European Union
FADN
Farm Accountancy Data Network
GHG
Greenhouse Gases
LPIS
Land Parcel Identification System
N
Nitrogen
NUE
Nitrogen Use Efficiency
P
Phosphorus
TF
Type of Farming
UAA
Utilised Agricultural Area
VAT
Value Added Tax
1 INTRODUCTION
The objective of the FLINT project is to provide an updated data-infrastructure needed by the agro-food
sector and policy makers to have access to up to date information on farm level indicators on sustainability
and other new relevant issues. Better decision making is facilitated by taking into account the
sustainability performance of farms on a wide range of relevant topics. This is realised by complementing
the farm-level data of the Farm Accountancy Data Network (FADN) of the European Union (EU) with
information about farm sustainability. FADN data contain information on economic sustainability of farms
but it is mainly limited to revenues and costs; for this reason, the FLINT project has completed the FADN
data with economic information on innovations, risk and market outlets. As for environmental and social
data, they are rather scarce in FADN but the FLINT project has collected a wide range of information on
greening, land management, pesticides, nutrient balance, energy, water, farmers’ use of extension,
farmers’ quality of life, etc.
Through various means (face-to-face surveys, phone interviews, postal survey, data collection from other
sources, etc) additional data has therefore been collected during the FLINT project from 1,099 farmers
from nine EU countries (i.e. the Netherlands, Hungary, Finland, Poland, Spain, Ireland, Greece, France and
Germany).
Workpackage (WP) 5 of the FLINT project aims at analysing the value added of these newly collected data.
Within this WP5, this first deliverable D5.1 aims at presenting the structure and the content of the
database, as well as discussing issues of data quality and to learn from experiences in FLINT in order to
improve the usability of the new data if the FLINT test is replicated in the future.
The deliverable is organised as follows. Section 2 describes the database, while section 3 explains the
supporting documents. Section 4 discusses the strengths and weaknesses of the data and section 5
concludes.
2 GENERAL DESCRIPTION OF
THE DATABASE
2.1 Structure of the database
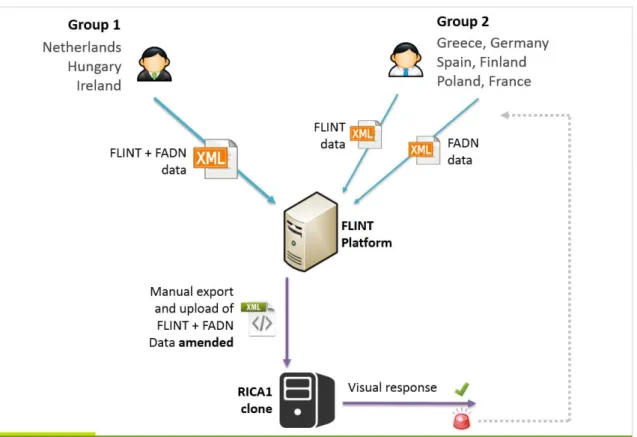
Although the data flows may vary across countries (Figure 1), the final database to be used for analyses
conducted within FLINT WP5 is made of five different flat datasets that can be extracted from the FLINT
Platform.
Namely:
The ‘FADN dataset’, containing the (classic) FADN data
The ‘FLINT dataset’, containing the additional data specifically collected within the FLINT project
The ‘Indicator dataset’, containing the indicators computed with the above-mentioned FLINT data
The ‘Standard Results dataset’, containing a set of standard results computed from FADN data
The ‘Typology dataset’, containing a set of typology variables computed from FADN data
The whole database is then obtained by merging these 5 datasets by "FADN_ID", which is a variable
providing each farm with a unique identifier number.
Figure 1: Workflow diagram per country
The whole database contains 1,099 farms from nine EU countries (Table 1). More details on the FLINT
pilot farm network and its characteristics are provided in FLINT Deliverable 2.4.
Table 1: Number of farms in the whole FLINT database, per EU country
France Germany Greece Spain Finland Hungary Ireland Netherlands Poland TOTAL Number of farms
concerned 280 52 124 128 49 102 63 155 146 1,099
The accountancy year considered in the database varies across countries. It is 2015 for all countries,
except for Germany and France for which the accountancy year into consideration is 2014. Note that in
the ‘FADN dataset’, the accounting year under consideration can be retrieved through ‘A_AI_70_DT’
variable (i.e. Date of closure of accounts).
2.2 Some important notes before using the
data
As regards units, in the ‘FADN dataset’, ‘FLINT dataset’ and ‘Indicator dataset’, all variables related to
areas (or area-based) are expressed in ares, while in the ‘Standard Results dataset’ all variables related to
areas (or area-based) are expressed in hectares. Therefore, some conversion may be necessary before
using the data.
Besides, in the ‘FADN dataset’, ‘FLINT dataset’ and ‘Indicator dataset’, all monetary (or monetary-based)
variables are expressed in national currency units (CU), except for Hungary where they are expressed in
thousands CU. As regards the ‘Standard Results dataset’ and ‘Typology dataset’, all monetary (or
monetary-based) variables are expressed in Euros. Therefore, when working on data for Hungary and
Poland, it may be necessary to apply some conversion rules. In such cases the following formula is to be
applied:
Variable in Euros = Variable in CU x Conversion Rate
With Conversion Rate = 0.23908 for Poland and 0.003227 for Hungary.
It is sometimes necessary to differentiate the farms by their type of farming (TF). In such cases, one may
therefore be warned that the use of the FADN variable ‘A_TY_90_TF’ is inappropriate as it refers to the
TF at the time of selection, and not to the current TF, for which the information is given by variables
‘GENERAL’, ‘PRINCIPAL’ or ‘PARTICULAR’ from the ‘Typology dataset’.
Similarly, information on economic sizes should be retrieved from ‘TOTALSO’, ‘SIZECLASS’ or ‘SIZEESU’
variables from the ‘Typology dataset’, and not from the FADN variable ‘A_TY_90_ES’ as the latter refers
only to the economic size at the time of selection.
Besides, since that the information on the economic size in terms of standard output cannot be retrieved
from the variable ‘SE005’ in the ‘Standard Results dataset’ (as this variable is NULL for all farms), such
information on standard output is to be retrieved from variables ‘TOTALSO’ or ‘SIZEESU’ from the
‘Typology dataset’.
3 DESCRIPTION OF THE
VARIABLES IN THE 5
DATASETS
3.1 The ‘FADN dataset’
The ‘FADN dataset’ consists of classic FADN data, broken down into 13 thematic data tables (Table 2).
Table 2: FADN data tables (‘FADN dataset’)
FADN data table
Theme
Table A
General information on the holding
Table B
Type of occupation
Table C
Labour
Table D
Assets
Table E
Quotas and other rights
Table F
Debts
Table G
Value added tax (VAT)
Table H
Inputs
Table I
Crops
Table J
Livestock production
Table K
Animal products and services
Table L
Other gainful activities directly related to the farm
Table M
Subsidies
The European Commission (EC) documents RI/CC 1680 v1.2 and RI/CC 1680 v2.0 (Farm Return Data
Definitions) provide FADN data definitions for accounting year 2014 and accounting year 2015
respectively.
3.2 The ‘FLINT dataset’
The ‘FLINT dataset’ consists in the data specifically collected for the FLINT project and covering a wide
range of information on greening, land management, pesticides, nutrient balance, energy, water, farmers’
use of extension, farmers’ quality of life, etc. Similarly to the case of FADN, this dataset is organised in
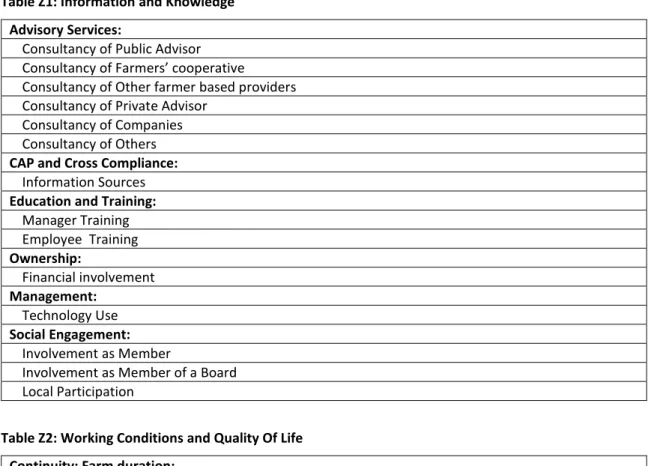
thematic data tables (Table 3), which are further detailed in Appendix A.
Table 3: FLINT data tables (‘FLINT dataset’)
FLINT data table
Theme
Table Z1
Information and Knowledge
Table Z2
Working Conditions and Quality Of Life
Table Z3
Innovation
Table Z4
Economic
Table Z5
Land Management
Table Z6
Risk Reduction
Table Z7
Pesticide Usage
Table Z8
Nutrient Balance
Table Z9
Energy
Table Z10
Water
The FLINT Deliverable 4.1 (Farm Return Data Definitions for FLINT) provides an extensive documentation
on all variables considered within the FLINT data.
3.3 The ‘Indicator dataset’
The ‘Indicator dataset’ contains all the 214 indicators produced within the FLINT project and computed
based on FADN and FLINT variables. A specific FLINT deliverable (i.e. Deliverable 2.3) is devoted to the
Final set of indicators and variables, but this set of indicators has further been the subject of regular
adjustments over the course of the project. The final list of indicators available in the ‘Indicator dataset’
is presented in Table 4.
Table 4: Description of FLINT indicators available in the ‘Indicator dataset’
Theme Sub-theme Indicator ID Indicator description Unit
En
vi
ro
n
m
e
n
t
Greening: Permanent grasslandE_1_1 Share of permanent grassland under intensive
management %
E_1_2 Share of permanent grassland that is extensively
managed with semi-natural vegetation %
E_1_3
Share of permanent grassland that is extensively managed with semi-natural vegetation under nature protection
% Greening:
Existing/created areas of EFA
E_2_1 Preferred EFA element on farms with arable area
E_2_2 Share of potential EFA area on farms with arable
area %
Semi-natural farmland
areas E_3_1 Share of semi-natural habitat area % Pesticide usage (Pesticide
risk score) E_4_1 Pesticide usage kg/ha Nutrient balance (N, P)
(farm-gate balance)
E_5_1 Farm Gate N-Balance kg N
E_5_3 Nitrogen use efficiency (NUE)
Farm management to reduce nitrate leaching
E_10_1 Percentage of farm UAA with early catch crop %
E_10_2 Percentage of farm UAA with late catch crop %
E_10_3 Weighted percentage of catch crop within farm UAA %
E_10_4 Percentage of farm UAA with nitrate risk %
Farm management to reduce soil erosion
E_11_1 Percentage of farm UAA associated with erosion risk %
E_11_2 Percentage of erosion risk area not ploughed %
E_11_3 Percentage of erosion risk area with catch crop
E_11_4 Percentage of erosion risk area with catch crop
incorporated after winter %
E_11_5 Percentage of erosion risk area with soil cover in
every second row for vineyards or orchard %
E_11_6 Percentage of erosion risk area with soil cover in
every row for vineyards or orchard %
E_11_7 Weighted percentage of erosion risk area with soil
cover %
E_11_8 Percentage of farm area with erosion mitigation %
GHG total emissions on
the farm E_14_1 GHG emissions, at farm level t CO2 eq.
Water usage and storage
E_16_1 Direct blue water footprint (kg). Water consumption
/kg of product. m3/kg
E_16_2 Direct blue water footprint (CU). Water
consumption /CU of product. m3/CU
E_16_3 Water consumption metering. % of measured
consumption %
E_16_4 Water price: Water cost/water consumption CU/m3
E_16_5 Main source of water integer
Irrigation practices
E_17_1 Water governance integer
E_17_3 Water consumption (m3)/irrigated area (ha) m3/ha
E_17_4 Water irrigation system integer
E_17_5 Energy dependence integer
Crop species diversity E_18_1 Crop species diversity decimal
Ec
o
n
o
m
ic
InnovationEI_1_1 Product Innovation at farm level dummy
EI_1_2 Process innovation at farm level dummy
EI_1_3 Market and organisational innovation at farm level dummy
EI_1_4 Innovation at farm level dummy
Producing under a label or brand
EI_2_1 Farm under label integer
EI_2_2 Experience in label production years
EI_2_3 Degree of certified organic label (minimum across
activities) %
EI_2_4 Degree of certified organic label (weighted average
of activities) %
EI_2_5 Share of UAA under certified organic label share
EI_2_6 Share of UAA under EU public quality label share
EI_2_7 Share of UAA under other collective quality label share
Types of market outlet
EI_3_1_4010 Number of markets outlets for cereals (excluding
straw and silage) integer
EI_3_1_4020 Number of markets outlets for oilseeds and protein
crops integer
EI_3_1_4030 Number of markets outlets for fruits and vegetables
(including citrus fruits, but excluding olives) integer
EI_3_1_4040 Number of markets outlets for olives integer
EI_3_1_4045 Number of markets outlets for olive oil integer
EI_3_1_4050 Number of markets outlets for grapes integer
EI_3_1_4055 Number of markets outlets for wine integer
EI_3_1_4060 Number of markets outlets for beef and calves integer
EI_3_1_4070 Number of markets outlets for cow’s milk integer
EI_3_1_4080 Number of markets outlets for pig integer
EI_3_1_4090 Number of markets outlets for sheep and goats
(milk, milk product and meat) integer
EI_3_1_4100 Number of markets outlets for poultry integer
EI_3_1_4110 Number of markets outlets for eggs integer
EI_3_1_4120 Number of markets outlets for other sector integer
EI_3_1_4130 Number of markets outlets for fodder (including
hay, straw, silage) integer
EI_3_1_4140 Number of markets outlets for cow milk products integer
EI_3_1_4150 Number of markets outlets for piglets integer
EI_3_2_4010 Exclusive outlet for cereals (excluding straw and
EI_3_2_4020 Exclusive outlet for oilseeds and protein crops integer
EI_3_2_4030 Exclusive outlet for fruits and vegetables (including
citrus fruits, but excluding olives) integer
EI_3_2_4040 Exclusive outlet for olives integer
EI_3_2_4045 Exclusive outlet for olive Oil integer
EI_3_2_4050 Exclusive outlet for grapes integer
EI_3_2_4055 Exclusive outlet for wine integer
EI_3_2_4060 Exclusive outlet for beef and calves integer
EI_3_2_4070 Exclusive outlet for cow’s milk integer
EI_3_2_4080 Exclusive outlet for pig integer
EI_3_2_4090 Exclusive outlet for sheep and goats (milk, milk
product and meat) integer
EI_3_2_4100 Exclusive outlet for poultry integer
EI_3_2_4110 Exclusive outlet for eggs integer
EI_3_2_4120 Exclusive outlet for other sector integer
EI_3_2_4130 Exclusive outlet for fodder (including hay, straw,
silage) integer
EI_3_2_4140 Exclusive outlet for cow milk products integer
EI_3_2_4150 Exclusive outlet for piglets integer
EI_3_3_4010 Diversified outlet for cereals (excluding straw and
silage) integer
EI_3_3_4020 Diversified outlet for oilseeds and protein crops integer
EI_3_3_4030 Diversified outlet for fruits and vegetables
(including citrus fruits, but excluding olives) integer
EI_3_3_4040 Diversified outlet for olives integer
EI_3_3_4045 Diversified outlet for olive oil integer
EI_3_3_4050 Diversified outlet for grapes integer
EI_3_3_4055 Diversified outlet for wine integer
EI_3_3_4060 Diversified outlet for beef and calves integer
EI_3_3_4070 Diversified outlet for cow’s milk integer
EI_3_3_4080 Diversified outlet for pig integer
EI_3_3_4090 Diversified outlet for sheep and goats (milk, milk
product and meat) integer
EI_3_3_4100 Diversified outlet for poultry integer
EI_3_3_4110 Diversified outlet for eggs integer
EI_3_3_4120 Diversified outlet for other sector integer
EI_3_3_4130 Diversified outlet for fodder (including hay, straw,
silage) integer
EI_3_3_4140 Diversified outlet for cow milk products integer
EI_3_3_4150 Diversified outlet for piglets integer
EI_3_4_4010 Main outlet for cereals (excluding straw and silage) integer
EI_3_4_4020 Main outlet for oilseeds and protein crops integer
EI_3_4_4030 Main outlet for fruits and vegetables (including
citrus fruits, but excluding olives) integer
EI_3_4_4040 Main outlet for olives integer
EI_3_4_4045 Main outlet for olive oil integer
EI_3_4_4050 Main outlet for grapes integer
EI_3_4_4055 Main outlet for wine integer
EI_3_4_4060 Main outlet for beef and calves integer
EI_3_4_4070 Main outlet for cow’s milk integer
EI_3_4_4080 Main outlet for pig integer
EI_3_4_4090 Main outlet for Sheep and goats (milk, milk product
and meat) integer
EI_3_4_4100 Main outlet for poultry integer
EI_3_4_4110 Main outlet for eggs integer
EI_3_4_4120 Main outlet for other sector integer
EI_3_4_4130 Main outlet for fodder (including hay, straw, silage) integer
EI_3_4_4140 Main outlet for cow milk products integer
EI_3_4_4150 Main outlet for piglets integer
Past/Future duration in
farming EI_4_1
Experience in decision making of the interviewed
(Survival propensity)
EI_4_2 Age of starting as a decision maker, for individual
farms only years
EI_4_3 Succession integer
Efficiency field parcel (LPIS)
EI_5_1 Number of reference parcels integer
EI_5_10 Furthest reference parcel management integer
EI_5_11 Stated favorability of the field pattern integer
EI_5_2 Average size of reference parcels ares
EI_5_3 Average distance of reference parcels kilometers
EI_5_4 Normalized average distance of reference parcels decimal
EI_5_5 Maximum distance of reference parcels kilometers
EI_5_6 Standardized maximum distance of reference
parcels (Grouping index) decimal
EI_5_7
Normalized maximum distance of reference parcels Or Doubly-normalized maximum distance of reference parcels (Structural index)
ha-1
EI_5_8 Minimum distance of reference parcels kilometers
EI_5_9 Normalized range of reference parcels distances decimal
Modernisation of the farm Investment
EI_6_1 Average age of machinery Years
EI_6_2 Average age of dairy assets Years
EI_6_3 Average age of sheep farm assets Years
EI_6_4 Average age of pig farm assets Years
EI_6_5 Average age of winery farm assets Years
EI_6_6 Average age of agricultural buildings Years
Insurance (events outside control of farm)
Also to include personal & farm insurance
EI_7_1 Adoption of crop insurance at farm level integer
EI_7_2 Adoption of building insurance at farm level integer
EI_7_3 Adoption of livestock insurance at farm level integer
EI_7_4 Adoption of disability insurance at farm level integer
EI_7_5 Number insured categories at farm level integer
Share of output under contract with fixed price Delivery contracts
EI_8_1 Adoption of contracts at farm level integer
EI_8_14 Average share of turnover by contracts %
EI_8_2 Contracts with price specification at farm level integer
EI_8_3 Contracts with quantity specification at farm level integer
EI_8_4 Contracts with duration specification at farm level integer
EI_8_5 Contracts with delivery specification at farm level integer
EI_8_6 Contracts with quality specification at farm level integer
EI_8_7 (Approximation of) share of turn over under
contract
integer
Risk exposure (non-agricultural activities)
EI_9_1 Adoption of farm diversification integer
EI_9_10 Count of other income sources at farm level integer
EI_9_2 Adoption of farm processing / sales integer
EI_9_3 Adoption of off farm investments integer
EI_9_4 Adoption of credit avoidance integer
EI_9_5 Adoption of hedging integer
EI_9_6 Adoption of financial reserves integer
EI_9_7 Adoption of production contracts integer
EI_9_8 Off-farm employment integer
EI_9_9 OGA (with possible subcategories) integer
So
ci
al Advisory service provided to the farm
S_1_1 Advisory contacts per year per holding. integer
S_1_2_1 Advisory contacts per year per holding:
Accountancy, bookkeeping, taxes
integer
S_1_2_2 Advisory contacts per year per holding:
Management, business planning, and marketing
integer
S_1_2_3 Advisory contacts per year per holding: crop
production
integer
S_1_2_4 Advisory contacts per year per holding: livestock
production
integer
S_1_2_5 Advisory contacts per year per holding: animal
products and services
integer
S_1_2_6 Advisory contacts per year per holding: other
gainful activities directly related to the farm
integer
S_1_2_8 Advisory contacts per year per holding: other integer
S_1_4 Number of main information sources about CAP integer
Education and training
S_2_1 Degree of agricultural training of the manager category (1-3)
S_2_2 Training days for manager category (0-4)
S_2_3 Total days for training category (0-4)
S_2_4 Share of participation in training %
S_2_5 Number of persons participating in training events integer
Ownership/management S_3_6 Financial involvement integer
S_3_7 Technology use integer
Social
engagement/participation
S_4_1 Social Engagement integer
S_4_2 Degree of social engagement integer
S_4_3 Degree of agricultural engagement integer
S_4_4 Degree of environmental engagement integer
S_4_5 Degree of societal engagement integer
Employment and working conditions
S_5_1 Total Labour in Annual Working Units integer
S_5_13 Share of other gainful work in total work %
S_5_14 On farm annual working units for manager and
family labour /Unpaid labour input in working units
integer
S_5_15 Off farm annual working hours owner integer
S_5_16 Off farm annual work spouse integer
S_5_17 Annual working hours manager integer
S_5_18 Average weekly working hours of manager integer
S_5_19 Length peak season in days integer
S_5_2 Share of unpaid labour of total labour %
S_5_20 Annual working hours during peak season integer
S_5_21 Average day working hours during peak season integer
S_5_22 Holidays per year integer
S_5_23 Regular days-off per week integer
S_5_24 Working conditions : Replacement during illness dummy
S_5_25 Working conditions : Replacement other than in
case of illness dummy
S_5_27 Length of peak season in months integer
S_5_28 Share of total manager working hours worked
during peak season %
S_5_29 Workload seasonality index during peak months integer
S_5_3
Labour force directly employed by the holding annual working hours (A+B+C+D) Total Labour in hours
integer
S_5_30 Workload seasonality index during non-peak
months
integer
S_5_4 Regularly employed labour force annual working
hours (A+B+C)
integer
S_5_5 Non-family labour force employed on a non-regular
basis annual working hours (D)
integer
S_5_6 Family labour force annual working hours (A+B)
Unpaid labour input in hours
integer
S_5_7 Non family regularly employed labour force annual
working hours(C )
integer
S_5_8 Holder annual working hours (A) integer
S_5_9 Member of the holder’s family annual working
hours (B)
integer
Quality of life/Decision Making
S_6_1 Satisfaction with job integer
S_6_10 Overall quality of life integer
S_6_2 Satisfaction with work life balance integer
S_6_3 Satisfaction with being a farmer integer
S_6_4 Satisfaction with quality of life integer
S_6_5 Satisfaction with freedom of making decision integer
S_6_6 Stress perception integer
S_6_7 Change in freedom category (1-5)
S_6_8 Change in stress category (1-5)
Local Participation S_7_1 Local participation dummy Social Diversification
Index S_7_2 Social diversification index (real sum) integer
3.4 The ‘Standard Results dataset’
The ‘Standard Results dataset’ consists of FADN Standard Results data, based on FADN data. All variables
from this dataset are documented in the EC document RI/CC 1750 (formerly RI/CC 882) (Definitions of
Variables used in FADN standard results).
3.5 The ‘Typology dataset’
The ‘Typology dataset’ consists in variables generated by RICA1 server, from FADN data. The EC document
RI/CC 1500 (Typology Handbook) documents all these typology variables.
4 STRENGTHS AND
WEAKNESSES OF THE DATA
IN THE ‘FLINT DATASET’
AND ‘INDICATOR DATASET’
Huge efforts have been devoted all along the FLINT project to design, collect, organise, use and analyse
an important set of data complementing the information that the ‘FADN dataset’ usually provides.
Looking back at the whole database produced within FLINT helps identify strengths and shortcomings in
the data generation process. Hence, this section aims at dealing with the question of how reliable the
data in the ‘FLINT dataset’ and the indicators in the ‘Indicator dataset’ are to support analyses and provide
trustful policy recommendations. We base this discussion on own exploration of the data, as well as on
the numerous case study deliverables 5.2 that have been produced within WP5 using the whole database.
We hereafter first summarise some positive evidences of the usability of data, and we then discuss in
details the limits in view of learning lessons for the future if one would be willing to duplicate or upscale
the FLINT experience within another context. In such a case, issues will have to be mostly addressed based
on that specific context, objectives and expectations. Usability regards data quality. The latter could be
assessed in different ways. We address here the issues of missing data and outliers as this enables drawing
a good picture with regard to the overall quality.
4.1 Strengths of the FLINT test project:
evidence of the usability of the data
The main positive point in terms of data usability is that there were several illustrative analyses using the
whole database. Indeed, out of the 15 case study FLINT 5.2 deliverables produced within WP5, 14 were
performed on FLINT data and/or indicators, in combination with FADN data or alone (i.e. Brennan et al.
(2016a), Brennan et al. (2016b), Eguinoa and Intxaurrandieta (2016), Herrera et al. (2016a), Herrera et al.
(2016b), Kis Csatari and Keszthelyi (2016), Latruffe et al. (2016a), Latruffe et al. (2016b), Lynch et al.
(2016), O’Donoghue et al. (2016), Saint-Cyr et al. (2016), Uthes (2016), van Asseldonk et al. (2016), van
der Meulen et al. (2016)). The diversity of analyses performed underline that the wide thematic spectrum
from the FLINT data is useful.
Another point to note from these deliverables is that the analyses show numerous significant
relationships, revealing that the FLINT variables and indicators used in the analyses are relevant. The list
of FLINT variables and indicators used within the FLINT WP5 deliverables are reported in Appendix B, and
the information is summarised in Table 5. Some salient points can be noticed from this table.
Firstly, none of the variables in FLINT tables Z7 (Pesticide Usage), Z8 (Nutrient Balance) and Z9 (Energy)
were used.
Secondly, only 3 economic variables (FLINT table Z4) were used.
Thirdly, in general approximately one-fourth of the available FLINT variables have been used in the FLINT
analyses. As for the FLINT indicators, they have been more widely used, namely 60% of the total FLINT
indicators (51 economic indicators, out of 122; 25 environmental indicators, out of 32; and 52 social
indicators, out of 60).
This does not mean that the unused variables and indicators do not make sense: it may be that some
variables have been used to produce the indicators and have not been used in the case study deliverables;
also, time was too short to carry out case studies on all indicators; finally, as it will be seen below, some
data have not been used due to their poor quality in this test project.
Table 5: Number of ‘FLINT dataset’ and ‘Indicator dataset’ variables directly used in WP5 analyses (case
study deliverables D5.2)
Number of variables /
indicators used
Table Z1: Information and Knowledge
133
Table Z2: Working Conditions and Quality Of Life
9
Table Z3: Innovation
10
Table Z4: Economic
3
Table Z5: Land Management
28
Table Z6: Risk Reduction
60
Table Z7: Pesticide Usage
0
Table Z8: Nutrient Balance
0
Table Z9: Energy
0
Table Z10: Water
26
Economic indicators (EI)
51
Environmental indicators (E)
25
Social indicators (S)
52
As regards the usability of data, the case of the social indicators relating to working conditions and quality
of life (table Z2 in Appendix A) should be underlined. This category of information contains very few
missing data, as discussed in more details section 4.2.1 and in Table 6, making the data very usable in
comparison to data from other tables. Also, the multiple information collected as regard quality of life is
highly consistent with the question directly asked, as shown in the case study deliverable by Herrera et al.
(2016a). The authors combined five indicators of perceived satisfaction on several dimensions of quality
of life and found that the combined indicator mirrored the indicator of quality of life directly asked to the
farmer. Hence, the authors conclude that ‘it is possible to collect subjective information from quality of
life either asking one single question which reflects several dimensions of quality of life, or asking several
questions capturing various dimensions to construct one composite indicator of quality of life’.
4.2 Limits in the usability of the data: lessons
for future replications of the FLINT test
project
4.2.1 Missing data
FLINT data collection and data generation processes have generated lots of missing data. Of course,
missing data is not a phenomenon that is specific to the FLINT data collection process per se as this is
intrinsically linked to surveys in general. But the extent of the presence of missing data within a dataset
gives a good picture of the exploitability of the data and the adequacy of the data generation processes
at stake (e.g. data structure, data storage).
This section describes the extent of missing data within the FLINT data and indicators, and presents some
of the reasons that could explain this situation so that the mistakes made in this test project are not
replicated if the experience is extended in the future. It is to be recalled that the WP5 analyses have been
conducted on flat FLINT data and indicators, and therefore so are the analyses described hereafter.
Missing data means that a value for a variable is absent due to the fact that (i) on the hand it is
non-reported by the farmer or data-collector, where in reality this farm should have non-reported a value, (ii) on
the other hand it is generated as so by the data-generation process (flatten process). Addressing the
reasons why values are missing is quite relevant in view of basing further replication or upscaling of the
FLINT experience.
4.2.1.1 Missing data in the information collected (‘FLINT dataset’)
We have generated a set of statistics for those of the 1,173 FLINT variables that are non-boolean, as shown
in Appendix D. By construction, boolean variables take the value of 1 or NA (i.e. ‘non available’ or missing
value), while non-boolean variables are not supposed to have NA values. If they have, then this is not by
construction and hence these NA values can inform on problems with the variables. Appendix D shows,
among others, the number of missing data (i.e. NA), the number of valid observations, and the share of
valid observations in total observations (1,099), per variable.
Table 6 summarises this information and presents basic statistics on the extent of missing observations
(over total observations = 1,099) at the themes levels, i.e. the FLINT Z tables. It highlights, as mentioned
above, that ‘Table Z2: Working Conditions and Quality Of Life’ is the FLINT data table for which the extent
of missing observations is not problematic, as on average the Z2 variables contain 97% of valid
observations (3% of missing observations).
It is however more problematic for all other FLINT tables, for which the variables in the tables contain on
average one third, and less, of valid observations. More precisely, Z3 (Innovation), and Z8 (Nutrient
Balance) variables are to be handled with special care as they contain, at the most, less than 40% of valid
observations. It is also worthwhile noting that 12 variables related to ‘Innovation’ (Z3), 116 variables
related to ‘Nutrient Balance’ (Z8) and 27 variables related to ‘Energy’ (Z9) contain no valid observations
at all. This poor result questions the real need and the appropriate design of the concerned variables.
Overall, as discussed in section 4.2.1.3, it questions the structure of the dataset that cannot disentangle
properly ‘real missing’ values, from ‘not relevant’ values, from ‘zero’ values.
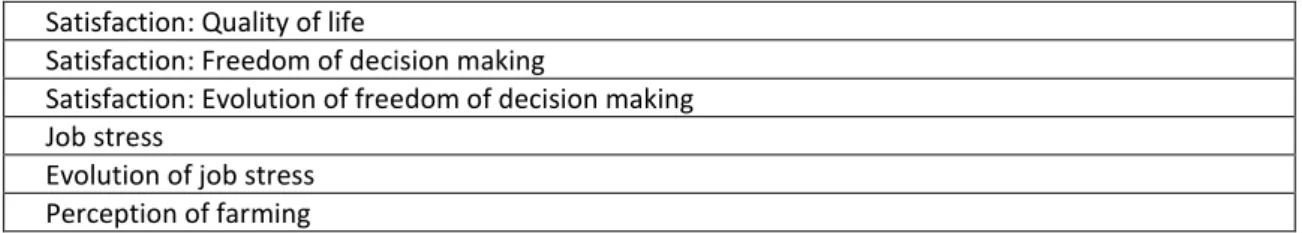
More generally, Figure 2, representing the density of valid observations for the ‘FLINT dataset’ variables
(in X-axis), shows that out of these variables, less than 200 are adequately informed with non-missing
observations.
Overall, these statistics (Table 6 and Appendix C) on missing/valid observations are to be kept in mind
while assessing the quality of the analyses conducted on the data, and should, among other, question
data design, collection and organisation processes if one would aim at replicating the FLINT experience in
another context. Nevertheless, these routine statistics could help select appropriate variables, with regard
to the information they contain, while designing indicators or conducting analyses.
One question could be whether the extent of missing data differs across countries and whether this could
be related to the way the data has been collected in the countries. Going back to the example of Z2
variables, with 97% of valid observations over the whole sample, the lowest shares of valid observations
are in the Netherlands (92%) and Spain (93%) and the highest are in France (99.4%), Poland (99.8%) and
Greece (99.6%). One reason explaining the low figure in the Netherlands is that in this country a large part
of the FADN (EU and national extension) is collected via data transfer and not via farmers’ interviews, and
hence data collectors in this country may not be used to collect data through interviews. It should be also
noted that Germany, where farmers self-reported the data (no data collectors) has an average share of
valid observations for these variables (95%). But concluding on the reasons as to why the extent of
problematic variables would differ across countries, is not possible. This could be due to differences in the
way data has been collected and to data infrastructure, or to the way data collectors have been trained
by FLINT partners, or to the way FLINT partners have understood the questions, or to cultural differences
across countries (some questions may be more sensitive in some countries than in others), etc.
Table 6: Statistics on the percentage of valid observations (i.e. non NA) of ‘FLINT dataset’ variables per
theme
Min.
Median
Mean
Max.
Table Z1: Information and Knowledge
0.3
6.4
12.9
85.4
Table Z2: Working Conditions and Quality Of Life
85.4
98.4
97.0
99.6
Table Z3: Innovation
0.0
2.0
4.4
37.3
Table Z4: Economic
4.4
19.0
20.9
49.0
Table Z5: Land Management
0.2
18.3
31.3
96.7
Table Z6: Risk Reduction
1.6
14.8
23.8
95.3
Table Z8: Nutrient Balance
0.0
0.5
3.8
37.7
Table Z9: Energy
0.0
0.3
9.5
98.2
Table Z10: Water
4.7
20.6
19.6
41.5
Figure 2: Density of valid observations for ‘FLINT dataset’ variables
4.2.1.2 Missing data in the indicators calculated (‘Indicator dataset’)
Similarly to what has been previously presented (section 4.2.1.1), missing observations are naturally also
at stake for the FLINT indicators (i.e. the ‘Indicator dataset’).
In Appendix D, a set of basic statistics, among which the number of missing/valid observations and the
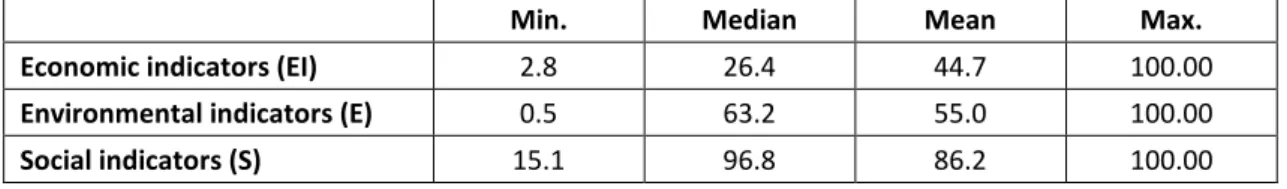
share of valid over total observations (1,099), is reported for each of the 214 FLINT indicators. Table 7
summarises this information per category of indicators (economic, environmental, and social) and the
extent of missing observations. It could generally be noticed that FLINT indicators (‘Indicator dataset’)
contain much fewer missing observations than ‘FLINT dataset’ variables (Table 6). On average, economic
indicators contain about 45% of valid observations, while the respective figures are 55% for environmental
indicators and 86% for social indicators. This might sound surprising in some cases given the information
provided in section 4.2.1.1 (a lot of missing observations in the ‘FLINT dataset’ used to compute the
indicators). To a certain extent this reveals that some missing observations in ‘FLINT dataset’ variables
have been given the value 0 during the computation of the indicators (see section 4.2.1.3). Looking back
at the data and after using them for the case study deliverables 5.2, it became clear that the proper
0 200 400 600 800 1000 1200 0 .0 0 0 0 .0 0 2 0 .0 0 4 0 .0 0 6 0 .0 0 8 density.default(x = valids) N = 1176 Bandwidth = 20.58 D e n si ty